 Open Access Article
Closing the balance – on the role of integrating biorefineries in the future energy system†
Julia
Granacher
 *a,
Rafael
Castro-Amoedo
 a,
Jonas
Schnidrig
 ab and
François
Maréchal
 a
a
aIndustrial Process and Energy Systems Engineering Group, École Polytechnique Fédérale de Lausanne, Sion, Switzerland. E-mail: julia.granacher@epfl.ch
bUniversity of Applied Sciences and Arts of Western Switzerland, Delémont, Switzerland
First published on 2nd August 2023
Abstract
Fuels from bio-based resources hold the potential to supply fossil fuel alternatives at reasonable economic and environmental expenses that can assist emission reduction in the transportation sector. However, apart from a general need to reduce fossil-based emissions, the shift from fossil energy carriers to renewables is likely to cause mismatches of supply and demand of electricity. This paper investigates the potential of integrated biorefineries to assist in balancing electricity demand and supply while co-producing fuels from biomass. At the example of a pulp mill and a nearby residential district, synergies between biomass valorization at an industrial site and residential energy demands are explored regarding defossilization potential and economic impacts. A Kraft pulp mill is integrated with thermochemical conversion processes, converting residuals of the pulping process to fuel. Power-to-fuel and fuel-to-power processes are enabled for increasing flexibility and enhancing additional fuel production in times of electricity oversupply. Multi-objective optimization is coupled with systematic solution generation and exploration approaches for deriving viable system configurations. Results indicate that direct emissions of the mill and the residential district can be reduced by up to 90% compared to the non-integrated system. Optimization of the prices of internal exchanges between mill and district reveals that this reduction comes at added expenses for all stakeholders, but that a reduction of emissions by approximately 50% provides economic benefits. Extrapolating the analysis to the European level reveals that the benefits of integration depend largely on the energy portfolio present in the considered region.
1 Introduction
The European Union (EU) aims to achieve zero net emissions by 2050. However, atmospheric CO2 emissions are still steadily increasing, suggesting that our carbon budget to limit temperature rise to 1.5 °C will be depleted in 2032,1 indicating that urgent action is required in all sectors to further limit greenhouse gas (GHG) emissions.1 Defossilizing the energy system while keeping the energy supply affordable and reliable is one key aspect of reaching this goal. As such, the stability of the electricity supply is affected by the increasing share of intermittent renewable sources introduced to the energy system, resulting in an increasing number of bottlenecks of supply.2,3 Besides spatial mismatches between electricity generation from renewable resources and demand sites, temporal discrepancies arise from the intermittent availability profile.The concept of sector coupling has gained international attention as one of the most promising options for dealing with intermittency issues. Connection and interaction of energy-demanding sectors are expected to contribute to cost-efficient defossilization by exploiting synergy potentials between energy system actors.1,2,4 One of the most holistic definitions of sector coupling is provided by the German Association of Energy and Water Industries, suggesting that “sector coupling involves the coupling of electricity, heat, and mobility as well as industrial processes and their infrastructure, while increasing the flexibility of energy demand in the industrial, household and transport sectors”.2,4
The predominant research in the area currently focuses on the temporal challenges induced by renewable energy sources, targeting two objectives: increasing the flexibility of supply and demand and enabling the storage of energy.2,4–6 For instance, the conversion of surplus electricity to hydrogen on the supply side or, on the demand side, the usage of residual heat from power generation or industrial processes for district heating are considered promising examples of sector coupling.7
As such, electrification of energy demands was identified as one core strategy for reducing emissions in the energy sector, allowing for simultaneous energy efficiency improvements and defossilization.1 Specifically in buildings, electrification of demands is widely applied.
Recently, coupling approaches of the electricity and the transport sectors have been investigated, also referred to as vehicle-to-grid, introducing storage opportunities of excess electricity in vehicles.6,8,9 As such, vehicles powered by renewable electricity and hydrogen hold great potential to mitigate emissions.1 Furthermore, bi-directional charging of vehicles is investigated as an opportunity to feed electricity back to the grid when needed.10 Limitations arise for providing freight transport and aviation demands, where storing the appropriate amounts of energy needed is not viable at reasonable energy densities and system efficiencies.
Multi-sectoral or cross-sectoral coupling is also covered in literature, for instance, looking at the coupling of heat, electricity, and transport systems in one sector11–14 as well as introducing spatial energy transportation in the analysis. A holistic overview of sector coupling approaches is provided by Fridgen et al.;2 a comprehensive review of applications is available in ref. 15.
The industrial sector is challenging to defossilize through electrification due to high-temperature heat demands and its need for carbon to produce value-added products. This requires alternatives to electrification to succeed in defossilization, such as the use of biomass or carbon capture, utilization and storage (CCUS) technologies.1 Generally, the development of bio-based products is strongly supported by the EU's industrial policy and is regarded as a key enabling technology for shifting towards a more sustainable industry.16 Developing markets and competitiveness in bio-economy sectors by sustainably increasing primary production and resource efficiency, as well as converting waste streams into value-added products, is part of the European Commission's bio-economy strategy and action plan.16 In that regard, over the last decades, interest in both single-product and integrated biorefineries has increased, reflected by the research conducted in the field.17 Analyzed bio-based products are ranging from biofuels to specialty chemicals, and pharmaceuticals.18,19 Particularly second-generation biorefineries using lignocellulosic biomass have been recognized as promising alternatives to fossil resources for producing fuels; recent advances in this domain are summarized in ref. 20. Besides advantages regarding harvest, storage, and transportation, woody biomass is favorable compared to herbous biomass in terms of energy density.21 Nowadays, the pulp and paper industry is one of the largest consumers of lignocellulosic biomass in Europe; over 19% of European roundwood is currently consumed in this industrial sector, where Kraft pulp mills are the predominant technology deployed.22
Biomass-handling sectors not only hold the potential to serve as an integrated biorefinery as demonstrated in ref. 23; they are also capable of storing and managing energy provided by renewable resources and, this way, contribute to the defossilization of the energy system.
Storage opportunities are especially interesting with regard to power-to-X (P2X) and X-to-power, as they allow to provide not only storage potential for excess renewable electricity but also fossil fuel replacements to the transportation sector. In P2X technologies, excess electricity is converted to a product X, preventing curtailment of renewable energy installations. Converting abundant molecules such as water, CO2, and air to gaseous or liquid fuels and value-added products enables storage of intermittent energy sources, while supporting the defossilization of transport and energy infrastructure.24 Generated fuels have comparable characteristics regarding energy density as fossil fuels, keeping the need to adapt the current distribution and consumption systems minimal. P2X is nowadays mainly investigated for the integration between the electricity and the gas sector. Gas storage allows to cope with seasonal variations in demand and renewable electricity supply and may also support short-term flexibility.1 Besides, adoption of P2X technologies is currently subject to strong policy support, as its potential to facilitate the integration of renewable power into energy-consuming sectors such as transportation, agriculture, and manufacturing, and effectively displacing fossil fuels while providing sector-coupling benefits is widely recognized.24 Specifically, renewable hydrogen from water electrolysis is advocated by strong policy pushes in the EU, Japan, Australia, and South Korea.24 Worldwide, there are also demonstrations of secondary CO2 conversion technologies that use renewable hydrogen and CO2 in methanation, hydrogenation, and Fischer–Tropsch (FT) synthesis to produce a variety of hydrocarbon compounds as well as in the Haber–Bosch process to produce ammonia.24 Combined with biomass valorization, the potential of P2X to provide fossil fuel alternatives is widely recognized. Using relatively small and local plants to turn biomass residues into fuel has an immense potential to replace fossil fuels and to fix large quantities of CO2.25
As stated in the latest IPCC report,26 CCUS is a set of key technologies to limit climate change-induced temperature increase to well below 1.5 °C. Particularly, the importance of geological sequestration of CO2, reforestation, and bioenergy with carbon capture and storage (BECCS) technologies are highlighted. Currently, many CO2 capture and deployment technologies are being developed, a comprehensive overview is provided in ref. 27. The pulp and paper sector may be able to serve as a potential carbon sink through the capture and storage of biogenic CO2 emissions. According to estimates, Kraft pulp mills are responsible for 73% of the CO2 emissions from the European pulp and paper industry, emitting annually more than 0.5 Mt of mostly biogenic CO2.28 While having notable CO2 capture potential, the utilization opportunities on site of captured CO2 in conventional Kraft mills is rather limited.29 In that regard, the utilization of captured carbon for bio-energy production seems to be a viable option to make the capture of biogenic CO2 at pulp mills economically attractive.
In a study provided to the European Parliament's Committee on Industry, Research and Energy, it is pointed out that the relevance of sector coupling is highly linked to the policy goal of decentralizing the energy system and shifting towards renewable-energy-based sources.1 One crucial aspect highlighted is that defossilization of the economy by decentralizing the energy system is not necessarily inducing negative burdens on society but can also be seen as a potential for new business opportunities, creating employment and contributing to a healthier and more liveable environment.1
Despite the growing interest and strong policy support towards the development of biorefinery concepts, there is little work that systematically considers biomass potential in combination with P2X for the co-production of products and storage opportunities for intermittent electricity.17 Furthermore, only limited work is available on the integration of CCUS in biorefineries, even though the large amounts of available biogenic CO2 could serve as suitable feedstock for a variety of applications.
This paper investigates the potential of coupling an integrated biorefinery with P2X, X-to-power, and CCUS technologies at the example of a Kraft pulp mill to assist the energy transition by providing fossil fuel alternatives and storage opportunities for low-impact energy. Synergies between the mill and a nearby residential district are explored, considering the potential of the integration regarding emission mitigation. Furthermore, the financial implications of the integration for the mill and district are explored.
2 Methods
A superstructure of possible system configurations is developed and assessed, including a Kraft mill with potential enhancements such as P2X, biomass-to-fuel, CCUS, and storage technologies. Furthermore, a residential district, including its transportation, electricity, and heating demands, is integrated into the superstructure. Optimization is performed considering the mill operator, the district, and a utility operator allowing for the exchange of heat between the former two in the scope of the objective function. The emissions and economic performance of obtained system configurations are compared to the conventional, non-integrated operation of the mill and the residential district. Furthermore, required economic incentives for a configuration to be viable for all stakeholders are derived and discussed regarding self-sufficiency gain and emission reduction potential.2.1 Superstructure perspectives
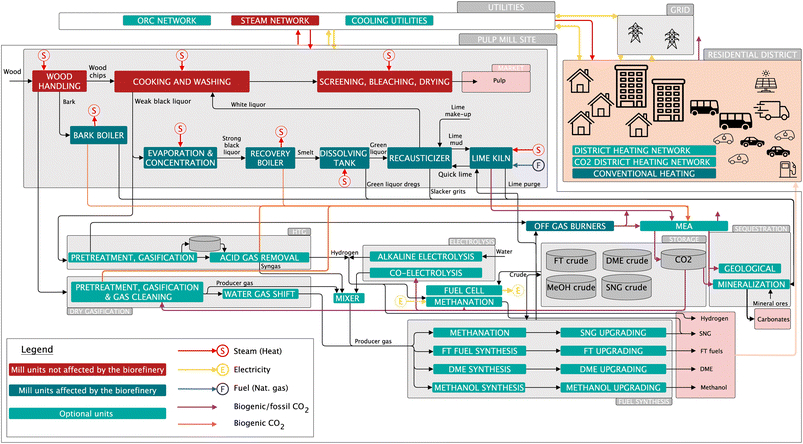
The superstructure deployed to generate solutions is adapted and enhanced from Granacher et al.,23 where the addition of fuel synthesis process units to a Kraft pulp mill is explored.| Process unit | Carbon source |
|---|---|
| Lime kiln | Calcination, burning off-gases/natural gas |
| Recovery boiler | Burning organic contents of black liquor |
| Bark boiler | Burning bark |
| Gasification and fuel synthesis | Acid gas removal, burning off-gases |
For CO2 capture, amine-based monoethanolamine (MEA) is considered, modeled with data provided in ref. 31 (ESI†).
As carbon capture by means of chemical absorption requires heat, the energy balance of the mill is affected, which is why rigorous integration with the system is inevitable to provide a holistic analysis of the capture potential.28 In the synthesized superstructure, captured CO2 can either be used in process units such as co-electrolysis or gasification; it can be sequestrated deploying mineralization, or stored geologically.
When applying mineralization for sequestrating CO2, minerals present in alkaline solid wastes of the Kraft mill (green liquor dregs, slacker grits, limepurge, and ash) are considered; the chemical composition of these streams is adapted from Quina and Pinheiro32 to estimate the amount of available minerals. Indirect and direct mineralization models are adapted from ref. 33, where information available in ref. 34 and 35 is deployed. Apart from utilizing minerals in the residues from the pulp mill, the mineral ore serpentine can be imported. Deep geological sequestration is considered by means of compressing captured CO2 and transporting it to storage sites. Detailed information about modeling assumptions on carbon capture and sequestration is provided in the ESI.†
Hourly demand data for space heating, electricity, and domestic hot water demand is generated based on the models presented in ref. 37 and 38 for the year 2019. It is assumed that heating and electricity demands will remain constant between 2019 and 2030 and that technological efficiency and shares of energy sources in providing the supply change. Furthermore, global irradiation and external temperature are considered on hourly resolution in order to calculate the efficiency of the energy conversion technologies in the district accordingly. Further details on the demands of the district are available in the ESI.†
Besides heat and electricity demand, demand for personal and freight transportation of the residential district is taken into account. The total demand for personal transport is obtained from ref. 39. It is assumed that the same distances are required in 2030 as they were in 2019, but that the portfolio of passenger cars on the streets has shifted towards a higher share of electric vehicles. Shares of energy carriers for vehicles are taken from Eurostat,40 and the share of electric vehicles is extrapolated to 2030 with the forecast data from the International Energy Agency,41 assuming the relative shares of gasoline and diesel cars remain constant. For public transportation demands, data from Eurostat40 for 2019 is used and scaled to the size of the district. Full electrical operation of regional public transportation by 2030 is assumed, following the same efficiency trends as the ones of cars. For freight transportation, the trend from ref. 41 is followed for the data obtained for 2019 from Eurostat42 and scaled to 2030 accordingly. To obtain the hourly resolution of the transportation demand, data available from the Swiss Federal Office for Statistics on traveling habits39 is used; for busses, the same relative hourly profile distribution is assumed. The ESI† provides further insights into the transport demand assumptions.
For energy efficiency improvement in transportation, trends on fuel consumption from the International Energy Agency43 are extrapolated to 2030. For converting commodities such as conventional fuels, biofuels, and electricity to transportation services, the conversion factors provided in the ESI† are used.
All electricity demands in the residential district can be satisfied by excess electricity from the mill, buying electricity from the grid, or photovoltaic (PV) panels that can potentially be installed. PV performance and economics are modeled based on ref. 44, where the electricity output is a function of area, time-dependent solar irradiation, and efficiency. The efficiency depends on the PV panel temperature, which is a function of the thermal transmission coefficient and the solar irradiation.44 An overview of parameter assumptions of the process units included in the district can be found in the ESI.†
2.2 Solution synthesis
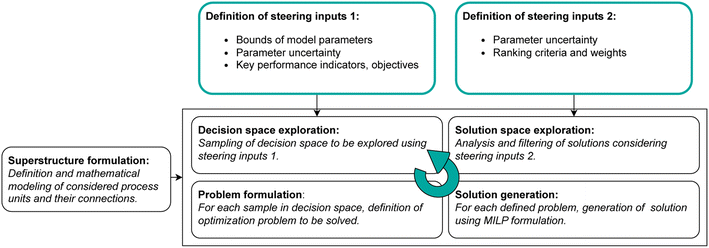
For generating solutions, a two-level solution generation and exploration framework is applied, where the upper level samples from a design space and defines a multi-objective optimization (MOO) formulation relying on the ε-constraint method, whereas the lower-level framework provides solutions for the resulting mixed integer linear programming (MILP) formulation (Fig. 2).Parameter uncertainty is considered during solution generation and exploration, as suggested in ref. 46. In the decision space exploration step, samples are drawn from a defined parameter distribution in the upper level using Latin hypercube sampling (LHS), yielding the decision space D1. For each sample in D1, an optimization problem is formulated by applying MOO. Thereby, the ε-constraint method is used to convert the MOO problem into a single objective optimization problem, formulated as a MILP. The MILP contains process unit models of the previously described superstructure, where process characteristics such as resource demands and supplies, detailed heat profiles as well as associated costs and environmental impact parameters are considered. The model is subject to mass and energy balances, and heat integration is applied during the solving process, as further described in ref. 47. The lower-level optimization problem is formulated in AMPL and solved by applying CPLEX,48 with the midgap parameter set to 1%.
For identifying solutions among the obtained configurations that perform well under parameter uncertainty, the performance is recalculated a posteriori to optimization in the solution exploration step. For this recalculation, a set of scenarios D2 describing the uncertainty in parameters is considered. Thus, D1 denotes the parameter samples for which results are generated utilizing optimization, while D2 represents the parameter samples that are used to recalculate obtained performance indicators for the configurations post-optimization.
Apart from variation in economic and environmental parameters, the upper level is sampling some bounds Y of binary decision variables of the lower-level MILP in the decision space exploration step, for generating a diverse solution space.
To capture the time-dependent character of prices and impact factors of energy commodities, weather data, and district demands, data on an hourly resolution is taken into account during solution synthesis. Further information on the considered parameters, their time dependency, and the approaches applied for acknowledging uncertainty, especially for time-dependent parameters, is provided in the ESI.† Furthermore, the MILP formulation in the lower-level framework is provided in the ESI.†
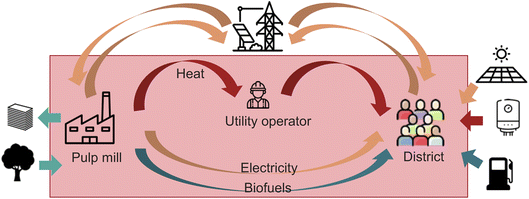
The system is analyzed from the whole system's perspective, containing the above-described district with its heating, electricity, and transportation needs, the mill, and a utility operator that can enable the heat exchange between mill and the district. The district's demands are fully considered in the optimization, meaning that for all district demands, the mass and energy balances need to be closed. Biofuels produced at the site of the mill can only be provided to the district, not sold externally. Fuel storage tanks can balance the discrepancy between times of production and demand for fuels. Waste heat from the mill can be provided to the residential district via a district heating network that is either operated on CO2 or water. Electricity can be imported and exported from the grid, and pulp can be sold. The district can satisfy its demands with commodities provided by the mill, or it can utilize conventional heating technologies and fuels from the market to meet its demands. Furthermore, it may also be connected to the electrical grid (Fig. 3). Thus, the internal market behavior between mill and residential district is neglected in the definition of the economic objectives; internal exchanges within the system between the mill and residential district (red box in Fig. 3) are considered free, although investment for required infrastructure might be required.
As solving the problem for hourly resolutions exceeds the available computational capacities of the lower-level framework, time series aggregation is applied. Further details on the time series aggregation (TSA) approach applied are provided in the ESI.†
 | (1) |
The recalculated objectives for the samples in D2 are used to identify the best-performing configurations for each scenario in D2. ‘Best’, in this case, is defined as being among the configurations closest to Pareto optimality. To avoid missing interesting configurations because they do not appear as the absolute best solutions in the evaluated scenarios but might be close to the best ones, for each sample in D2, configurations are considered to be among the best ones if their performance is not more than 5% below the one of the currently identified best-performing configurations. Simply stated, configurations that are not dominated by others for the relevant objectives are identified. Thus, the robustness rank rrobust of a configuration is measured as the number of times it occurs in the Pareto-optimal domain of D1 and the close-to Pareto-optimal domain of D2, in relation to how often it could theoretically occur (eqn (2)).
 | (2) |
The total cost of the utility operator Cutility considers the investment in the district heating network, the expenses for buying heat from the mill (Qdhn,mill) and other sources (Qdhn,other, buying included in OPEXdhn,other), the selling of heat to the district, as well as the cost for satisfying internal electricity demands (Eutility,net, eqn (4)). The cost of the residential district Cdistrict is calculated as the sum of the investment the district makes, the cost it pays for heat from the district heating network (Qdhn,mill/other,+), electricity (Edistrict,net), biofuel (mbiofuels,+), and heating and transportation demands satisfied with conventional commodities (OPEXheat,transport,conv, eqn (5)). For the cost of the mill Cmill, revenues for selling products, as well as the cost of resources and investment into fuel production process units are considered. Generally, it is assumed that all stakeholders consume their self-produced electricity and sell the excess to others. Thus, Enet always refers to the net amount of electricity a stakeholder needs to import (Enet > 0) or export (Enet < 0) to balance its internal production and demands. The electricity that is imported from the grid is assumed to be imported solely by the mill; the costs are included in OPEXmill,other (eqn (6)). Thus, Enet,mill describes the amount of electricity that the mill can provide to the other stakeholders, considering the imported electricity from the grid, the electricity it produces, and the electricity it requires.
 | (3) |
 | (4) |
 | (5) |
 | (6) |
The maximum payback period of the investment that the utility operator is facing is parameterized with ppayback,max, and the maximum changes in costs the mill operator can be subjected to compared to a reference point Cmill,ref are parameterized by fΔ,mill (eqn (7)–(10)).
| ppayback ≤ ppayback,max | (7) |
 | (8) |
| OPEXutility = (cheat,wholesales − cheat,retails)Qdhn,mills − cheat,retailsQdhn,others + OPEXdhn,others + Eutility,netscelectricitys | (9) |
| Cmill ≤ Cmill,ref(1 − fΔ,mill) | (10) |
The continuous decision variables the optimizer needs to fix (cheat,retail, celectricity, cbiofuels, cheat,wholesale) are constrained within a range of minimum and maximum costs allowed (eqn (11)–(16)); the binary variable y that activates a configuration ensures that these constraints are only active for the chosen configuration (eqn (17) and (18)).
| 0 ≤ celectricitys ≤ ys | (11) |
| 0 ≤ cbiofuelss ≤ ys | (12) |
| 0 ≤ cheat,retails ≤ ys | (13) |
| 0 ≤ cheat,wholesales ≤ ys | (14) |
| 0.2cheat,retails ≤ cheat,wholesales ≤ cheat,retails | (15) |
| cheat,retails ≤ celectricitys | (16) |
The optimization can be either performed for one selected system configuration s or in awareness of all obtained system configurations S. In the former case, the binary decision variable y that sets the configuration is fixed manually; the optimizer only fixes the costs of the internal flows for a given solution (eqn (17)). In the latter case, the optimizer chooses the most profitable system configuration for a given optimization problem (eqn (18)).
| ysi = 1, constraint added if DM selects configuration si | (17) |
 | (18) |
3 Results and discussion
The proposed superstructure design is applied to a mill producing 1000 air-dried tons (adt) of pulp per day, located in France next to a residential district. Four representative timesteps are required according to the approach followed for time-series aggregation presented in the ESI.† Three scenario samples d1 are created, considering variation in economic and environmental parameters. Furthermore, the binary variable bounds that set the consideration of a water or a CO2 DHN are varied to generate a diverse solution space. For each sample in D1 provided by the upper-level framework, the lower-level framework performs MOO for the objectives total expenditure (TOTEX) and environmental impact (EI), measured in global warming potential (GWP). Seven Pareto-optimal points are derived for each sample.3.1 Integration of mill and residential district
As elaborated in Section 2.1, the mill can produce all introduced commodities but only direct exchange with the district is allowed for biofuels and waste heat (Fig. 3). Thus, the district and its heating, transportation, and electricity demands, the mill's needs to produce a constant amount of pulp, and the possibility of exchanging goods between the two systems are considered. Heat is exchanged via a utility operator, who provides the infrastructure for district heating, buys heat from the mill, and resells it to the district. Everything that can not be provided internally can be purchased on the market, such as transportation fuels, electricity, or fuels for heating. The TSA method applied yields four required timesteps to describe the temporal dynamics of the system adequately. To determine an appropriate district size, sensitivity analysis is performed considering the heat available from the mill in conventional operation. In the following case study, a district size of 85![[thin space (1/6-em)]](https://www.rsc.org/images/entities/char_2009.gif) 000 inhabitants is analyzed.
000 inhabitants is analyzed.
The results regarding emission reduction potential per capita (cap) and the change of the TOTEX of the considered system are shown in Fig. 4. EI reduction per inhabitant of up to 950 kg CO2-eq. is possible, while the system TOTEX can be reduced by up to 75 USD per cap. The reference serving for comparison is the system in its non-integrated state. For most of the obtained configurations, the integration between mill and district leads to a lower system TOTEX compared to non-integrated operation. The combined self-sufficiency regarding electricity, heat, and transportation demands of the system (eqn (1)) can be increased to up to 60%; in the non-integrated case, it is 32%. A multi-attribute rank is computed based on the robustness of a configuration in the uncertainty domain (eqn (2)) and its combined self-sufficiency. The configurations with the highest rank are highlighted in Fig. 4, the annotations denote the avoidance cost per ton of CO2-eq. on the system level.
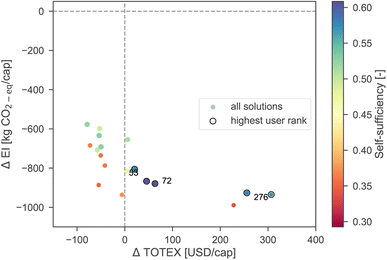 | ||
Fig. 4 System configurations compared to conventional operation with 85![[thin space (1/6-em)]](https://www.rsc.org/images/entities/char_2009.gif) 000 people in the district, annotations denote avoidance cost per ton of CO2-eq. on the system level. 000 people in the district, annotations denote avoidance cost per ton of CO2-eq. on the system level. | ||
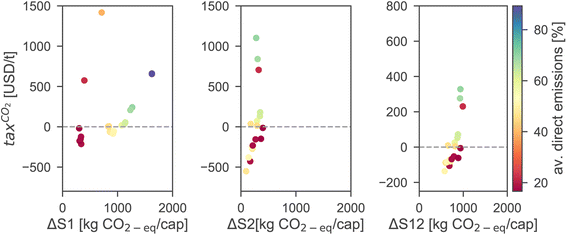
Fig. 5 shows the required CO2 taxes for obtained solutions that would make a solution as profitable as the reference for different taxation strategies. Taxation strategies refer to the avoidance of direct (S1), indirect (S2), or direct and indirect (S12) fossil emissions. Depending on the system configuration, avoidance cost ranges between −200 and 400 USD per t CO2-eq. when considering S12 emissions (Fig. 5). Details on the obtained solutions are provided in the ESI.†
Concluding from the presented analysis that a variety of system configurations exist that would enable fossil emission reduction by simultaneously reducing total cost on the system level, internal exchanges happening between the mill, the district, and the utility operator are investigated further. Solutions are generated in the absence of cost for internally exchanged goods; in order to make the analysis applicable to the real world, potential costs of exchange for biofuels, electricity, and heat are derived. When optimizing the prices of the internal flows as described in Section 2.2, the resulting costs for each stakeholder are compared to a reference configuration. For the reference configuration of the mill that the mill performance is benchmarked against, the cheapest configuration obtained from the perspective of the mill operator is chosen. For the residential district, its performance in the non-integrated system is used. In this non-integrated configuration, the mill and residential district co-exist next to each other without interacting. The mill does not install any additional units to produce biofuels, and the district satisfies its demands with imports from the market. The problem is parameterized by the payback period the utility operator is subjected to and the relative change in TOTEX of the mill, compared to the reference configuration. By parameterizing the bounds on the payback period of the utility operator's investment and the TOTEX change of the mill, a variety of solutions is generated.
The configuration with the highest direct (S1) emission reduction potential compared to conventional system operation is chosen for internal optimization. The selected configuration (ID 20) has a combined self-sufficiency of 47%, while 100% of heating demands are provided internally, 82% of the transportation demands, and 25% of electricity demands. All bark and 30% of the black liquor are gasified for fuel synthesis; additional syngas is provided from co-electrolysis. All available roof area is used for PV, and the electricity import of the system compared to non-integrated operation is increased by a factor of six. The lime kiln is operated on off-gases from fuel production, and natural gas is imported to complement the operation. Carbon capture units are installed, providing CO2 used in fuel synthesis. The heat is supplied to the district via a CO2 DHN, reducing the cooling demands of the mill compared to non-integrated operation. The utilization of the CO2 network increases electricity demands due to heat pump operation at the central plant and the district level. Compared to conventional operation, the combined self-sufficiency of the system is increased by 15%, while the self-sufficiency regarding electricity needs is decreased by 45%. Due to the relatively low EI of electricity in France considered for the analysis, the system is reducing its emissions by increasing electricity import and decreasing its dependency on fossil-based commodities for heating and transportation. On the system level, the TOTEX is increased by 60% in this configuration, mostly due to the heavy increase in electricity demand, while direct emissions on the system level are reduced by 90%.
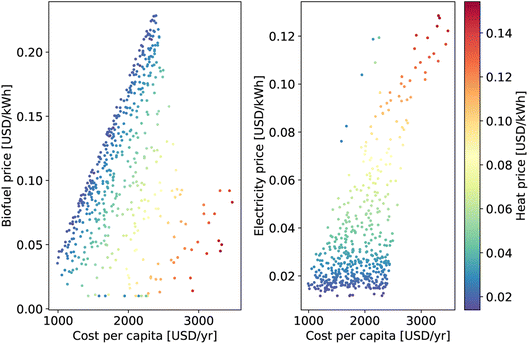
The optimization yields combinations of commodity prices for the parameterized payback period and relative ΔTOTEX of the mill that minimize the cost of the residential district. The TOTEX bound the mill is subjected to is varied between ±20% compared to the cheapest configuration for the mill operator, the highest acceptable payback period of the utility operator ppayback,max is parameterized between 2 and 10 years. As shown in Fig. 6, obtained sets of commodity prices lead to an increase of the cost per inhabitant by up to factor 3, depending on the TOTEX change the mill operator is subjected to, and the payback period of the DHN the utility operator has to face. It is not possible to decrease the district's cost compared to the conventional scenario within the analyzed parameter range. Nonetheless, it needs to be mentioned that the cost increase is mostly induced by the significantly higher demand for electricity import compared to the non-integrated operation of the district, suggesting that depending on the electricity portfolio available in the future and its associated cost, the solution performance might differ.
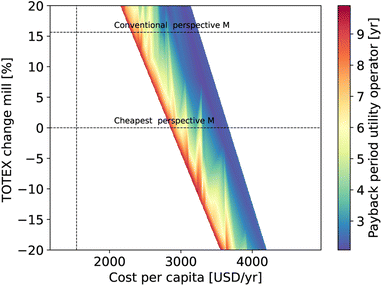 | ||
| Fig. 6 Cost per inhabitant for provision of heat, transportation, and electricity as a function of the payback period of the utility operator and ΔTOTEX of the mill for the manually selected ID 20. | ||
In the above-presented cost analysis, the configuration was selected manually, based on the direct emission reduction potential. In the following, the choice of configuration is left open; hence, for each parameterized optimization problem, the optimizer chooses a configuration and fixes the commodity prices so that the costs of the district are minimized.
Fig. 7 reveals that for minimizing the cost of the district, five configurations are chosen, out of which two (ID 6, and 8) are used in over 90% of the obtained solutions. One configuration the optimizer chooses (ID 8) also features the highest multi-attribute rank based on occurrence in the uncertain parameter domain and combined self-sufficiency. All selected configurations have higher self-sufficiency regarding electricity consumption than ID 20, compromising heating and transportation self-sufficiency and the amount for avoided emissions. Between 46 and 50% of the direct emissions are avoided, while the system TOTEX is reduced by up to 4%. In the selected configurations, various shares of bark and black liquor are gasified for fuel production, enhanced by the deployment of a co-electrolysis unit at a size of approximately 10% of the one installed in ID 20. Accordingly, less carbon is captured from the process to be valorized for fuel production. Heat is provided to the district via a CO2 network accompanied by conventional heating alternatives. In Fig. 7b, it can be seen that ID 8 is chosen in regions where the TOTEX of the mill and the residential district are low, but the utility operator faces high payback periods, whereas ID 6 is chosen in domains where the payback period of the utility operator's investment is low. As biogenic CO2 was not included in the formulation of the objective for EI, sequestration of biogenic carbon in the form of mineralization is only applied marginally, due to the negative emission targets associated with products from mineralization. Table 2 summarizes the main characteristics and KPIs of the configuration with the highest CO2 emission avoidance potential (ID 20) and the ones most often selected by the optimizer.
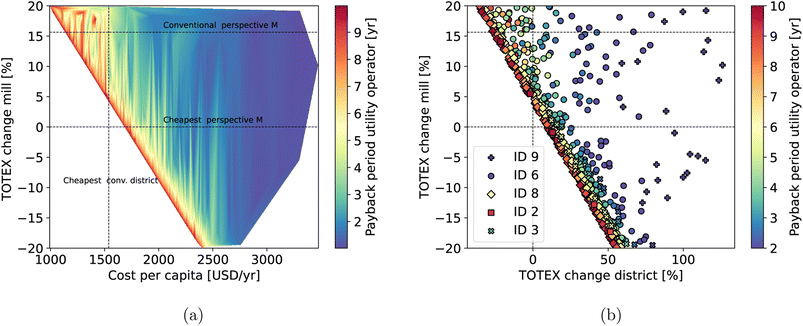 | ||
| Fig. 7 Obtained stakeholder KPIs when configuration choice is part of optimization. (a) Optimization results for parameterized constraints. (b) Choices of configuration. | ||
| ID | η transport [—] | η heating [—] | η electricity [—] | η combined [—] | Capacitya [MW] | User rankb [—] |
|---|---|---|---|---|---|---|
a Electrolysis/co-electrolysis.
b User rank refers to the multi-criteria rank computed based on robustness and combined self-sufficiency applying TOPSIS.
c ΔS1/S12reduced are calculated as  , positive values mean avoided. , positive values mean avoided.
|
||||||
| 6 | 43 | 58 | 44 | 49 | 0/8.6 | 0.77 |
| 8 | 42 | 67 | 44 | 52 | 0/8.6 | 0.82 |
| 20 | 82 | 100 | 25 | 47 | 18.5/80.0 | 0.37 |
| ID | C fossil,capt [%] | Barkgasif. [%] | Black liquorgasif. [%] | ΔTOTEXsystem [%] | ΔS1reduced,c [%] | ΔS12reduced [%] |
|---|---|---|---|---|---|---|
| 6 | 63 | 100 | 28 | −3.3 | 47 | 355 |
| 8 | 0 | 100 | 28 | −4.4 | 50 | 289 |
| 20 | 96 | 100 | 30 | 60.9 | 89 | 525 |
When the optimizer chooses the configurations based on the most favorable cost for the inhabitants of the district, the price the people need to pay for their heating, transportation, and electricity demands can be reduced compared to the non-integrated configuration, especially in the domain where the constraints on the payback period and TOTEX change of mill are relaxed. Depending on the constraints for the mill's TOTEX and the payback period of the utility operator, the district pays between 950 and 3500 USD per year per capita, equivalent to a cost reduction compared to expenses for conventional supply by up to 40%.
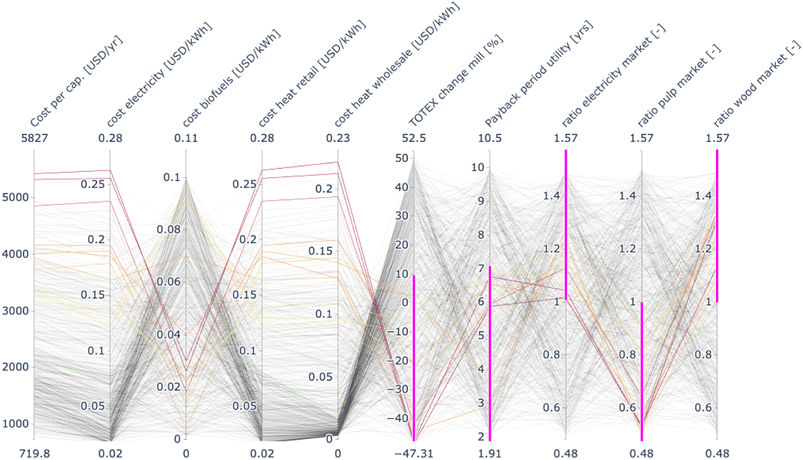
In Fig. 8, obtained price combinations for electricity, heat, and biofuels in relation to the resulting cost per inhabitant are displayed. Visualizing the obtained configurations in parallel coordinates allows for determining required selling prices of heat, electricity, and biofuels when specific conditions regarding objectives and KPIs need to be met. In the example in Fig. 9b, solutions in which the cost per inhabitant does not exceed 1600 USD per year, the TOTEX of the mill does not increase by more than 10% compared to the cheapest mill configuration, and the payback period the utility operator is facing remains below seven years are filtered. For this set of requirements, electricity prices of 0.02–0.05 USD per kW per h, biofuel prices of 0.03–0.12 USD per kW per h, and retail prices of the heat of 0.02–0.06 USD per kW per h are required. ID 6 and 8 are still viable to perform in the desired ranges of cost per stakeholder; therefore, the configuration with the highest emission reduction potential is selected. ID 6 allows for a reduction of EI on the system level by 0.71 t of CO2-eq. per inhabitant, which resembles a reduction of direct emissions by 50% compared to non-integrated operation. It needs to be noted that the configurations identified by the internal optimization to be most fitting to fulfill the imposed requirements are also the ones that feature the highest multi-criteria rank based on robustness and combined self-sufficiency, suggesting that the proposed rank is an adequate indicator to identify promising configurations.
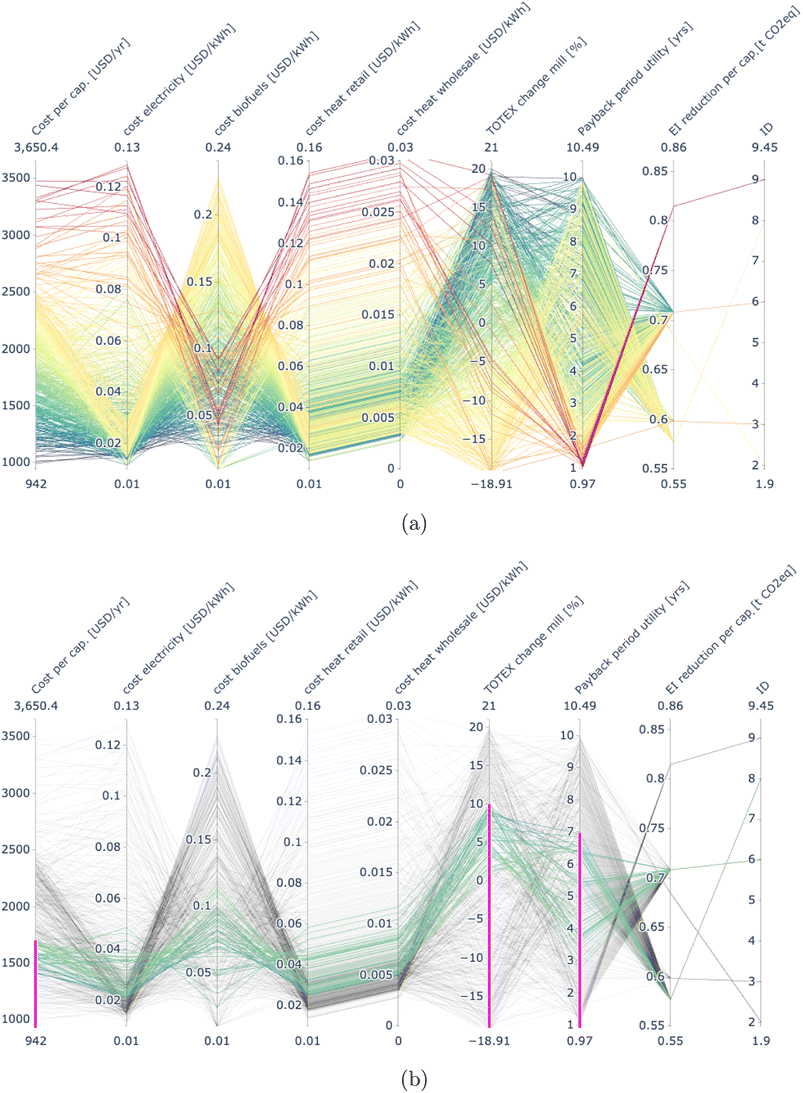 | ||
| Fig. 9 Obtained solutions in parallel coordinates. (a) All obtained solutions, (b) selection of solution based on requirements on ΔTOTEX of mill, payback period, and cost of district. | ||
Thus, the analysis has shown that it is possible to reduce the EI on the system level at reasonable economic compromises for the involved stakeholders; even the reduction of expenses is possible. As such, the installation of a DHN benefits both, the district and the mill, the latter reducing their cooling demands. Furthermore, co-producing pulp and fuel by means of gasification-based fuel synthesis leads to reduced emissions from transportation demands; the integration of co-electrolysis and carbon capture increases this potential.
It needs to be mentioned that no detailed feasibility analysis of the suggested integration was performed. As such, the heat exchange via the district heating network seems to be the least challenging to realize among the commodity exchanges, followed by the provision of easily-storable biofuels from the mill to the district. Bi-directional electricity exchange between the mill and the district seems to be more challenging in terms of realization, as additional grid infrastructure would be required. However, the production of renewable electricity for self-consumption or selling to peers is encouraged in the recast of the Renewable Energy Directive (RED II), suggesting that the general concept is in line with the policy for renewable and clean energy management.50 Furthermore, a prerequisite for realization is that all stakeholders agree to the cooperation, even though higher revenues might be temporarily available on the external market.
However, the economic analysis is highly sensitive to the market conditions surrounding the analyzed system. This is illustrated in Fig. 10, where the effects of changes in the market environment on the cost for the residential district are displayed for ID 6, the configuration with the highest emission reduction potential among the ones that meet the filtering criteria applied in Fig. 9b. Parameterized market conditions, consisting of pulp, wood, and electricity prices, are induced in the internal optimization problem, and viable prices of internal exchanges are derived for ID 6. Solutions for pessimistic market assumptions are filtered: high wood and electricity prices (ratio wood, electricity market above 1) and low pulp prices (ratio pulp market below 1). To obtain similar performance regarding the mill and the utility operator's cost, the residential district needs to make significant compromises regarding the price it pays to satisfy electricity, heating, and transportation demands. Thus, the profitability and potential of integrated configurations largely depend on the surrounding market conditions of the system. Furthermore, depending on the electricity mix available, the impact of increasing electricity import to reduce the usage of fossil-based products for transportation and heating presumably differs significantly. The analysis is extended to the European level to further explore the effects of realizing the obtained configuration in different regions.
3.2 European perspective
For the configuration with the highest EI avoidance potential among the ones identified by the internal optimization (ID 6), the emission avoidance potential from a European perspective is calculated based on the pulp production in each country. Furthermore, the cost of avoiding CO2 emissions is derived. For calculating the cost for offsetting emissions, the difference in total system cost between an obtained configuration and the reference configuration of the system is taken into account. Thus, the costs are not analyzed from the stakeholder's perspective, including the internal flows, but from the overall system perspective that was presented in Fig. 4. As such, the reference the obtained solution is compared to is the non-integrated, conventional system perspective.Thereby, emissions and costs are updated with country-specific data. Seasonal operation of the configuration is assumed to remain the same in all countries, and country-specific parameter changes are taken into account on an annual level. Thus, the presented extrapolations are not based on optimal configurations for each country; they rather suggest what would happen if all mills in Europe adopted the solution identified from the previous optimization. Hence, they are only meant to provide approximate guidance on the overall dimension of the presented analysis rather than detailed results for each country.
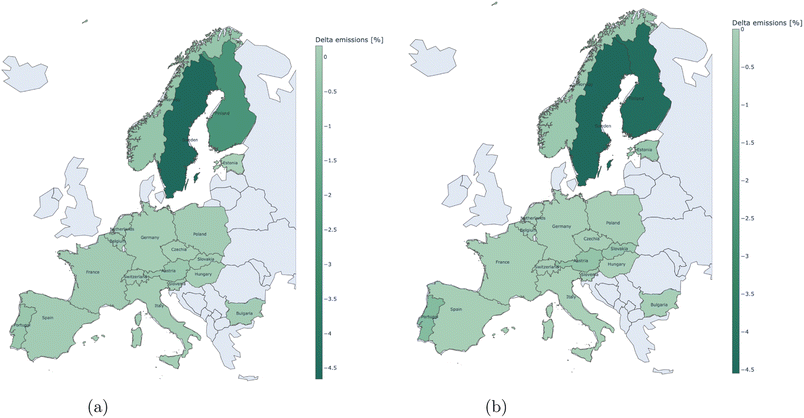
For calculating the emission avoidance potential and the cost per avoided ton of CO2, two reference points for electricity cost and EI are taken into account. One represents the prices and impact factors of today, approximated with data for 2019, and the other one includes values predicted for a widely defossilized European energy system, suggested by Santecchia.7 Both data sets are provided in the ESI.† The overall emission avoidance potential in consideration of the electricity mix of today and a defossilized electricity grid of the future is displayed in Fig. 11a and b, normalized by the emission level of the respective country, provided in the ESI.† It is noticeable that the highest emission reduction potential, relative to the emissions on the country level is present in the Nordic countries due to the large amounts of pulp products. Furthermore, when considering the electricity grid characteristics of today, EI might actually increase through the realization of ID 6 at all pulp-producing sites in a country. This is due to the large amounts of electricity imported, which might – depending on the electricity mix of the respective country– lead to an increase in overall EI. When considering the defossilized electricity grid, the overall EI is reduced in all countries.
Fig. 12a shows the cost of offsetting one ton of CO2-eq. (S12), related to the projected social cost (SC) of CO2. The SC of CO2 is a statistical measure describing the cost of climate change impact. It is assumed to be 200 USD per t CO2 (2020), as derived by Kikstra et al.49 for the PAGE-ICE assessment model for evaluating climate change. For the perspective of today, only countries where EI is reduced are displayed. It is noteworthy that for most European countries, avoiding emissions by integrating the combined pulp and fuel production is cheaper than the social cost of CO2 for the grid of today. Particularly in Italy, costs are remarkably low due to the relatively high cost of fossil fuels (ESI†). When electricity prices and impact factors of the defossilized energy system are used (Fig. 12b), the cost for offsetting increases slightly, but still, for most countries, offsetting emissions by combined pulp and fuel production is cheaper than the SC of CO2. In Belgium, the projected cost of electricity in the future defossilized grid is high compared to the European average, resulting in comparable high offsetting costs. It needs to be noted that the reference of social cost for CO2 remains the same for both perspectives, even though the actual cost might increase in the future.
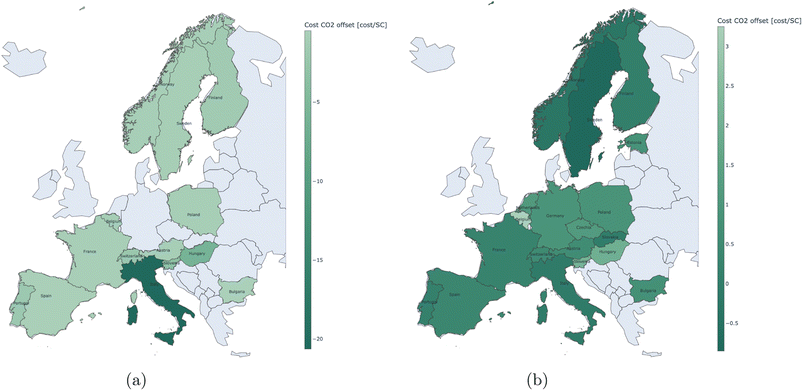 | ||
| Fig. 12 Offset price per ton of emitted CO2, with relation to the social cost (SC) of CO2, today (200 USD per t CO2-eq.). | ||
For the selected integrated configuration and its performance in the European context, both, emission mitigation and avoidance cost of emissions are largely dependent on the electricity mix available in the respective country. This suggests that in order to generate system configurations tailored to a country's characteristics, optimization on the country level would be required, considering the local parameters of electricity cost and impact factors.
4 Conclusions and outlook
In this contribution, the integration of a biorefinery pulp mill with a nearby residential district was studied. To explore the synergies of the integration, possible configurations of an interconnected system consisting of a mill operator, a residential district, and a utility operator were generated by applying superstructure optimization methods. In the integrated system, the combined self-sufficiency for supplying electricity, heat and fuels to the mill and the residential district can be increased from 32 to up to 60% compared to non-integrated operation. Direct emissions can be decreased by up to 90%, although at a significant cost increase. For more modest emission reductions of approximately 50%, costs on the system level can even be reduced compared to non-integrated operation. Throughout all obtained configurations, emissions from transport are reduced by biofuel production at the pulp mill, and increasing emission reduction is realized by electricity import for operating a co-electrolysis unit, expanding the amount of available fuels. Furthermore, a DHN is installed to provide heat to the district, reducing the mill's cooling demands. The configuration with the highest emission reduction potential profits from importing large quantities of electricity and capturing carbon released at the mill, in order to complement biofuel production from gasification and reduce fossil fuel utilization.To evaluate the effects that the implementation of an integrated system configuration might have on the stakeholders of the system, optimization of prices of internally exchanged commodities is conducted. It reveals that emission reduction on the system level is possible at reasonable compromises for the considered stakeholders and might even hold promising potential for improving their economic performance. Depending on the constraints of the economic performance offered to the mill and the utility operator, the expenses of the district change by −40 to +150% compared to the non-integrated configuration, while the solutions the optimizer selects offer a direct emission reduction potential of approximately 50%. It needs to be noted that the prices of internal commodity exchange that result from the internal optimization are below the market prices observed today. This suggests that the described exploitation of synergies and the related economic benefits for the stakeholders are only possible if all stakeholders who provide commodities to others commit to the internal exchange rather than selling their products on the market.
As it was shown by extrapolating the analysis to the European level, the actual emission reduction potential and associated prices largely depend on the electricity mix of the respective country and present market conditions. While solution generation was performed for a case study in France, where the impact factor of electricity is rather low, in other countries, the increase in electricity demand to enable fuel production might lead to increased EI. However, this effect dissipates when considering a defossilized electricity grid of the future. Nonetheless, the provided European analysis can only serve as a rather rough indicator of the potential, and eventually, optimization should be performed on the country level.
Overall, it was revealed that by coupling a Kraft pulp mill with a residential district, significant shares of the energy demand can be provided internally, while the overall environmental impact of the system can be reduced by means of low-impact biofuel and heat provision. Furthermore, storage opportunities for electricity from renewable resources emerge. Future work could include the expansion of the considered superstructure, for example by advanced CO2 capture technologies, or a more comprehensive sensitivity analysis on the considered district size. Furthermore, considering biogenic emissions in the objective function could assist in highlighting the potential of sequestration technologies. Besides, while economic and environmental criteria were included in the analysis, social aspects were not considered, which leaves room for further investigation. Moreover, the analysis pointed to the importance of a holistic perspective, as the environment in which a system is placed widely influences the solution's performance. In that regard, future work could include the expansion of the optimization-based analysis to different countries, revealing opportunities for exploiting synergies of integration that are tailored to country-specific energy portfolios and demands.
Abbreviations
| adt | Air-dried tons |
| BECCS | Bioenergy with carbon capture and storage |
| CCUS | Carbon capture, utilization and storage |
| DHN | District heating network |
| EI | Environmental impact |
| EU | European Union |
| FT | Fischer–Tropsch |
| GHG | Greenhouse gas |
| GWP | Global warming potential |
| KPI | Key performance indicator |
| LHS | Latin hypercube sampling |
| MEA | Monoethanolamine |
| MILP | Mixed integer linear programming |
| MOO | Multi-objective optimization |
| ORC | Organic Rankine cycle |
| P2X | Power-to-X |
| PV | Photovoltaic |
| RED2 | Renewable energy directive |
| SC | Social cost |
| SOEC | Solid oxide electrolysis cell |
| SOFC | Solid oxide fuel cell |
| TOTEX | Total expenditure |
| TSA | Time series aggregation |
Data availability
Data is available upon pertinent request.Author contributions
J. Granacher: conceptualization, methodology, formal analysis, validation, visualization, writing – original draft. R. Castro-Amoedo: validation, writing – review & editing. J. Schnidig: validation, writing – review & editing. F. Maréchal: supervision, conceptualization, validation, writing – review & editing.Conflicts of interest
The authors declare that they have no competing financial interests.Acknowledgements
This research has received funding from the European Union's Horizon 2020 research and innovation programme under grant agreement 818011 and under the Marie Skłodowska-Curie grant agreement no. 754462 and 754354. Further funding has been received from the Swiss Innovation Agency under the Flagship Project FLAGSHIP PFFS-21-03.References
-
L. van Nuffel, Sector coupling: how can it be enhanced in the EU to foster grid stability and decarbonise?, Policy Department for Economic, Scientific and Quality of Life Policies, 2018 Search PubMed
.
- G. Fridgen, R. Keller, M. F. Körner and M. Schöpf, A holistic view on sector coupling, Energy Policy, 2020, 147, 111913 CrossRef
.
- C. Figueres, H. J. Schellnhuber, G. Whiteman, J. Rockström, A. Hobley and S. Rahmstorf, Three years to safeguard our climate, Nature, 2017, 546(7660), 593–595 CrossRef CAS PubMed
.
- M. Robinius, A. Otto, P. Heuser, L. Welder, K. Syranidis, D. S. Ryberg, T. Grube, P. Markewitz, R. Peters and D. Stolten, Linking the Power and Transport Sectors—Part 1: The Principle of Sector Coupling, Energies, 2017, 10(7), 956 CrossRef
.
- H. Lund, B. Möller, B. V. Mathiesen and A. Dyrelund, The role of district heating in future renewable energy systems, Energy, 2010, 35(3), 1381–1390 CrossRef CAS
.
- B. V. Mathiesen, H. Lund, D. Connolly, H. Wenzel, P. A. Østergaard, B. Möller, S. Nielsen, I. Ridjan, P. Karnøe, K. Sperling and F. K. Hvelplund, Smart Energy Systems for coherent 100% renewable energy and transport solutions, Appl. Energy, 2015, 145, 139–154 CrossRef
.
-
A. Santecchia, Enabling renewable Europe through optimal design and operation, PhD thesis, EPFL, Lausanne, 2022
.
- D. Connolly and B. V. Mathiesen, A technical and economic analysis of one potential pathway to a 100% renewable energy system, International Journal of Sustainable Energy Planning and Management, 2014, 1, 7–28 Search PubMed
.
- G. Fridgen, L. Häfner, C. König and T. Sachs, Providing Utility to Utilities: The Value of Information Systems Enabled Flexibility in Electricity Consumption, Journal of the Association for Information Systems, 2016, 17(8), 537–563 CrossRef
.
- L. Haupt, M. Schöpf, L. Wederhake and M. Weibelzahl, The influence of electric vehicle charging strategies on the sizing of electrical energy storage systems in charging hub microgrids, Appl. Energy, 2020, 273, 115231 CrossRef
.
- I. Bačeković and P. A. Østergaard, Local smart energy systems and cross-system integration, Energy, 2018, 151, 812–825 CrossRef
.
- D. F. Dominković, I. Bačeković, B. Ćosić, G. Krajačić, T. Pukšec, N. Duić and N. Markovska, Zero carbon energy system of South East Europe in 2050, Appl. Energy, 2016, 184, 1517–1528 CrossRef
.
- K. Hansen, B. V. Mathiesen and I. R. Skov, Full energy system transition towards 100% renewable energy in Germany in 2050, Renewable Sustainable Energy Rev., 2019, 102, 1–13 CrossRef
.
- S. Schiebahn, T. Grube, M. Robinius, V. Tietze, B. Kumar and D. Stolten, Power to gas: technological overview, systems analysis and economic assessment for a case study in Germany, Int. J. Hydrogen Energy, 2015, 40(12), 4285–4294 CrossRef CAS
.
- K. Hansen, C. Breyer and H. Lund, Status and perspectives on 100% renewable energy systems, Energy, 2019, 175, 471–480 CrossRef
.
-
European Commission, Bio-based products, 2022 Search PubMed
.
- Z. Yuan, B. Chen and R. Gani, Applications of process synthesis: moving from conventional chemical processes towards biorefinery processes, Comput. Chem. Eng., 2013, 49, 217–229 CrossRef CAS
.
-
J. M. Douglas, Conceptual design of chemical processes, McGraw-Hill, 1st edn, 1988 Search PubMed
.
- A. D. Celebi, A. V. Ensinas, S. Sharma and F. Maréchal, Early-stage decision making approach for the selection of optimally integrated biorefinery processes, Energy, 2017, 137, 908–916 CrossRef
.
- Z. Yuan and M. R. Eden, Recent advances in optimal design of thermochemical conversion of biomass to chemicals and liquid fuels, Curr. Opin. Chem. Eng., 2015, 10, 70–76 CrossRef
.
-
A. D. Celebi, Methodology for the identification of promising integrated biorefineries, 2019 Search PubMed
.
-
European Commission, Sankey diagrams of woody biomass flows in the EU-28, 2019 Search PubMed
.
- J. Granacher, T. V. Nguyen, R. Castro-Amoedo, E. C. McDonald and F. Maréchal, Enhancing biomass utilization by combined pulp and fuel production, Frontiers in Energy Research, 2022, 10 DOI:10.3389/fenrg.2022.979502
.
- R. Daiyan, I. MacGill and R. Amal, Opportunities and Challenges for Renewable Power-to-X, ACS Energy Lett., 2020, 5(12), 3843–3847 CrossRef CAS
.
-
C. Wulf, J. Linssen and P. Zapp, Chapter 9 - Power-to-Gas—Concepts, Demonstration, and Prospects, in Hydrogen Supply Chains, ed. C. Azzaro-Pantel, Academic Press, 2018, pp. 309–345 Search PubMed
.
-
IPCC, Climate Change 2022: Impacts, Adaptation and Vulnerability. Contribution of Working Group II to the Sixth Assessment Report of the Intergovernmental Panel on Climate Change, Cambridge, UK and New York, NY, USA, 2022, p. 3056 Search PubMed
.
- Z. Yuan, M. R. Eden and R. Gani, Toward the Development and Deployment of Large-Scale Carbon Dioxide Capture and Conversion Processes, Ind. Eng. Chem. Res., 2016, 55(12), 3383–3419 CrossRef CAS
.
-
R. J. A. Moya and C. Pavel, Energy efficiency and GHG emissions: prospective scenarios for the pulp and paper industry, 2018, ISBN: 9789279891199 9789279891182, ISSN: 1831-9424, 1018-5593 Search PubMed
.
- K. Kuparinen, E. Vakkilainen and T. Tynjälä, Biomass-based carbon capture and utilization in Kraft pulp mills, Mitigation and Adaptation Strategies for Global Change, 2019, 1213–1230 CrossRef
.
-
S. Moret, Strategic energy planning under uncertainty, PhD thesis, EPFL, Lausanne, 2017
.
- S. Heyne and S. Harvey, Impact of choice of CO2 separation technology on thermo-economic performance of Bio-SNG production processes, Int. J. Energy Res., 2014, 38(3), 299–318 CrossRef CAS
.
- M. J. Quina and C. T. Pinheiro, Inorganic Waste Generated in Kraft Pulp Mills: The Transition from Landfill to Industrial Applications, Appl. Sci., 2020, 10(7), 2317 CrossRef CAS
.
- R. Castro-Amoedo, J. Granacher, M. A. Daher and F. Marechal, On the role of system integration of carbon capture and mineralization in achieving net-negative emissions in industrial sectors, Energy Environ. Sci., 2023 10.1039/d3ee01803b
.
- H. Ostovari, A. Sternberg and A. Bardow, Rock ‘n’ use of CO2: carbon footprint of carbon capture and utilization by mineralization, Sustainable Energy Fuels, 2020, 4(9), 4482–4496 RSC
.
-
J. Sipilä, S. Teir and R. Zevenhoven, Carbon Dioxide Sequestration by Mineral Carbonation: Literature Review Update 2005–2007, Abo Akademi University, 2008 Search PubMed
.
-
Federal Statistical Office, Energy sector, 2022 Search PubMed
.
-
P. M. Stadler, Model-based sizing of building energy systems with renewable sources, PhD thesis, EPFL, Lausanne, 2019
.
-
L. Middelhauve, On the role of districts as renewable energy hubs, PhD thesis, EPFL, Lausanne, 2022
.
-
Office fédéral de la statistique/Office fédéral du développement territorial, Comportement de la population en matière de transports - Résultats du microrecensement mobilité et transports 2015, Mobilité et transports, Neuchâtel and Bern, 2017 Search PubMed
.
-
Eurostat, Passenger cars, by type of motor energy, 2022 Search PubMed
.
-
International Energy Agency, Net Zero by 2050 - A Roadmap for the Global Energy Sector, International Energy Agency, 2021, p. 224 Search PubMed
.
-
Eurostat, Modal split of freight transport, 2022 Search PubMed
.
-
International Energy Agency, Vehicle fuel economy in major markets 2005-2019, International Energy Agency, 2021 Search PubMed
.
-
R. Suciu, P. Stadler, A. Ashouri and F. Maréchal, Towards energy-autonomous cities using CO2 networks and power to gas storage, in Proceedings of ECOS 2016, Postoroz, Slovenia, 2016 Search PubMed
.
- M. Kermani, A. S. Wallerand, I. D. Kantor and F. Maréchal, Generic superstructure synthesis of organic Rankine cycles for waste heat recovery in industrial processes, Appl. Energy, 2018, 306(Part A), 117954 Search PubMed
.
- J. Granacher, T. V. Nguyen, R. Castro-Amoedo and F. Maréchal, Overcoming decision paralysis—a digital twin for decision making in energy system design, Appl. Energy, 2022, 306, 117954 CrossRef
.
- I. Kantor, J. L. Robineau, H. Bütün and F. Maréchal, A Mixed-Integer Linear Programming Formulation for Optimizing Multi-Scale Material and Energy Integration, Frontiers in Energy Research, 2020, 8, 49 CrossRef
.
-
CPLEX, CPLEX, 2021 Search PubMed
.
- J. S. Kikstra, P. Waidelich, J. Rising, D. Yumashev, C. Hope and C. M. Brierley, The social cost of carbon dioxide under climate-economy feedbacks and temperature variability, Environ. Res. Lett., 2021, 16(9), 094037 CrossRef CAS
.
- European Commission, Renewable Energy Directive – Recast to 2030 (RED II), EU Science Hub, 2018, https://joint-research-centre.ec.europa.eu/welcome-jec-website/reference-regulatory-framework/renewable-energy-recast-2030-red-ii_en Search PubMed.
Footnote |
| † Electronic supplementary information (ESI) available. See DOI: https://doi.org/10.1039/d3se00473b |
| This journal is © The Royal Society of Chemistry 2023 |

