Miscibility, thermal degradation and rheological analysis of epoxy/MABS blends†
Jomon
Joy
af,
Krzysztof
Winkler
b,
Anna
Bassa
 b,
Poornima
Vijayan P
c,
Seno
Jose
d,
Saithalavi
Anas
 *ae and
Sabu
Thomas
*af
aSchool of Chemical Sciences, Mahatma Gandhi University, Kottayam, Kerala, India. E-mail: anas@mgu.ac.in; sabuthomas@mgu.ac.in
bInstitute of Chemistry, University of Bialystok, Bialystok, Poland
cDepartment of Chemistry, Sree Narayana College, Kollam, Kerala, India
dDepartment of Chemistry, Government College, Nattakom, Kerala, India
eAdvanced Molecular Materials Research Centre, Mahatma Gandhi University, Kottayam, Kerala, India
fSchool of Energy Materials, Mahatma Gandhi University, Kottayam, India
First published on 16th November 2022
Abstract
The effect of the addition of the methyl methacrylate acrylonitrile butadiene styrene (MABS) copolymer on the miscibility, thermal degradation and rheological properties of epoxy systems is described. Epoxy resin/MABS blends containing 5, 10, 15 and 20 phr MABS were prepared using the solution mixing technique. Homogenous blends obtained using this technique have undergone a polymerization reaction induced phase separation process by the introduction of the curing agent 4,4′-diaminodiphenyl sulfone (DDS). The isothermal rheology at four different temperatures, 150, 160, 170 and 180 °C, was used to examine the effect of MABS on the gelation and vitrification time. The evolution of storage modulus, loss modulus and tan delta was found to be closely related to the evolution of complex phase separation. The increase in the complex viscosity during curing was determined by in situ rheometry and theoretically analysed by fitting with the Williams–Landell–Ferry equation. An exponential increase in complex viscosity was observed, which was induced by cross-linking. The variation of Tg before and after curing was studied using DSC analysis and dynamic kinetic modeling of the curing process was carried out by utilizing dynamic DSC scans. Thermal stability studies of completely cured epoxy/MABS blends using thermogravimetric analysis revealed that all the blends and neat epoxy exhibited single step degradation. Thermal degradation kinetics was calculated using the Coats Redfern equation.
1 Introduction
Thermosetting materials undergo complex transformation from the liquid to solid state because of the crosslinking reaction taking place during the curing process. The analysis of rheological properties is very important to understand the processing conditions of thermosetting materials such as amine cured epoxy resins.1,2 Therefore, rheological analysis can be used as a tool for the optimization of the curing schedule.3 Thermoplastic modifiers are widely used in the toughening of thermosetting resin for realistic material applications.4,5 Epoxy/thermoplastic blend systems that are initially homogenous undergo reaction-induced phase separation during curing. Processing of epoxy polymers requires consideration of the viscoelastic properties of epoxy and thermoplastic mixtures.6 Isothermal rheology and frequency sweep rheology are used to investigate the viscoelasticity at different stages of curing in thermoplastic modified epoxy blends.7 Thermoplastic modified epoxy systems change from a liquid to gel form at a certain reaction point called the gel point. The cross-over area in dynamic rheology measurement is a more convenient term for the gel point, which is the point at which the storage modulus (G′) equals the loss modulus (G′′). The process of transitioning from an elastic gel to a glassy state after gelation is known as vitrification.For practical applications of thermosetting systems, the processing window followed is evident from the rheological data. Additives like thermoplastics or nanoparticles have an impact on the gelation and vitrification points depending on how they interact with a pre-cured epoxy system.8 The addition of a secondary phase alters the process of gelation. Therefore it is crucial to have a thorough understanding of the rheological factors in order to optimize the processing settings. The phase separation process also affects the ultimate morphology of the system. In their influential study, Bonnet et al. examined the evolution of viscosity in an epoxy/polyetherimide (PEI) system and discovered that changing the concentration of PEI can alter the form of fluctuation linked to phase separation phenomena.9 Additionally, they stated that the rheological behavior of the β phase was a crucial parameter influencing the ultimate morphology of the blend system.
Kim and Char proposed a suspension model to simulate the evolution of viscosity as they investigated the impact of phase separation on the rheological behavior during the isothermal curing of the polyether sulfone modified epoxy blend system.10 Dynamic rheology studies of PI nanofiber mat/epoxy composites were conducted by K Joseph and team. They found that PI fibers have an increasing effect on the viscoelastic flow properties of the composite.11 Several earlier research studies have been carried out from our laboratory to study the properties of epoxy based polymer systems. Rheology–morphological correlation of epoxy/CTBN rubber blends was studied in our laboratory and it was found that the gelation time can be decreased using the phase separated CTBN rubber.12 Viscoelastic phase separation of epoxy/ABS blends was studied by Jyothish kumar et al. and they found a reduction in the tan delta curve much before the gelation point for epoxy/ABS blends with a higher concentration of ABS, resulting from the dominance of the ABS rich phase during viscoelastic phase separation.13 George et al. investigated the rheology of epoxy systems containing epoxidized poly(styrene-butadiene-styrene) (SBS) with a 47 mol percentage degree of epoxidation (eSBS47).14 10 and 20 wt% eSBS47-(DGEBA/DDM) systems showed additional fluctuation in the η* value before the gelation point compared to the η* value of the neat epoxy system. This increase in viscosity may be connected to the phase separation of eSBS47 brought on by the curing reaction as the curing reaction time was increased. Thus, variation in η* and G′ and G′′ before gelation can be used as criteria for the identification of phase separation. Recently Surendran et al. studied the rheological behavior of epoxy/SAN blends and epoxy/SAN/cloisite 20 A nanocomposites using isothermal rheology.15 They discovered that the miscibility of the thermoplastic in the epoxy matrix led to a dilution effect, which increased the time needed for gelation and vitrification in the epoxy/5 phr SAN and epoxy/15 phr SAN mix systems. The rheological properties of epoxy polymers modified with polyetherimide were studied by Korokhin and co-workers.16 They noticed that when temperature increases, gelation times of all systems shorten and become equivalent in value.
The reaction kinetics and curing temperature are significantly affected by phase separation in the methyl methacrylate acrylonitrile butadiene styrene (MABS) modified epoxy blend system. MABS is an engineering thermoplastic. It is an amorphous material, which possesses good chemical resistance, and excellent impact resistance.17 It is a copolymer of methyl methacrylate, acrylonitrile, butadiene and styrene.18 MABS was used as a thermoplastic modifier for epoxy systems. In our previous report,19 we studied the evolution of phase separation using optical microscopy analyses, which revealed that at low concentrations of MABS, the phase separation occurred by a nucleation and growth process. However, at higher concentrations of MABS, the phase separation occurred by a spinodal process. A phase-in-phase morphology was noticed as a result of a viscoelastic phase separation process due to the strong dynamic asymmetry arising from the molecular weight and Tg differences between the component polymers (high molecular weight MABS and liquid epoxy).
Herein, we report the rheological behavior of diglycidyl ether of a bisphenol A/methyl methacrylate acrylonitrile butadiene styrene (MABS) blend system and analyze the effect of MABS on the curing process of epoxy by rheometry. In-depth descriptions are provided of how the addition of MABS affects the thermal characteristics of epoxy blends. Such in-depth research has not yet been conducted. To the best of our knowledge there has been no report on the rheological and thermal analysis of MABS reinforced epoxy based systems.
2 Materials and methods
2.1 Materials
Diglycidylether of bisphenol A (DGEBA) and 4,4′-diaminodiphenyl sulfone (DDS) were Lapox L-12 and Lapox K-10, respectively, both supplied by Atul chemicals Pvt. Ltd, India. The hardner (DDS) was a white powder with a melting point of 170 °C. The epoxy content in Lapox L-12 varies between 5.25 and 5.40 equiv. kg−1. Lapox L-12 has a viscosity of about 1.15–1.2 g cm−3. Methyl methacrylate-acrylonitrile-butadiene-styrene (MABS, Terlux®2802 TR) was obtained from BASF Plastics.2.2 Preparation of epoxy/MABS blends
The solution mixing approach was used to prepare blends of epoxy resin/MABS containing 5, 10, 15, and 20 phr MABS. MABS was first dissolved in 1,2-dichloroethane using a magnetic stirrer and the resulting solution was mixed with 100 g of epoxy resin while being constantly stirred, allowing the solvent to evaporate. The epoxy/MABS mixture was thoroughly mixed before DDS (35 g) was added. The solution was evacuated and transferred to an open mold. The blends were post-cured for additional two hours at 200 °C after being cured in an air oven for three hours at 180 °C. After that, the mixtures were allowed to gradually cool to room temperature. Fig. S1 (ESI†) represents the photograph of the MABS 10 blend.3 Characterization techniques
3.1 Rheological analysis
An Anton Paar Rheo-compass rheometer was used to perform the rheological characterization of the samples. Steel parallel plates were used throughout. The oscillatory shear flow measurements were conducted under isothermal and dynamic conditions to follow the curing process. Isothermal studies were conducted at a frequency of 1 Hz and a fixed strain of 1%. Four different temperatures (150, 160, 170, and 180 °C) were used for the measurements.3.2 Differential scanning calorimetry
Differential scanning calorimetric (DSC) measurements were carried out using a PerkinElmer D0SC 6000 instrument in a nitrogen atmosphere at a purging rate of 20 mL min−1. In order to perform dynamic DSC scans of epoxy and epoxy/MABS blends, samples comprising 7–10 mg of the mixture were put into an aluminium hermetic DSC pan. Different scanning rates of 2.5, 5, 7.5, and 10 °C min−1 were used to dynamically cure each sample. The dynamic DSC scanning temperature range was from −50 to 250 °C. Glass transition temperatures (Tg) of the completely cured samples and uncured samples were determined using dynamic scans at a heating rate of 5 °C min−1 from −30 to 250 °C in a nitrogen atmosphere.3.3 Thermogravimetric analysis
The thermal stability of the blends was determined using thermogravimetric (TG) studies. The measurements were carried on a Mettler Instruments model NETZSCH TG 209 thermal analyzer. 6–10 mg of the samples was analyzed from ambient temperature to 700 °C in a nitrogen environment with a heating rate of 10 °C min−1.4 Results and discussion
4.1 Rheological analysis of epoxy/MABS blends
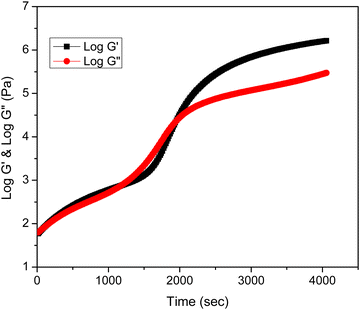
The rheological behavior of epoxy/methyl methacrylate acrylonitrile butadiene styrene (MABS) blends was investigated at various curing temperatures such as 150, 160, 170 and 180 °C. The curing temperature does not alter the rheological profile of the system. Fig. 1a shows the rheological analysis of neat epoxy at 160 °C and indicates the variation in rheological parameters such as loss modulus and storage modulus as a function of time.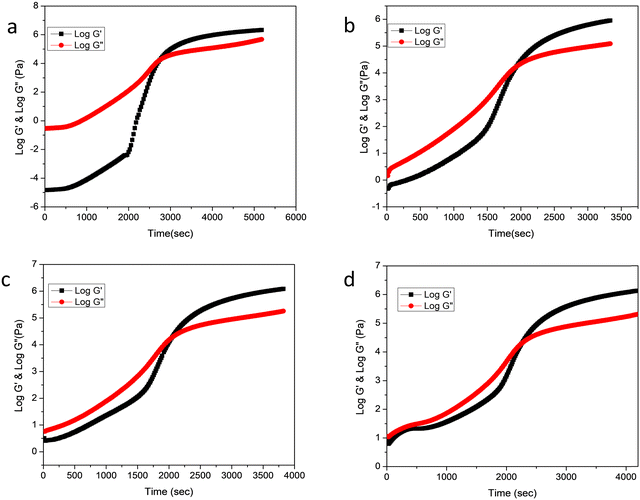 | ||
| Fig. 1 Variation of storage modulus and loss modulus as a function of time at 160 °C (a) neat epoxy, (b) MABS 5, (c) MABS 10 and (d) MABS 15. | ||
Fig. 1a also reveals that during the initial phases of curing, the storage modulus (G′) is lower than the loss modulus (G′′), suggesting the liquid nature of the material. As the time progresses, the storage and loss modulus increase as a result of the linear growth of the epoxy chains. Due to the formation of cross-links between the expanding polymer chains in all directions, the storage modulus becomes equal to the loss modulus at a certain point, which is known as the gelation point. The system stops flowing which means that the system simultaneously becomes elastic and viscous, storing and releasing an equal quantity of energy at this point.20 After gelation, the substance shows more features of a solid than a liquid. Vitrification is the process of turning a material from an elastic gel to a glassy solid. In the rheological profile, vitrification is characterized by higher storage modulus values and lower tan δ values after the cross-over zone.
The MABS 5 blend and MABS 10 blend show similar rheological profiles as shown in Fig. 1(b and c). The storage modulus and loss modulus of both blends increase as the curing reaction progresses due to the growth of the polymer chains and cross-linking reaction. However, the rheological profiles for MABS 15 (Fig. 1d) and MABS 20 (Fig. 2) follow a different trend when compared to those of the MABS 5 blend and MABS 10 blend due to the viscoelastic phase separation behavior of epoxy/MABS blends. In recent years, substantial research on this type of phase separation in epoxy/thermoplastic blends has been conducted.19,21,22 Fig. S6 (ESI†) shows the time-dependent variation of tan delta of neat epoxy. The tan delta value during the initial stages of curing is high, indicating the liquid nature of the material. Fig. 3 represents the variation of tan delta as a function of time of epoxy/MABS blends. Fig. 3a shows the variation of tan delta as function of time of the MABS 5 blend and the value initially increases with time. As the curing process advances, the tan value rapidly drops to nearly zero, indicating the chemical gelation of the material.
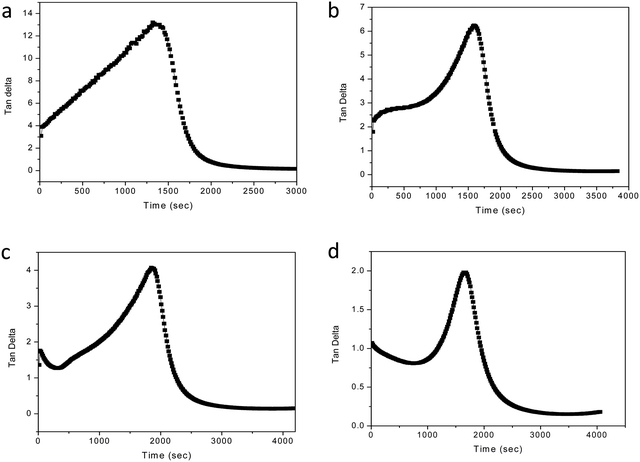 | ||
| Fig. 3 Variation of tan delta as a function of time. (a) MABS 5, (b) MABS 10, (c) MABS 15 and (d) MABS 20 blends. | ||
The MABS 10 blend also shows a similar behavior in the tan delta curve as seen in Fig. 3b. The rheological profiles of the MABS 15 (Fig. 3c) blend and MABS 20 (Fig. 3d) blend show a tan delta peak's descent before the gelation point; this is more noticeable in the MABS 20 blend because the MABS rich phase predominates during the viscoelastic phase separation. Following that, the epoxy phase grows suddenly, which causes the tan delta curve to rise once more. Finally, due to the chemical gelation of the epoxy phase, tan delta drops almost to zero. Because of the dominating effect of the more elastic MABS-rich phase in the blends, the storage modulus and loss modulus of the MABS 20 blend (Fig. 2) begin to increase and become very close to each other well before the cross-over point. This suggests that the elasticity of MABS is more prominent at higher MABS concentrations due to phase inversion following the reaction-induced phase separation.
In our previous study,19 we had investigated the evolution of phase separation for all the blends at different temperatures. We found that the phase separation phenomenon in epoxy/MABS systems mainly occurs due to the (1) nucleation and growth mechanism, and (2) spinodal decomposition mechanism depending on the concentration of MABS. When the MABS content is less than or equal to 10 phr, the phase separation process takes place by the nucleation and growth process. However, when the MABS concentration is above 10 phr, the phase separation process takes place via spinodal decomposition mechanism. Fig. S2 (ESI†) indicates the schematic representation of the phase separated blends.
The gel point was determined from the plots of storage modulus and loss modulus versus time. There are different methods available to find out the gel point in the case of epoxy based systems. The most commonly used and easiest method is taking the point of intersection of the G′ and G′′ curves as the gel point. In the case of neat epoxy at 150 °C, the gel point is reached around 4000 s and this value is decreased to 1000 s when the temperature reaches 180 °C. The gelation time of epoxy/MABS blends measured at different temperatures is given in Table 1 for neat epoxy and for epoxy/MABS blends with different concentrations of MABS.
| Temperature (°C) | Time (seconds) | ||||
|---|---|---|---|---|---|
| Neat epoxy | MABS 5 | MABS 10 | MABS 15 | MABS 20 | |
| 150 | 4127 | 3372 | 3720 | 3713 | 4212 |
| 160 | 2747 | 1935 | 2051 | 2258 | 1948 |
| 170 | 1560 | 1728 | 1412 | 1325 | 1050 |
| 180 | 1099 | 1085 | 1037 | 994 | 920 |
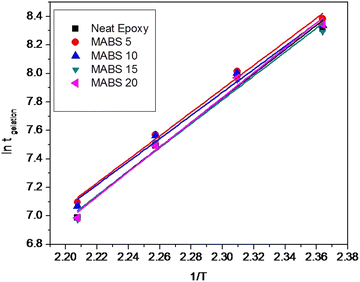
The faster gelation at higher temperature is a usual trend because of the thermal acceleration of curing reaction. From Table 2, it can be seen that vitrification time decreases with increasing curing temperature at a fixed MABS concentration. This means that curing reactions are quicker at higher curing temperatures. The activation energy values of the epoxy/MABS blend systems were calculated using the Arrhenius equation23 using tgel and are reported in Table 3.
Ln![[thin space (1/6-em)]](https://www.rsc.org/images/entities/char_2009.gif) tgel = Ln(A) + Egel/RT tgel = Ln(A) + Egel/RT | (1) |
| Temperature (°C) | Time (seconds) | ||||
|---|---|---|---|---|---|
| Neat epoxy | MABS 5 | MABS 10 | MABS 15 | MABS 20 | |
| 150 | 4749 | 4014 | 4380 | 4313 | 4815 |
| 160 | 3345 | 2585 | 2639 | 2851 | 2536 |
| 170 | 1952 | 2118 | 1821 | 1754 | 1470 |
| 180 | 1292 | 1305 | 1371 | 1204 | 1265 |
| Sample | Activation energy for gelation |
|---|---|
| Neat epoxy | 70.9 |
| MABS 5 | 68.6 |
| MABS 10 | 67.5 |
| MABS 15 | 69.7 |
| MABS 20 | 72.4 |
Fig. 4 shows the fitted curve obtained from the plot of ln![[thin space (1/6-em)]](https://www.rsc.org/images/entities/char_2009.gif) tgelversus 1/T. The activation energies are determined from the plot. The activation energy values for the epoxy/MABS blends are comparable and are within the limit of errors. The activation energy values obtained are comparable with those of other epoxy blend systems studied.24
tgelversus 1/T. The activation energies are determined from the plot. The activation energy values for the epoxy/MABS blends are comparable and are within the limit of errors. The activation energy values obtained are comparable with those of other epoxy blend systems studied.24
A TTT diagram is drawn in order to describe these transformations as a function of temperature and time. Gillham and Babayevsky discovered the concept of a time-temperature-transformation (TTT) cure diagram for polymer systems, which illustrates how long it takes to accomplish gelation and vitrification during an isothermal curing process.25 Fig. S4 and S5 (ESI†) show the TTT diagram for the neat epoxy and MABS 5 blend. The gelation and vitrification times used to display the TTT diagram are the mean of the values obtained using the gelation criteria utilised in this investigation. Understanding the TTT diagram will help to understand how temperature affects the kinetics of the curing behavior of an epoxy system.
4.2 Rheological modeling
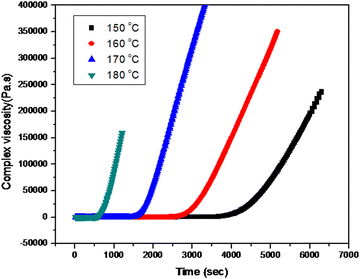
During the curing reaction of thermosetting resins, a low viscosity liquid is converted to a highly glassy solid. At the beginning, the reaction mixture is a liquid and the viscosity is found to be very low. There is a rise in viscosity over time; after gelation, the viscosity increases rapidly because of the network formation as evident from the Fig. 5. Epoxy resin is cured by thermal catalysis because higher temperatures result in a greater viscosity increase.The time of relaxation was calculated by fitting the isothermal curves at four different temperatures using the Maxwell exponential growth equation.26 The equation is given as follows
 | (2) |
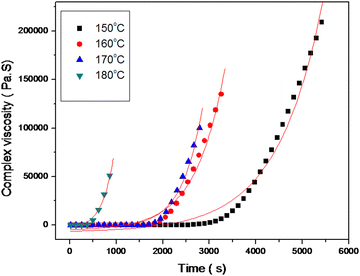 | ||
| Fig. 6 Maxwell's exponential fits of complex viscosity vs. time for the MABS 5 blend at different temperatures. | ||
The remaining epoxy/MABS blends also obey Maxwell's exponential equation for the increase in complex viscosity. The relaxation times obtained from the simulation are tabulated in Table 4.
| Temperature (°C) | Time (seconds) | ||||
|---|---|---|---|---|---|
| Neat epoxy | MABS 5 | MABS 10 | MABS 15 | MABS 20 | |
| 150 | 964 | 982 | 996 | 1020 | 1052 |
| 160 | 725 | 629 | 644 | 659 | 690 |
| 170 | 414 | 433 | 452 | 492 | 516 |
| 180 | 273 | 248 | 322 | 293 | 314 |
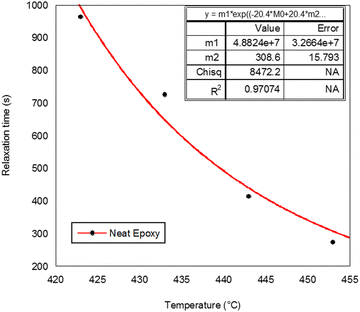
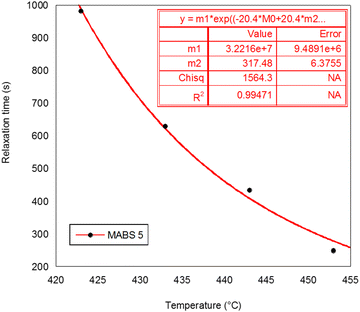
The relaxation time was plotted against the temperature to apply simulation using the William–Landel–Ferry (WLF) equation.27 The equation is given as follows
log![[thin space (1/6-em)]](https://www.rsc.org/images/entities/char_2009.gif) τn/τs = −C1 (T − Ts)/C2 + (T − Ts) τn/τs = −C1 (T − Ts)/C2 + (T − Ts) | (3) |
τn = τs exp[−ln![[thin space (1/6-em)]](https://www.rsc.org/images/entities/char_2009.gif) 10 × 8.86 (T − Ts)/101.6 + (T − Ts)] 10 × 8.86 (T − Ts)/101.6 + (T − Ts)] | (4) |
The values of Ts and τs obtained from the stimulation are displayed in Table 5. Ts is connected to the flow temperature of the polymer chain and may also be related to the temperature at which complicated viscosity begins to develop and τs is the relaxation time at Ts. The results are considered acceptable because the correlation coefficient R2 ranged between 0.9702 and 0.999. It is possible to determine the Ts and τs relaxation times at various temperatures using the aforementioned WLF analysis, but in reality it is challenging to measure τs experimentally at such low temperatures because of the low mobility of epoxy/amine monomers, which may remain undetected within a short observation period. By using the TTS principle, we can obtain useful knowledge regarding the complex viscosity over a large range of temperatures.
| System | T s (K) | τ s (s) | R 2 |
|---|---|---|---|
| Epoxy | 308.6 | 4.88 × 10⁷ | 0.9707 |
| MABS 5 | 317.4 | 3.22 × 10⁷ | 0.99471 |
| MABS 10 | 305.8 | 5.52 × 10⁷ | 0.99925 |
4.3 DSC analysis of the epoxy/MABS system
The variation in the glass transition temperature is generally observed for thermally accelerated curing reactions. It mainly depends on the type of the added modifier. In the case of elastomers, a decrease in Tg is observed due to an increase in the flexibility of the matrix by the addition of the elastomers. While in the case of thermoplastic addition, there is an increase in the rigidity of the matrix which results in an increase in Tg. Cure analysis can be monitored using differential scanning calorimetry. Epoxies follow an autocatalytic mechanism of curing when cured with amines and anhydrides. Aromatic amines are the most suitable candidates for the fast curing of the epoxy matrix. Here we are examining the curing reaction of epoxy matrix and the effect of the addition of methyl methacrylate acrylonitrile butadiene styrene on the curing process of epoxy matrix.From the figure (Fig. 9), it is clear that the glass transition temperature is dependent on the concentration of the thermoplastic. The glass transition of the MABS phase is not seen even at higher concentrations of MABS, which is a clear indication of the improved miscibility between epoxy and MABS. Glass transition temperature of pure DGEBA is around −17 °C. With the addition of a thermoplastic, we can observe that a shift in the glass transition supports the possibility of interactions. In the case of cured blends, two glass transition temperatures corresponding to the MABS phase and epoxy phase are observed for epoxy/MABS blends having a higher concentration of MABS. This result supports the phase separation process in epoxy/MABS blends with the addition of curing agents.
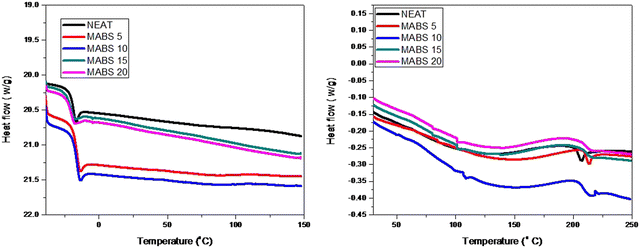 | ||
| Fig. 9 DSC analysis curves of the cured neat epoxy and epoxy/MABS (right) blends and uncured epoxy and blends (left). | ||
4.4 Dynamic DSC analysis
The dynamic heat flow curves of the MABS 20 blend at different heating rates of 10, 7.5, 5, and 2.5 °C min−1 are shown in Fig. 10. By using these dynamic DSC images, one may perform dynamic kinetic modelling of the curing process. The position of the temperature peak at the maximum heat flow is influenced by the heating rate and shifts to a region with a higher temperature as the heating rate increases. Peak-shifting occurs because of the dependence on the activation energy associated with each reaction.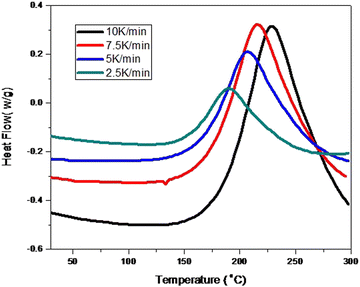 | ||
| Fig. 10 Dynamic heat flow curves of the MABS 20 blend at heating rates of 10, 7.5, 5 and 2.5 °C min−1. | ||
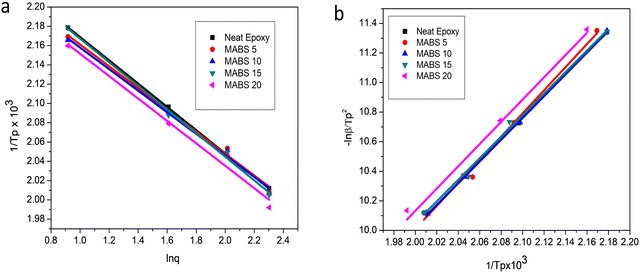 | ||
Fig. 11 Plots of (a) 1/Tpversus ln![[thin space (1/6-em)]](https://www.rsc.org/images/entities/char_2009.gif) q (Ozawa) and (b) ln q (Ozawa) and (b) ln![[thin space (1/6-em)]](https://www.rsc.org/images/entities/char_2009.gif) q/Tp2 versus 1/Tp (Kissinger) for neat epoxy, MABS 5, MABS 10, MABS 15 and MABS 20 blends. q/Tp2 versus 1/Tp (Kissinger) for neat epoxy, MABS 5, MABS 10, MABS 15 and MABS 20 blends. | ||
For non-isothermal curing, Kissinger28 and Ozawa29 methods are typically employed to identify the activation energy during the curing reaction. According to the Kissinger technique, the activation energy E, heating rate q and temperature Tp at which the exothermic peak reaches a maximum show the following relationship:
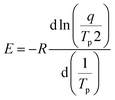 | (5) |
The relationship between ln (q/Tp2) and 1/Tp1 can be established from the dynamic DSC curves measured at various heating rates and the activation energy can then be determined from the slope of the linear fit of experimental data (Fig. 11).
In order to determine the relationship between the activation energy E, heating rate q and peak exothermic temperature Tp, Ozawa created an alternate method based on the supposition that the intensity of the reaction at the exothermic peak is constant and independent of the heating rate. The equation is
 | (6) |
After determining the peak temperatures for different systems at various heating rates, the Ozawa method was used to plot the reciprocal temperature (1/Tp) values against the logarithm of the heating rate (q) and the Kissinger method was utilized to plot ln (q/Tp2) against (1/Tp). All cases exhibit an excellent linear fit, demonstrating that both models adequately explained the experimental data. The slope of the fitted straight line was used to compute the activation energy. The values of the obtained activation energy are shown in Table 6.
| Activation energy (kJ mol−1) | ||
|---|---|---|
| Sample | Kissinger | Ozawa |
| Neat epoxy | 65 | 69 |
| MABS 5 | 62 | 67 |
| MABS 10 | 61 | 66 |
| MABS 15 | 60 | 65 |
| MABS 20 | 60 | 65 |
Even though the activation energy acquired from the Ozawa method is marginally higher than that from the Kissinger method, as reported by others, the values obtained from both approaches exhibit a similar pattern. The most crucial factor to consider is that these approaches are only applicable during the initial stage of the curing reaction; in reality, they are fully reliant on the greatest rate of cure, which in this case happens roughly at the beginning of the curing reactions.
4.5 Thermogravimetric analysis
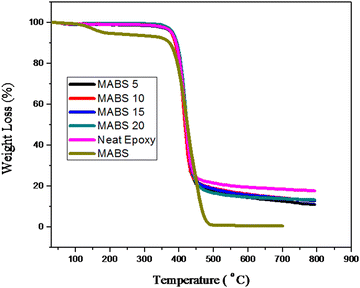
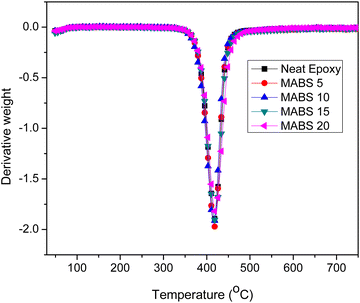
The thermal stability and thermal degradation properties of the DDS-cured epoxy and modified systems were investigated. Under a nitrogen environment, the analysis was carried out in the temperature range of 30 °C to 800 °C at a heating rate of 10 °C. TGA curves for epoxy and epoxy/MABS blends are represented in Fig. 12. The differential thermograms (DTGs) are shown in Fig. 13. The main degradation starts at about 320 °C in both the epoxy and modified systems and it occurs in a single stage. The temperature corresponding to the highest rate of thermal degradation (Tmax), the initial decomposition temperature (IDT) and the char yield at 700 °C (percent) were determined (shown in Table 7). Other parameters such as weight loss corresponding to different temperatures such as 300 °C, 350 °C, 400 °C, 450 °C, 500 °C, 550 °C, 600 °C and 650 °C (T300, T350, T400, T450, T500, T550, T600 and T650) are also shown in Table 8. The initial decomposition temperature (IDT) was found to be slightly increasing with the addition of MABS. The temperature corresponding to the maximum degradation of the neat epoxy and epoxy/MABS blends obtained from the peak of the DTG plot is also furnished in Table 7.| Sl. no. | Composition | IDT (°C) | T max (°C) |
|---|---|---|---|
| 1 | Neat epoxy | 328 | 418.20 |
| 2 | MABS 5 | 330 | 418.21 |
| 3 | MABS 10 | 331 | 418.25 |
| 4 | MABS 15 | 332 | 418.50 |
| 5 | MABS 20 | 332 | 418.55 |
| Sl. no. | Composition | T 300 | T 350 | T 400 | T 450 | T 500 | T 550 | T 600 |
|---|---|---|---|---|---|---|---|---|
| 1 | Epoxy | 98.66 | 97.90 | 87.89 | 24.65 | 21.34 | 20.12 | 19.32 |
| 2 | MABS 5 | 98.39 | 97.72 | 86.72 | 21.09 | 17.46 | 15.84 | 14.42 |
| 3 | MABS 10 | 98.99 | 98.38 | 85.41 | 22.46 | 18.88 | 17.32 | 15.96 |
| 4 | MABS 15 | 98.93 | 98.37 | 88.84 | 22.92 | 18.53 | 16.82 | 15.49 |
| 5 | MABS 20 | 98.96 | 98.37 | 89.04 | 22.12 | 18.46 | 16.31 | 15.04 |
Thermal degradation characteristics of MABS are slightly different from those of neat epoxy and epoxy/MABS blends. MABS shows a two step degradation pattern; first degradation starts around 100 °C. But the results from TGA indicate that the incorporation of MABS does not affect the thermal stability of the epoxy system negatively. The thermal degradation characteristics of the neat epoxy and epoxy/MABS blends reveal that all the blends retain their thermal stability after the incorporation of MABS and hence all the blends are found to be thermally stable.
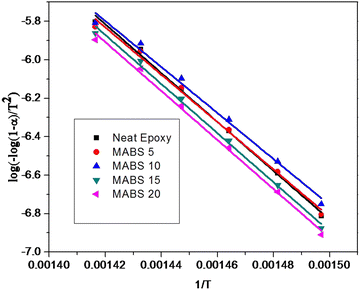 | ||
| Fig. 14 Kinetics of thermal decomposition of epoxy/MABS blends determined using the Coats–Redfern equation. | ||
4.6 Thermal degradation kinetics
To assess the thermal stability more thoroughly, non-isothermal thermal degradation kinetics were determined. The mechanism of random molecule scission predominates in the breakdown of thermosets.30 The thermal deterioration of epoxy/MABS blends was estimated using an integral technique suggested by Coats-Redfern. The Coats Redfern equation is | (7) |
 where C is the weight at the temperature chosen, Ci is the weight at the initial temperature and Cf is the weight at the final temperature. The activation energy was determined (Table 9) from the plot of
  versus 1/T (Fig. 14).
| Sl. no. | Sample | Activation energy (kJ mol−1) |
|---|---|---|
| 1 | Neat epoxy | 240 |
| 2 | MABS 5 | 238 |
| 3 | MABS 10 | 232 |
| 4 | MABS 15 | 242 |
| 5 | MABS 20 | 244 |
5 Conclusions
The in situ rheological behavior of neat epoxy and methyl methacrylate acrylonitrile butadiene styrene (MABS)/epoxy blends with varying concentrations of MABS (5, 10, 15 and 20 phr) using 4,4-diamino diphenyl sulfone (DDS) as a curing agent was examined in situ using rheometry analysis. The isothermal rheology at four different temperatures 150, 160, 170 and 180 °C was used to examine the effect of MABS on the gelation and vitrification time. The faster gelation of epoxy and epoxy/MABS blends at a higher temperature is due to the thermal acceleration of the curing reaction. The relationship between the rheological properties and the phase separation process was carefully explored. Based on rheological findings, a TTT diagram was proposed for blend systems; the gelation and vitrification times become shorter as the temperature increases. The evolution of storage modulus, loss modulus and tan delta was found to be closely related to the evolution of complex phase separation. It was found that the complex viscosity profiles follow an exponential growth trend with curing at various temperatures. The WLF equation has been used to characterize the characteristic relaxation time of viscosity growth at various temperatures. Furthermore, DSC analysis was used to study the variation of Tg before and after curing. Dynamic kinetic modeling of the curing process was carried out by utilizing dynamic DSC scans. The dynamic DSC data were used to calculate the activation energy using Ozawa and Kissinger methods.Conflicts of interest
There are no conflicts of interest to declare.Acknowledgements
JJ thanks UGC, New Delhi, for research fellowship ((17-06/2012(1) EU-V)). We thank DST-PURSE (phase II: SR/417 and 418/2017), Government of India, for the financial support.References
- J. F. Pires Neto, L. F. C. Souto, A. dos, A. Silva, G. M. de, O. Barra, M. F. Naccache, B. G. Soares, A. da and S. Sirqueira, J. Vinyl Addit. Technol., 2020, 26, 348–353 CrossRef CAS.
- K.-W. Lem and C. D. Han, J. Appl. Polym. Sci., 1983, 28, 3185–3206 CrossRef CAS.
- B. D. S. Deeraj, R. Harikrishnan, J. S. Jayan, A. Saritha and K. Joseph, Nano-Struct. Nano-Objects, 2020, 21, 100421 CrossRef CAS.
- L. Karthikeyan, D. Mathew and T. M. Robert, Polym. Adv. Technol., 2019, 30, 1061–1071 CrossRef CAS.
- L. Barral, J. Cano, J. López, I. López-Bueno, P. Nogueira, M. J. Abad and C. Ramírez, J. Polym. Sci., Part B: Polym. Phys., 2000, 38, 351–361 CrossRef CAS.
- A. Surendran, J. Joy, J. Parameswaranpillai, S. Anas and S. Thomas, Soft Matter, 2020, 16, 3363–3377 RSC.
- L. M. Johnson and N. D. Huffman, Handbook of Epoxy Blends, Springer International Publishing, 2016, pp. 1–37 Search PubMed.
- A. Surendran, J. Pionteck, M. Malanin, R. Vogel, N. Kalarikkal and S. Thomas, New J. Chem., 2021, 45, 1395–1403 RSC.
- A. Bonnet, J. P. Pascault, H. Sautereau and Y. Camberlin, Macromolecules, 1999, 32, 8524–8530 CrossRef CAS.
- H. Kim and K. Char, Ind. Eng. Chem. Res., 2000, 39, 955–959 CrossRef CAS.
- B. D. S. Deeraj, R. Harikrishnan, J. S. Jayan, A. Saritha and K. Joseph, Nano-Struct. Nano-Objects, 2020, 21, 100421 CrossRef CAS.
- P. P. Vijayan, D. Puglia, J. M. Kenny and S. Thomas, Soft Matter, 2013, 9, 2899–2911 RSC.
- P. Jyotishkumar, J. Pionteck, C. Özdilek, P. Moldenaers, U. Cvelbar, M. Mozetic and S. Thomas, Soft Matter, 2011, 7, 7248–7256 RSC.
- S. M. George, D. Puglia, J. M. Kenny, J. Parameswaranpillai, P. Vijayan P, J. Pionteck and S. Thomas, Phys. Chem. Chem. Phys., 2015, 17, 12760–12770 RSC.
- A. Surendran, J. Pionteck, R. Vogel, N. Kalarikkal, V. G. Geethamma and S. Thomas, Polym. Test., 2018, 70, 18–29 CrossRef CAS.
- R. A. Korokhin, A. V. Shapagin, V. I. Solodilov, U. G. Zvereva, D. V. Solomatin and Y. A. Gorbatkina, Polym. Bull., 2021, 78, 1573–1584 CrossRef CAS.
- For the data sheet of Terluxs 2802 TR (MABS), see https://www.uniboxinfo.com/datasheets/terlux.pdf.
- L. W. McKeen, Fatigue and tribological properties of plastics and elastomers, William Andrew, 2016 Search PubMed.
- J. Joy, K. Winkler, K. Joseph, S. Anas and S. Thomas, New J. Chem., 2019, 43, 9216–9225 RSC.
- R. Thomas, D. Yumei, H. Yuelong, Y. Le, P. Moldenaers, Y. Weimin, T. Czigany and S. Thomas, Polymer, 2008, 49, 278–294 CrossRef.
- P. Jyotishkumar, J. Koetz, B. Tiersch, V. Strehmel, C. Özdilek, P. Moldenaers, R. Hässler and S. Thomas, J. Phys. Chem. B, 2009, 113, 5418–5430 CrossRef CAS PubMed.
- H. Tanaka, Adv. Mater., 2009, 21, 1872–1880 CrossRef CAS.
- P. A. Oyanguren and R. J. J. Williams, J. Appl. Polym. Sci., 1993, 47, 1361–1371 CrossRef CAS.
- L. Calabrese and A. Valenza, Eur. Polym. J., 2003, 39, 1355–1363 CrossRef CAS.
- J. K. Gillham and P. G. Babayevsky, J. Appl. Polym. Sci., 1973, 17, 2067–2088 CrossRef.
- Y. Yu, M. Wang, D. Foix and S. Li, Ind. Eng. Chem. Res., 2008, 47, 9361–9369 CrossRef CAS.
- M. L. Williams, R. F. Landel and J. D. Ferry, J. Am. Chem. Soc., 1955, 77, 3701–3707 CrossRef CAS.
- H. E. Kissinger, Anal. Chem., 1957, 29, 1702–1706 CrossRef CAS.
- T. Ozawa, J. Therm. Anal., 1973, 5, 563–576 CrossRef CAS.
- J. Joy, E. George, S. Thomas and S. Anas, New J. Chem., 2020, 44, 4494–4503 RSC.
Footnote |
| † Electronic supplementary information (ESI) available. See DOI: https://doi.org/10.1039/d2sm01074g |
| This journal is © The Royal Society of Chemistry 2023 |

