 Open Access Article
Creative Commons Attribution 3.0 Unported Licence
The coagulant dipping process of nitrile latex: investigations of former motion effects and coagulant loss into the dipping compound
Robert
Groves
,
Patrick
Welche
and
Alexander F.
Routh
 *
*
Institute for Energy and Environmental Flows, University of Cambridge, Madingley Rise, Madingley Road, Cambridge CB3 0EZ, UK. E-mail: afr10@cam.ac.uk
First published on 7th December 2022
Abstract
Coagulant dipping, the process used in thin glove manufacture, involves electrolyte ions diffusing from the surface of a hand-shaped former into latex compound, causing a deposit (wet gel) to accumulate on the former. In this work, two aspects of the process were examined, both experimentally and theoretically. For the experimental work, a commercial nitrile latex was used. The motion of formers through a latex dipping tank is intuitively expected to affect the electrolyte diffusion and hence the wet gel growth. This was investigated at laboratory scale with small glass formers moving in a metre-long dip tank. Former velocities ranged from zero to almost 0.2 m s−1. No effect of former lateral movement on wet gel thickness was observed. One obvious explanation is that most of the coagulant diffusion occurs within the wet gel deposit, which provides protection to the diffusive flux. However, the critical zone is just ahead of the coagulating front, where coagulant is present in the liquid compound at concentrations below the level needed for coagulation. A fluid mechanical model was constructed that assumed a uniform fluid flow along the side face of a rectangular former. The model confirmed that for calcium nitrate, the most commonly used coagulant, the effect of movement is very small. In the second investigation, coagulant leakage into the host latex compound during the dwell time was investigated by taking samples during repeat static dips. This experiment was modelled using diffusion theory, focusing on the critical zone just outside the wet gel at the point of former withdrawal. The model and experiment agreed well, both showing a small but definite coagulant leakage that tended towards a plateau concentration. Coagulant leakage from a moving former was also considered, from a theoretical perspective. In this case, the mechanism is advective movement of coagulant from the critical zone into the host compound. In the worst case, where all of this coagulant is swept away, the model suggested that the plateau coagulant concentration could reach an amount that would cause coagulation. Reduced flow in the critical zone (boundary layer) and former shape are factors that would reduce leakage.
Introduction
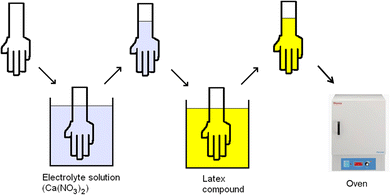
The predominant polymers used to produce thin gloves are natural rubber (poly(cis-1,4-isoprene)) and nitrile (a copolymer of butadiene, acrylonitrile and a carboxylic acid monomer). In preparation for coagulant dipping, the aqueous dispersions of these polymers (latexes) are compounded with additives that produce polymer crosslinking and thus the elastic properties required by the gloves.The process, which has been used for nearly 100 years, is sketched in Fig. 1. A hand-shaped ceramic former is dipped into an aqueous electrolyte solution, often referred to as the coagulant and which is typically calcium nitrate. The coated former is dried to leave a surface layer of coagulant. The former is then dipped into an aqueous dispersion of polymer particles, which, for thin glove production, commonly has a volume fraction of 15 to 20%. During the chosen dwell time in the polymer dispersion, a deposit accumulates on the former surface. After withdrawal, the former enters an oven where the deposit is dried. This is followed by cooling and removal of the dried elastomeric film, yielding the product glove. Typical industrial production lines operate with formers on a continuous loop, dipping up to 50![[thin space (1/6-em)]](https://www.rsc.org/images/entities/char_2009.gif) 000 gloves per hour.
000 gloves per hour.
The polymer deposit on the former, as it is withdrawn from the latex, is called the wet gel. The generally accepted mechanism by which the wet gel forms is the progressive coagulation of the anionic polymer particles. The coagulant diffuses into the latex dispersion and in the region where its concentration is above a critical value, the latex particles aggregate, forming a solid material on the former.1–4 This mechanism has remained almost unchallenged since the invention of the coagulant dipping process. To the best of our knowledge, the only alternative proposed mechanism is diffusiophoresis,5 in which electrolyte diffusion leads to a concentration gradient-induced movement of polymer particles towards the former. Whilst this diffusiophoretic mechanism was postulated 60 years ago it has not been widely accepted by the dipping community. Recent work by Williams et al.6 conclude that diffusiophoresis may be occurring but its magnitude is not significant in coagulant dipping.
Questions addressed in this paper
Here we examine, both experimentally and theoretically, two aspects of significance in practical dipping. They are connected since the mechanisms of both involve coagulant diffusion.One question relates to former movement. The continuous industrial process for making thin gloves involves horizontal movement of the formers, with a velocity in the region of 0.2 m s−1 (12 m min−1). The approximate speed of diffusion of Ca2+ ions in water at room temperature is estimated from Fick's law to be about 3 × 10⁻⁶ m s−1 for a typical dipping process after 30 seconds dwell. Comparing these speeds, it seems inevitable that the diffusion of Ca2+ into the latex compound, and hence the build-up of wet gel, would be greatly affected by the movement of the former. However, if former movement were a factor, it would be expected that wet gel thickness would not be uniform around the circumference of the gloves. This is not generally observed, so how do we rationalise these observations? The effect of lateral former movement is investigated here for the first time.
A problem that is seen periodically in industrial dipping is the appearance of macroscopic solid material in the latex compound, with the potential to cause glove quality problems. Intuitively, one cause of this problem could be leakage of coagulant from the wet gel into the dipping compound. Repeated dipping may then lead to coagulant accumulating to levels that cause latex instability. The question addressed here is how much coagulant (if any) leaks from the wet gel and is this a cause for concern?
Experimental
Materials
The compound described above was used in both the moving former and coagulant leakage experiments.
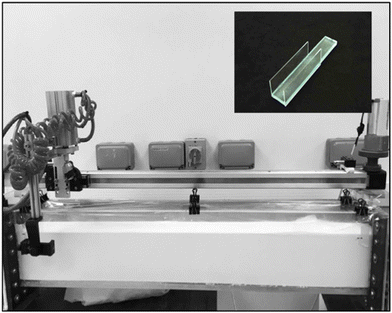
Formers. For the moving former experiments, glass formers measuring 120 × 60 × 6 mm (L × W × T) were used. The formers were small enough to minimise any tank wall effects. The formers were sand blasted to provide a micro-roughened surface to avoid wet gel shrinkage during drying. Some formers were modified by attaching side cheeks made of thin glass to each of the two vertical edges using silicone adhesive. These cheeks were flush with the front face of the former and protruded about 20 mm from the rear face. A photograph of a modified former is shown in the inset to Fig. 2. The purpose of the side cheeks was to reduce eddies on the back of the former. They were shown to be effective in preliminary experiments, using a dye coating, where the fluid movement at the rear face, with the cheeks fitted, was considerably reduced compared to that without cheeks.
For the coagulant leakage experiments, the former was a stainless steel cylinder, diameter 42 mm and length 150 mm, with a hemispherical end. These formers were used successfully in previous studies and had a known geometry, necessary for modelling the experiment.
Dip tank for moving former experiments. The dip tank for the moving former experiments was made of Perspex and measured 1100 × 95 × 190 mm (L × W × D). It was fitted with an electrically-driven traverse mechanism that could travel the length of the tank at various set speeds. A pneumatic piston was fitted to the traverse, providing controlled movement in the vertical direction. A former could be attached to the piston rod with a screw clamp. Both the traverse and the pneumatic piston were initiated by manual control. The tank assembly is shown in Fig. 2.
Traverse speeds of 0.034, 0.098 and 0.190 m s−1 were used, limited at the high end by the dwell times required and the length of dip tank. The vertical speed of the former, in and out of the dip tank, was about 0.3 m s−1.
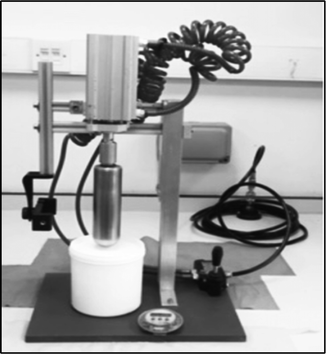
Apparatus for coagulant leakage studies. No lateral former movement was involved in the coagulant leakage experiments. Dipping was carried out with a simple apparatus that used a piston driven by compressed air to lower and raise the stainless steel cylindrical former into and out of the latex compound. The former was attached to the piston with a magnet to facilitate easy mounting and removal. Activation of the piston was controlled by a manual switch and the dwell time was measured with an electronic timer. Latex compound was contained in a cylindrical vessel, internal diameter 64 mm and height 115 mm. The apparatus is shown in Fig. 3.
Methods
For practical reasons, all the experiments were carried out with compound and formers at ambient laboratory temperature, about 20 °C. Although this is a lower temperature than found in industrial dipping, it should not affect the conclusions drawn.A glass former was dipped by hand into the 20% calcium nitrate solution to a depth of about 70 mm and dried at 120 °C for 10 minutes, followed by cooling to room temperature. The former was attached to the traverse with a screw clamp, so that the 60 mm faces of the former were at the front and rear with respect to its movement. The formers with the side cheeks were attached so that the cheeks faced to the rear as the former moved. The traverse was started, and the pneumatic piston activated. After the required dwell time, measured using an electronic timer, the former was raised, the traverse halted and the former removed. The former with dipped film was dried in a laboratory oven for 20 min at 120 °C. After cooling, the film edges were cut through with a sharp blade to facilitate removal without tearing. The thickness of the film from the front surface was measured using a micrometer at three equidistant positions along the length of the film. The same measurements were made on the film taken from the rear surface. At least 3 dips were made for each speed/dwell time combination and the average thicknesses for the front and rear films were calculated.
The experiments were carried out with plain formers and formers with side cheeks. The static experiments were carried out using the same equipment, but the traverse was not activated. Static dipping was only done using the plain formers.
For the translational movement experiments, the aim was to compare the front and back former faces during dipping. Rotation in the former about a vertical axis in the latex bath, as often seen in commercial dipping, was not employed as it was not compatible with this aim. Upon removal from the latex bath, the formers were manually rotated and whilst drying, the formers were kept horizontal.
Coagulant was applied by hand dipping a hot (approximately 70 °C) stainless steel former into a 20 wt% coagulant solution, withdrawing and manipulating the former to obtain an even coverage. The dip length was controlled to be about 2 mm greater than the subsequent compound dip. The amount of coagulant on the former was obtained from the loss in mass of the coagulant solution container. From 28 measurements, the average amount of dry coagulant applied was found to be 0.06 mol m−2.
155 g of latex compound was placed in the cylindrical container to give a dip length of 57 mm.
After each dip, the wet gel was removed from the former and discarded, but periodically the removed wet gel was tested for TSC (see below). The former was then cleaned and the process repeated, starting with a dip coating of fresh coagulant. After every dip, fresh compound was added to maintain the amount in the container at 155 g.
Two series of dips were carried out, identical except that:
• Series 1 was 40 dips, taking a 5 ml sample from the dipping vessel every 5 dips. Nine wet gel samples were taken at 4–5 dip intervals, the average wet gel mass was used in the model calculations.
• Series 2 was 120 dips, taking a 5 ml sample every 10 dips. Wet gel samples were also removed from the former every 10 dips and weighed.
For both series, the dwell time was 30 s.
The samples of compound were quantitatively analysed for calcium by inductively coupled plasma atomic emission spectroscopy (ICP-AES). A sample of undipped latex compound from each series was also analysed for calcium to determine the background amount. This was measured as 2.7 ppm for Series 1 and 2.3 ppm for Series 2, and these values were subtracted from the dipped compound results to give the final corrected values.
Samples spiked with 1 ppm and 20 ppm calcium were prepared and results of 0.5 ± 0.4 ppm and 16.5 ± 2.5 ppm were obtained. These were considered satisfactory, considering the low amounts of calcium present. The calcium analysis was carried out by Rubber Consultants, Brickendonbury, Hertford, UK.
Results and modelling
Former with translational movement
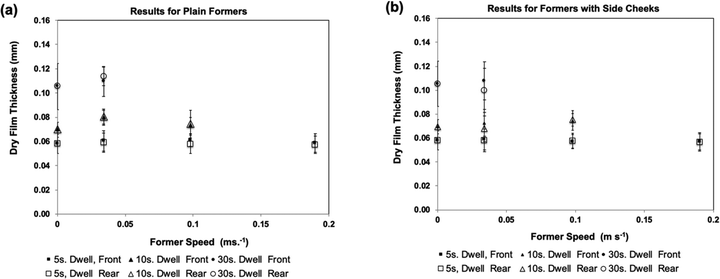
Fig. 4(a) shows average dry film thickness results using the plain glass formers. These were obtained using three different dwell times and four different lateral former speeds (including zero), according to the scheme shown in Table 1. In the Figure, results from the front and rear faces of the former are shown separately.
| Former speed (m s−1) | ||||
|---|---|---|---|---|
| 0 | 0.034 | 0.098 | 0.190 | |
| Dwell Time (s) | ||||
| 5 | ✓ | ✓ | ✓ | ✓ |
| 10 | ✓ | ✓ | ✓ | |
| 30 | ✓ | ✓ | ||
Fig. 4(b) presents dry film thickness results produced by the same experimental scheme, but using formers having side cheeks.
These results show that for each dwell time, the thickness of the dipped film was the same for the front and back of the formers, regardless of the lateral speed. Modification of the formers to change the flow at the rear face also produced no change in film thickness.
From the three measurements taken from each side of each dip, it was also found that the film thickness in the vertical direction (as dipped) appeared to be constant. This is in contrast to industrial experience in dipping full-size gloves, where film thickness is normally greater for the fingers compared to the cuff because of the difference in dwell time. Presumably the absence of a thickness gradient in the laboratory experiments is because of the small size of the glass laboratory formers.
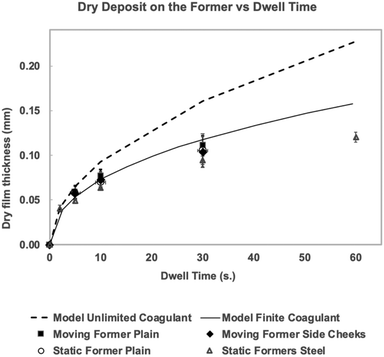
In Fig. 5, the same results are re-plotted as dry film build-up vs. dwell time. For each dwell time, all the moving plain former results are averaged. The same was done for the formers with side cheeks. The average results from the static tank dips for each dwell time are shown as separate points. Also included are dry film vs. dwell time results separately obtained from static dipping with the stainless steel formers and apparatus used for the leakage experiments shown in Fig. 3.
Fig. 5 shows that, within experimental error, all the results follow the same film thickness vs. dwell time curve. As well as demonstrating the absence of a former movement effect, these results provide some additional confidence in the methods used, since the results from the stainless steel formers were obtained using a different (gravimetric) method of measuring film thickness. It is also interesting to note that the difference in former material and texture (smooth stainless steel versus roughened glass) made no difference to the observed film growth.
Fig. 5 also contains two calculated dry film thickness vs. time curves, both based on eqn (1). Details of the calculations are given in later sections. The dotted line in Fig. 5 assumes an unlimited supply of coagulant at the former face. It can be seen that this model over-estimates the polymer accumulation on the former from very early dwell times, diverging considerably from the experimental results at 30 and 60 s dwell times. The solid line is the result for the much more likely situation where there is a finite quantity of coagulant available. This curve agrees well with the experimental results up to 30 s dwell time, but appears to over-estimate the film thickness at 60 s. The reason for the divergence at longer dwell times is the subject of ongoing work. It should be noted that the model gave results as the wet film thickness; for Fig. 5, this was converted to dry film thickness by multiplying by 0.2, the volume fraction of the latex compound. This is a good approximation, because previous work3 has shown that at these relatively short dwell times, the deposited wet gel has a TSC close to that of the host compound.
Diffusion theory of coagulant dipping. Before tackling the case of wet gel build-up for moving formers, it is necessary to consider the simpler problem of dipping without lateral movement.
Diffusion theory for static coagulant dipping. Immediately after the coated former is immersed, coagulant begins to diffuse into the latex compound. This diffusion process is described by Fick's law, which gives the relationship between coagulant concentration c, dwell time t and distance from the former x as shown in eqn (1):
 | (1) |
To obtain solutions for eqn (1), we have to provide suitable boundary conditions that should exist in the dipping process. Mathematically, the simplest condition is where there is a very large supply of coagulant available at the former surface. This case is described in the following section.
Static dipping with an unlimited coagulant supply. If we assume that the coagulant supplying calcium ions at the former surface is in the form of a saturated solution, concentration c0, the boundary conditions are
| x = 0, c = c0 | (2a) |
| x → ∞, c → 0 | (2b) |
With an initial condition of a coagulant-free bath, these boundary conditions allow for an analytical solution for eqn (1):
 | (3) |
Eqn (3) can be rearranged to give an expression for the distance x at which c reaches c*, the critical coagulation concentration:
 | (4) |
However, the dipping method of applying coagulant to a former inevitably means that there is a finite quantity of coagulant available when the coated former is immersed into the latex compound. The consequences of a limited coagulant supply are considered in the next section.
Static dipping with a finite coagulant supply. In this case, there is a quantity of coagulant Nload on the dip area of the former. The boundary conditions for this situation and the time for coagulant depletion on the former to begin, i.e. when the concentration at the former face begins to decrease from its initial value of c0, can be found as follows.
After depletion commences, the area under the concentration vs. distance curve remains constant, since the amount of diffusing coagulant is now constant at Nload. Since no fresh coagulant enters the diffusion process, the boundary condition (2a) at the former switches to one of zero flux, shown in (5a):
 | (5a) |
| x → ∞, c → 0 | (5b) |
If the time when the boundary condition switches from (2a) to (5a) is tswitch and the dip area is A, then tswitch can be found from the solution to:
 | (6) |
For a finite supply of coagulant, modelling the build-up of wet gel with dwell time is therefore obtained by:
• Calculating tswitch.
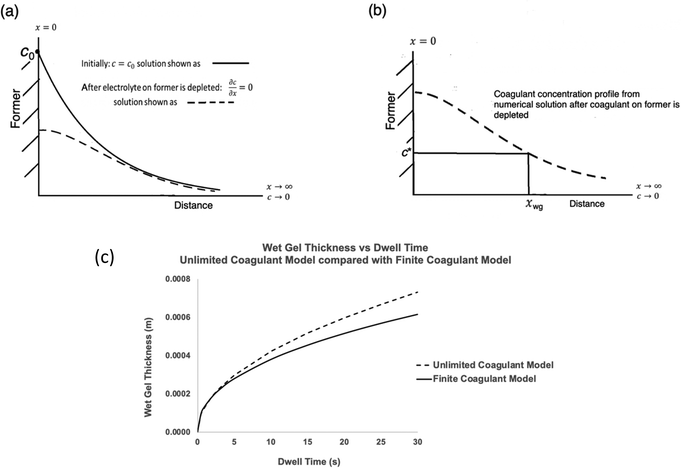
• Selecting a series of dwell times. For each dwell time, the coagulant vs. distance curve is calculated using eqn (1) with boundary conditions 2, switching to boundary conditions 5 at tswitch. For boundary conditions 5, there is no analytical solution to eqn (1) and a numerical solution is needed. In the present work, this was obtained in Mathematica®. The form of the resulting concentration profile is shown as the dotted line in Fig. 6(a).
• As for the unlimited coagulant model, each concentration profile is used to determine the wet gel thickness, xwg, at the point where c = c* as illustrated in Fig. 6(b). Thus wet gel thickness values are determined for each chosen dwell time, enabling a wet gel growth curve to be constructed. An example is given in Fig. 6(c), for calcium nitrate at a loading of 0.06 mol m−2, with a comparison curve for the unlimited supply case for the same coagulant.
Values and references for the constant parameters used in the calculations for Fig. 5 and 6(c) are given in Table 2.
| Parameter | Units | Symbol | Value | Source |
|---|---|---|---|---|
| Diffusion coefficient of Ca2+ in water | m2 s−1 | D | 7.92 × 10⁻¹⁰ | CRC Handbook (see references) |
| Saturation concentration of Ca(NO3)2 in water | mM | c 0 | 5300 | Measured |
| Critical coagulation concentration, Ca nitrate with the nitrile latex compound used in all experiments reported here | mM | c* | 4.3 | Measured |
| Average amount of coagulant on dip area (Amount deposited by 20 wt% Ca(NO3)2 solution) | mol m−2 | N load | 0.060 | Measured |
Transport theory for coagulant dipping with lateral former movement. Having established a model for wet gel build-up for static formers, we can consider the case where there is lateral movement.
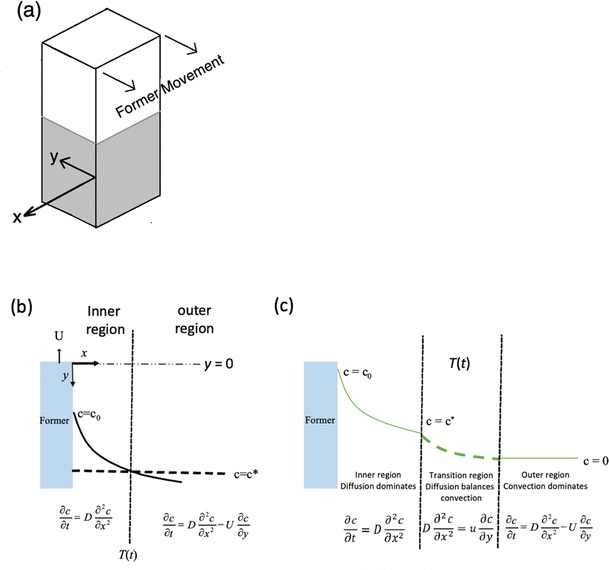
In the laboratory experiments, the flows of compound across the front and rear faces of the moving plate former are very complicated and therefore challenging mathematically. This problem is simplified here by considering flow past the sides of a cuboidal former, shown in Fig. 7(a). The former moves through the latex compound with a velocity U and with film growth normal to the direction of motion. To analyse the flow effect, the concentration profile is split into two regions as shown in Fig. 7(b). The region closest to the former is the growing wet gel through which coagulant diffusion is occurring. This diffusion is unaffected by the fluid flow, since it is occurring within the wet gel and hence the static model applies, with eqn (1) describing the transport.
Somewhere beyond the wet gel front, advective flow from the former movement will become dominant over diffusion. In this outer region, coagulant is rapidly swept away, so the coagulant balance equation now includes an advection term, as described below.
To simplify the fluid mechanics, it is assumed that there is a uniform flowfield, at constant velocity U, that extends up to the interface between the wet gel and the liquid compound. The question of a boundary layer, a thin region where the velocity reduces progressively to zero at the wet gel surface, was considered but adds considerably to the complexity of the model. The inclusion of a boundary layer is unlikely to change the mass transfer dramatically, because the concentration profile is mostly determined by the magnitude of c*/c0.
Inner region. As mentioned above, eqn (1) applies.
Outer region. Outside the wet gel region, both diffusion and advection are occurring and hence the coagulant transport is given by
 | (7) |
For the outer region we scale distances normal to the former surface with x*, a characteristic wet gel thickness and distances in the y direction with R, a typical width of the former. Time is scaled with  to produce
 | (8) |
 .
.
Using representative industrial values of R ∼ 0.2 m, U ∼ 0.2 m s−1, D ∼ 10−9 m2 s−1 and x* ∼ 10−3 m we obtain Pe ∼ 103 ≫ 1, which indicates that the advection term dominates. Hence, to leading order, we write  with solution c = constant in the outer region. The zero coagulant concentration ahead of the former implies that the outer solution is c = 0. This suggests that any coagulant which diffuses into the outer region is instantly advected away by the high velocity of the flowing fluid, providing a leakage mechanism specific to the moving former case. As shown later, coagulant leakage means that as continuous dipping proceeds, the coagulant concentration in the bulk latex increases but, at least for the case of calcium nitrate, this is small and taking the bulk value as zero seems a reasonable approximation.
The value of c = 0 in the outer region produces a mismatch in coagulant concentration at the boundary of the two regions, point T(t) in Fig. 7(b). Since the concentration profile must be continuous, we have to introduce a third, transition, region to provide the continuity.
Transition region. In the transition region we balance advection with diffusion, as shown in Fig. 7(c). The solution for the transition region comes from rescaling the outer region problem. Scaling distances normal to the former (x direction) by L, and distances in the direction of travel (y direction) by R and using the time scaling, t* as x*2/D we obtain:
 | (9) |
 | (10) |
| X = 0, c = c* | (11a) |
| X → ∞, c → 0 | (11b) |
| y = 0, c = 0 | (11c) |
The solution is an error function, which in dimensional form is
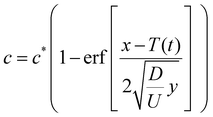 | (12) |
Thickness of the wet gel. As before, the coagulant concentration profile can be used to provide a value for the wet gel thickness at any dwell time.
To obtain the motion of the wet gel boundary T(t), we write a mass balance at the boundary, x = T(t)
 | (13) |
 | (14) |
 | (15) |
 and
and  we obtain an ODE for the growth of the wet gel as
 | (16) |
 comes from a numerical solution to the inner region. Note the parameter, y in eqn (16), which represents the distance along the former in the flow direction, is currently dimensional. There are two processes which can slow the growth of the wet gel; as shown earlier a limited amount of coagulant and, as shown here, the motion of the former. To deconvolute the two effects the results shown next all relate to the case with an unlimited amount of coagulant on the former.
For any value of translation velocity, U, we can solve eqn (16) to obtain the wet gel thickness with time. In doing so, the equation for the the inner region provides the value of  usually via a numerical solution. The method for solving eqn (16) is outlined in Appendix 1.
Eqn (16) shows that the wet gel growth for a moving former depends on c*/c0. Varying this ratio (by changing c*), with U = 0.2 m s−1 and using the values for D and c0 given in Table 2, yields the solutions shown graphically in Fig. 8. It can be seen that for c*/c0 ≪ 1, the static former solution (eqn (4)) is an excellent approximation to the wet gel thickness. This is because in this case, the inner region extends over most of the diffusional range. So again it is found that for the practical case of calcium nitrate as coagulant, where c*/c0 ∼ 10−3, there is a relatively simple expression for the wet gel growth with time. Note that for other coagulants with much larger values of c*/c0, as might be found for salts with monovalent cations, we expect the motion of the former to affect the wet gel growth. This is probably a theoretical observation, however, since increasing c* inevitably results in reducing amounts of deposit. For example, it is not possible to produce a film by dipping nitrile latex from a former dip coated with a saturated sodium chloride solution.
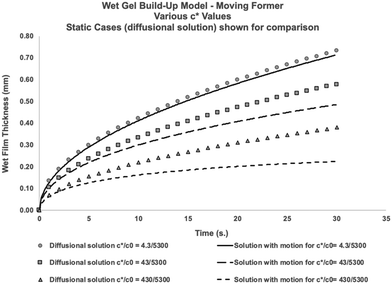 | ||
Fig. 8 Predicted growth of wet gel for a former moving through the latex bath at 0.2 ms−1. The solution is dependent on the value of  . The points are the diffusional solutional for wet gel growth with a stationary former. Note for the usual case of calcium nitrate, . The points are the diffusional solutional for wet gel growth with a stationary former. Note for the usual case of calcium nitrate,  , the diffusional solution is an excellent approximation. Solutions obtained by solving eqn (16) and the inner solution assumed an infinite amount of coagulant on the former The parameter values used for solutions are D = 7.92 × 10⁻¹⁰ m2 s−1, U = 0.2 m s−1, y = 0.05 m. It should be noted that industrial dwell times are usually around 20 seconds, so no effect of flow would be expected when using calcium nitrate as coagulant. , the diffusional solution is an excellent approximation. Solutions obtained by solving eqn (16) and the inner solution assumed an infinite amount of coagulant on the former The parameter values used for solutions are D = 7.92 × 10⁻¹⁰ m2 s−1, U = 0.2 m s−1, y = 0.05 m. It should be noted that industrial dwell times are usually around 20 seconds, so no effect of flow would be expected when using calcium nitrate as coagulant. | ||
It may appear inconsistent for the results of the moving former experiments to be from the front and rear of plate formers, while the modelling was for the sides of a cuboidal former. This was because the experiment was designed to compare deposition on two faces of the same former that were exposed to compound having different compound flow. This experiment was successful in demonstrating no flow effect. The modelling challenge was therefore to explain why this should be the case. The flow patterns encountered by the front and rear of the plate formers, observed in dye experiments, are very complex and unstable, making modelling extremely difficult. It was decided that, at least as a starting point, the effect of compound flow past the sides of a model cuboidal former would be examined and this demonstrated the minimal effect of flow under typical industrial conditions. The same effect will be seen with more complex flows such as around a hand shaped former, but complex CFD calculations would be required to show this and the elegance and understanding would be diminished.
For the case of limited coagulant, the solution detailed above using boundary conditions 5 at the appropriate time, allows the value of  to be obtained and used in a numerical solution of eqn (16). This is discussed further in Appendix 1.
Conditions when we expect wet gel non-uniformity along the former length. The simple model assumes uniform, unidirectional flow along the former. Interestingly, the resulting eqn (16) depends on the distance along the former length, y. This suggests the former motion introduces a lateral dependence on the glove thickness. This might be expected intuitively, although there is no evidence of such an effect occurring in commercial dipping. Examining the two terms on the right hand side of eqn (16), we expect the lateral variation in thickness to be observed when
 becomes O(1), or at least is not very small. Using
  and noting R and y are of similar magnitude, we obtain a lateral variation in glove thickness is expected when
  . For calcium nitrate the value of this variable is 5 × 10⁻⁴, whilst for NaCl we obtain a value of 0.09. In neither of these cases do we approach a value close to unity and hence we do not expect to see lateral inhomogeneity within a wet gel.
Coagulant leakage (Wash-Off)
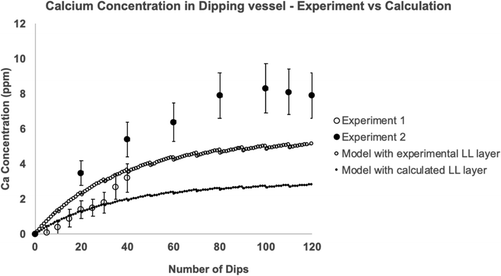 | ||
| Fig. 9 Repeat dipping into the same compound. Two laboratory series were carried out using the same dipping conditions. Shown are the experimental results for the accumulation of elemental calcium in the latex compound (points). Error bars refer to the uncertainty in the calcium analysis test. The lines in the Figure are the calculated calcium leakage obtained using parameters in Table 3. One line uses the experimental value for the thickness of occluded liquid compound (the LL layer) and the second line uses a calculated LL layer thickness. | ||
Modelling
The diffusional model for coagulant dipping (eqn (3), assuming unlimited coagulant) gives a coagulant concentration-distance profile for any dwell time. For calcium nitrate most of the profile is within the wet gel, as sketched in Fig. 10a. The leading part of the profile where c < c* represents the amount of coagulant in the liquid compound. If we have a clean separation on former withdrawal, this coagulant will be left in the compound as leaked material. This amount can be readily calculated from the coagulant concentration profile if the dip area is known. However, there are two modifications that should be made to this simple picture.
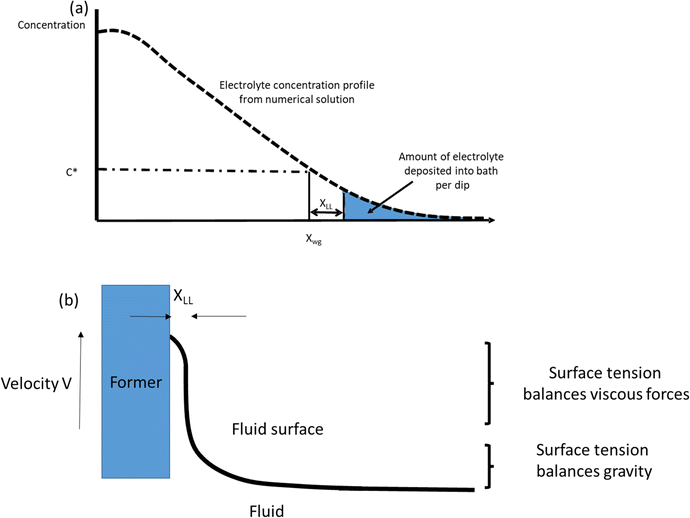 | ||
| Fig. 10 (a) Diagram (not to scale) of coagulant concentration vs. distance from the former for a given dwell time. xwg is the wet gel thickness. The amount of coagulant remaining in the dipping vessel after withdrawal of the former is proportional to the region beyond xwg + xLL, shaded in the diagram. (b) The formation of an occluded layer of liquid compound on the wet gel surface as a former is withdrawn. The layer thickness is calculated from the parameters in Table 3 using the Landau–Levich equation (see text). | ||
(1) As discussed above, in practical dipping, there is always a limited amount of coagulant available on the former, so in the calculations that follow, the concentration profile used to calculate leaked coagulant follows from the numerical procedure described above.
(2) Published discussions of the coagulant dipping process have referred to the existence of an entrained layer of uncoagulated latex compound on the wet gel surface as the former is withdrawn.2,4 This is equivalent to the pick-up of compound in straight (coagulant-free) dipping. The presence of liquid compound on the surface of freshly dipped wet gel is easily confirmed simply by shaking the former just after withdrawal. It is therefore important to consider the ungelled layer when modelling coagulant leakage, since this affects the separation point with the compound on former withdrawal. In the present study, the thickness of this layer was determined both experimentally and by calculation.
The entrained layer thickness was measured using a stainless steel former coated with a dried film of the nitrile compound, previously applied by coagulant-free dipping. The coated former was dipped, again coagulant-free, into the nitrile compound to the depth used in the repeated dip experiments. The mass of compound entrained was measured as the loss in mass of the dipping vessel, so knowing the dip area and the density of the compound (1.0 g ml−1), the wet film thickness could be calculated. The average of fifteen measurements gave a liquid film thickness of 0.091 ± 0.02 mm.
The theoretical thickness of the entrained layer was calculated following the treatment first described by Landau & Levich.10 The thickness of the liquid layer adhering to a plate, when it is withdrawn from a reservoir of liquid, is determined by a match between two regions. Close to the bulk liquid surface the film shape is established by a balance between surface tension and gravity. At the top of the film, surface tension balances the viscous stresses. This is shown diagrammatically in Fig. 10b. Landau and Levich match the solutions for the film thickness in the two regions to provide an estimate for the overall film thickness. The resulting equation is:
 | (17) |
| Parameter | Units | Symbol | Value |
|---|---|---|---|
| Former withdrawal velocity | m s−1 | V | 0.076 |
| Surface tension between latex compound and air | N m−1 | γ | 0.0309 |
| Viscosity of latex compound | N s m−2 | η | 0.00227 |
| Density of latex compound | g m−3 | ρ | 106 |
| Dip area of stainless steel former | m2 | A | 0.00752 |
| Average amount of coagulant on dip area | mol m−2 | N load/A | 0.060 |
| Average mass of wet gel on former (lab. expts) | g | 3.897 | |
| Mass of latex compound in the laboratory dipping vessel | g | 155 |
Knowledge of the entrained layer thickness now enables us to estimate the amount of coagulant left in the latex compound per dip. As before, the concentration versus distance profile for the finite coagulant model was obtained numerically. To obtain the quantity of coagulant leaked, the curve for a 30 s dwell time (as used experimentally) was integrated from a position of Xwg + XLL to infinity:
 | (18) |
Using the calculated Landau–Levich thickness of 0.127 mm in eqn (18), the amount of coagulant leaked per dip was 5.16 × 10⁻⁵ g. Using the experimental Landau–Levich thickness of 0.091 mm the leakage per dip was 9.46 × 10⁻⁵ g.
From these figures, the accumulation of coagulant in the latex compound with an increasing number of dips could be calculated. The calculation was done using a spreadsheet, with a simple mass balance and summation after each dip. Allowance was made for the removal of previously leaked coagulant that was contained within the wet gel after each dip (except the first). The values of dip vessel volume, dip area, mass of wet gel per dip and quantity of coagulant on the former required in this calculation are given in Table 3. Although a simple equation can be easily derived for straightforward accumulation (see the next section), the spreadsheet method was preferred here because the laboratory experiment included the removal of samples and accounting for this in the spreadsheet was straightforward.
The model coagulant accumulation using the leakage per dip values derived from the experimental and calculated Landau–Levich thicknesses are compared with the experimental results in Fig. 9. The agreement between the predicted and measured concentrations is good.
The model accumulation shows the approach to a plateau concentration as seen in the second experimental series. The explanation for the plateau is as follows. As well as there being a mechanism for coagulant to enter the liquid compound reservoir (leakage from the wet gel as described), coagulant can also leave. Once coagulant has entered the compound, it is assumed that it disperses quickly into the liquid giving a uniform concentration The wet gels of subsequent dips are therefore formed from compound that contains a low concentration of previously leaked coagulant. The coagulant within the wet gel is removed when the former is withdrawn. This process continues through the series of dips. The change in concentration of the coagulant per dip in the vessel can be calculated from the coagulant entering minus coagulant leaving. The expression obtained from this balance, decribed in the next section in more detail, predicts a plateau concentration with a value of N/V, where N is the mass of coagulant leaked per dip and V is the volume of wet gel for one dip.
In the static case, no leakage is expected during the dwell period and only occurs as part of the former withdrawal process. With a moving former, coagulant is being swept away from the former face throughout the dwell time. This case is considered below, using conditions that would be found in industrial dipping.
Instead of using the diffusional solution in eqn (18) we need to consider the transition zone solution outlined in eqn (12). The simplest case is then to assume that the flux of coagulant out of the wet gel is all lost into the dipping tank. This, of course, represents the maximum amount of coagulant that could be lost to the tank through the advection process. The amount of coagulant washed off per dip is obtained by integrating the quantity of coagulant present outside the wet gel over the dwell time:
 | (19) |
 | (20) |
The boundary condition for eqn (19) is that ctank = 0 when F = 0. This provides the solution
 | (21) |
 .
.
Using eqn (14) for the flux out of the transition zone we can estimate the amount of coagulant leaked per dip where A is the area of the former and we recognise that this now relates to the industrial hand shaped entity rather than the cylinder used in our laboratory experiments. We designate this as Af.
 | (22) |
| Parameter | Units | Symbol | Value |
|---|---|---|---|
| Mass of dry glove | g | m glove | 3.5 |
| Volume fraction of latex in dipping tank | ϕ 0 | 0.2 | |
| Dwell time | s | t dwell | 30 |
| Area of former | m2 | A f | 0.02 |
Some comments are needed about eqn (22). For latex stability within the dipping tank we clearly need the ratio  to be well below unity. The flux expression, eqn (14), is a maximum leakage rate, meaning that the concentration calculated using eqn (22) will be at the largest possible amount.
Taking a typical glove area of 0.045 m2 for Af and the Table 4 parameter values, we obtain  which indicates that stability issues will arise. However, there are at least two factors that should reduce this ratio.
The area of the glove is not straightforward, because the convex shape of the former will provide hindrance to coagulant advection. This was not a consideration for the model cuboid former used in the derivation of eqn (14).
It is assumed that lateral former movement relative to the latex compound will cause coagulant wash-off. As mentioned, in the above calculation the amount of wash-off was taken to be the maximum available. The actual amount swept away is difficult to assess, because of the uncertainty of the thickness of static or slow-moving compound very close to the wet gel surface and the complex shape of a glove former. Industrial experience suggests that leaked coagulant does not generally approach the point of destabilisation, although the theoretical estimates above suggest that leakage may be greater than trace amounts. It would be informative to measure the concentration in a commercial dipping tank as a function of time and to fit this data to eqn (21).
Conclusions
In this paper, results are presented from experimental and theoretical studies of two aspects of coagulant dipping, related through their dependence on the diffusion properties of the coagulant. Although former lateral movement and leakage of coagulant into the dip tank are of direct industrial interest, very few, if any, previous investigations of these topics have been published.Former movement
In the industrial production of thin gloves, formers move through the dip tank with a velocity of approximately 0.2 m s−1. The diffusional velocity of calcium ions, estimated from the published diffusion coefficient of calcium ions and diffusion theory, is of the order of 105 times smaller than this. The forced advection resulting from the former movement would therefore be expected to have a significant effect on the growth of wet gel on the former surface.Laboratory experiments reported here, using a metre long dip tank, found no effect of lateral former movement on film deposition or film uniformity. This is consistent with the practical success of the coagulant dipping process, which would be uncontrollable if horizontal former movement was important in deposition. The primary reason for this observation is, of course, that almost all of the diffusion movement occurs within the protected area of the wet gel. However, for wet gel to grow during the immersion period, some coagulant must enter the latex compound at the wet gel face. In this paper, coagulant movement in this region is considered using transport models.
Firstly, wet gel build-up from a simple static former was modelled using Fick's law, initially assuming an unlimited coagulant supply from the former face and then extending this to the more realistic case of a finite availability of coagulant. The finite coagulant case required a numerical (computational) solution. In these treatments for static dipping, the reasonable assumption was made that the coagulant concentration curve continued undisturbed from the face of the wet gel into the liquid compound. The experimental film growth with time, found to be the same for static and moving formers, was predicted well by the finite coagulant model for dwell times up to about 30 s. This is remarkable for a simple model using only four parameters, all of which are known or easily measured.
The growth equation is next modified to include the effect of former movement. The focus is now on the region where coagulant emerges from the wet gel. A transition region is introduced between the coagulating front, where the coagulant concentration is the critical coagulation concentration, and the bulk latex compound where the concentration is zero. Using these boundary conditions, a modified equation is developed relating coagulant concentration, distance from the former and time.
The modified equation contains the term c*/c0, the ratio of the critical coagulation concentration to the saturation concentration of the coagulant, which is assumed to be the concentration at the former face. For a small value of this ratio, as is the case for calcium nitrate, the modified equation predicts a wet gel growth that is very close to that given by the simple, unlimited coagulant, diffusion equation. This result explains the absence of a former movement effect on wet gel build-up, but suggests that for a coagulant with a much greater c* value, for example a monovalent coagulant, some effect from former movement might be expected. Unfortunately, it is not possible to verify this experimentally, because to obtain a measurable deposit with high c* coagulants, a larger coagulant deposit is required than is obtainable by dipping in a saturated solution. It should be mentioned that this is one of several reasons why a simple monovalent electrolyte, such as sodium chloride, would be difficult to use in practical dipping. Others include the crystalline nature of the salt deposit that affects film quality and appearance.
Coagulant leakage
Repeated laboratory-scale static dipping into the same latex compound was carried out, with each dip having a dwell time of 30 s. These experiments provided evidence for coagulant leakage and accumulation in the host compound. The quantity of accumulated coagulant was relatively small and appeared to reach a plateau as the number of dips increased.To model these experiments, diffusion theory for a finite amount of coagulant was used to calculate the coagulant concentration vs. distance profile for a 30 s dwell time. This profile was used to calculate the quantity of coagulant leaked into the dipping vessel per dip and hence for any chosen number of dips. The model included allowance for an entrained layer of liquid compound on the surface of the wet gel on former withdrawal. The presence of such a layer is easily observed qualitatively on freshly dipped samples. The thickness of this layer in the present study was obtained experimentally and theoretically, with results of 0.09 and 0.13 mm respectively. These results represent a surprisingly high proportion of the average total wet gel thickness of 0.470 mm for a 30 s. dwell time dip.
The model gave an accurate prediction of the rate of coagulant accumulation in the laboratory dipping vessel and identified the reason for the concentration reaching a plateau, this being the presence of an exit mechanism for leaked coagulant within the wet gel. The plateau concentrations observed and calculated were well below the critical concentration that would cause problems in practical dipping.
Coagulant leakage from a moving former is a very different proposition to that of static dipping. Whereas in static dipping, leakage only occurs on former withdrawal, the advection of former movement has the potential to sweep coagulant from the face of the wet gel into the latex compound throughout the dwell time. In this work, an upper estimate is considered, where all the coagulant diffusing from the wet gel is swept away. The amount lost per dip was calculated by integrating the coagulant flux at the wet gel face over the total dwell time and the leakage accumulating after N dips was calculated by summation. As before, the exit mechanism for leaked coagulant is accounted for. This produced a plateau leakage concentration of almost twice that needed to cause compound coagulation, obviously something not generally seen in the dipping industry.
This overestimation of coagulant leakage is not unexpected, since it was chosen as the worst case. There are at least two factors that would reduce leakage – the relative velocity of liquid compound close to the wet gel surface (where it presumably falls to zero) and the complex shape of a glove former.
If it is assumed that the hand shape of an industrial former reduces its effective area by about 50%, then the leakage model produces a plateau coagulant leakage of about 80% of the critical level. Although this would not cause immediate problems, it is still a high amount.
It seems that coagulant leakage caused by former movement – wash-off as the common term suggests – has the potential to cause problems. Designing a workable laboratory experiment to investigate this is challenging and perhaps data from large-scale dipping tanks would be helpful to refine the modelling.
Finally, it should be mentioned that although the theories and calculations were applied to the laboratory dipping of nitrile latex and calcium nitrate coagulant, they are applicable to larger scales and other polymer dispersions and coagulants, provided the appropriate values of the parameters are known.
Conflicts of interest
There are no conflicts to declare.Appendices
Appendix 1: numerical solution of eqn (16)
The inner solution comes from solving eqn (1). We non-dimensionalise spatial distances by L and time by L2/D. The inner solution is made to expand over a fixed spatial region via the transformation ζ = x/T(t) and τ = t. The inner equation becomes | (A1) |
| ξ = 0, c = 1 |
| ξ = 1, c = c*/c0 |
 | (A2) |
| t = 0, T = 1 | (A3) |
 . To simplify eqn (A2) the magnitude for L comes from defining
  . Note that this definition of L differs slightly from that used just below eqn (9). However the magnitude of L obtained is similar.
Numerical solutions are obtained via Mathematica® with central finite differences and an explicit Euler time step. 100 spatially uniform grid points are used to discretise eqn (A1) and the time step is successively reduced until convergence to a solution is obtained. Problems are encountered at small times when the wet gel thickness, T is small and consequently the value of dT/dt is numerically large. To counter this the initial condition is changed to be the early time solution calculated below and this operates for a time, until the transition region grows to at least 0.01.
Early time solution
An estimate for the motion of the wet gel thickness at early times is obtained by assuming to have a constant value. A justification for this assumption is found in eqn (A6). We call this constant C1 and obtain the solution to eqn (A2) as
 | (A4) |
 is negative, C1 is similarly negative. Assuming |T/C1| ≪ 1 we expand and obtain
 | (A5) |
 .
.
Using  and obtaining T from the value of x when c = c* we obtain
 | (A6) |
For the solutions shown in Fig. 7 we have assumed parameter values of U = 0.2 m s−1; D = 7.92 × 10⁻¹⁰ m2 s−1; y = 0.05 m. This sets the lateral length scale L to be 1.25 × 10⁻⁵ m and the timescale to be 0.196 seconds.
Appendix 2: average value of y
The transport equations include a y dependence. This occurs as and we therefore use an average value within the calculation. We define
  . This provides
  which for R = 0.2 m justifies the value of y used as 0.05 m.
Acknowledgements
Thanks are due to Dr Ian Williams, Dr Richard Sear and Prof. Joe Keddie for their helpful comments during the preparation of his paper. The provision of the latex by Synthomer Sdn. Bhd. (Malaysia) and the zinc oxide dispersion by Aquaspersions Ltd (UK) is gratefully acknowledged.References
- C. W. Stewart, Diffusion of Ca2+ Ions Through Neoprene Latex Films (Ca2+ Diffusion Through Latex Films), J. Colloid Interface Sci., 1973, 43(1), 122–131 CrossRef CAS.
- D. C. Blackley, W. F. H. Burgar and B. A. W. Shukri, Preprints of the Plastics & Rubber Institute Emulsion Polymers Conference, London, Paper 9, 1982 Search PubMed.
- R. Groves and A. F. Routh, Film formation during the coagulant dipping process, J. Polym. Sci.: Polym. Phys., 2017, 55(22), 1633–1648 CrossRef CAS.
- D. M. Hill, Latex Dipping: Science & Technology, 2nd edn, de Gruyter, Berlin/Boston, 2019 Search PubMed.
- B. V. Derjaguin, S. S. Dukhin and A. A. Korotkova, Diffusiophoresis in Electrolyte Solutions and its Role in the Mechanism of the Formation of Films from Caoutchouc Latexes by the Ionic Deposition Method, Kolloidn. Zh., 1961, 23, 53 Search PubMed and Prog. Surf. Sci., 1993, 43, 153–158 .
- I. Williams, S. Naderizadeh, R. P. Sear and J. L. Keddie, Quantitative imaging and modelling of colloidal gelation in the coagulant dipping process, J. Chem. Phys., 2022, 156(21), 214905 CrossRef CAS PubMed.
- R. Groves, M. DeSouza and D. Hopgood, The Role of Zinc Oxide in the Compounding of Carboxylated Nitrile Rubber for Dipped Products, Proc. MARGMA International Rubber Glove Conference, Kuala Lumpur, 2004.
- CRC Handbook of Chemistry & Physics Online, in J. R. Rumble ed., 102nd edn, 2021–2022.
- J. Israelachvili, Intermolecular and Surface Forces, 3rd edn, Elsevier Science, 2011 Search PubMed.
- L. Landau and B. Levich, Dragging of a liquid by a moving plate, Acta Physicochim. URSS, 1942, XVII(1–2), 42–54 Search PubMed.
| This journal is © The Royal Society of Chemistry 2023 |

