 Open Access Article
Creative Commons Attribution 3.0 Unported Licence
Impact of polymorphism in oleogels of N-palmitoyl-L-phenylalanine†
Duncan
Schwaller
,
Senem
Yilmazer
,
Alain
Carvalho
,
Dominique
Collin
and
Philippe J.
Mésini
 *
*
Université de Strasbourg, CNRS Institut Charles Sadron, 23 rue du Loess, 67000 Strasbourg, France. E-mail: mesini@ics-cnrs.unistra.fr
First published on 15th May 2023
Abstract
Gels of edible oils, also called oleogels, are developed as alternative products of solid fats to limit the uptake of saturated and trans-unsaturated fats and lower the associated risk of coronary disease. The gelation of oils can be achieved with a low molecular weight organogelator (LMWO), a compound that self-assembles at low concentrations in a solid 3D network and provides the mixture its solid-like behavior. We have studied N-palmitoyl-L-phenylalanine (Palm-Phe), an endogenous compound (i.e. naturally present in the human body) as a model LMWO of rapeseed oil. Palm-Phe forms gels at a concentration of 1 wt% in rapeseed oil. We have studied the thermodynamic and mechanical behavior of the corresponding gels. As evidenced by DSC and rheology, this system exhibits two transitions upon heating, in addition to the sol–gel transition, a gel–gel transition between two polymorphic gels. The structural differences between both polymorphs were revealed using cryo-SEM, X-rays scattering, and FTIR experiments. The metastability of one of the polymorphs was proven by ageing and annealing experiments.
Introduction
Organogelators are a class of compounds forming physical gels in various solvents at low concentrations.1–5 They self-assemble into aggregates most often with a high aspect ratio forming a 3D solid network and providing the solution its viscoelastic properties. Organogels find applications in various domains,6–9 for instance in the biomedical field10–13 or organic electronics.14,15 In food chemistry, oleogels obtained by gelation of edible vegetable oils by organogelators are developed as alternatives of solid fats.16,17 In many food products, solid fats provide the lipid phases their firmness. But because they often contain trans-unsaturated fatty acids (TFA), they increase the risk of coronary diseases and have become a public health issue.18–23 Public health authorities try to reduce TFA intake, and under the pressure of their regulations, the food industry aims at replacing solid fats by products with the same mechanical properties, but healthier; oleogels formed with vegetable liquid oils, which are TFA free, are considered as promising alternatives of solid fats. A few oleogelators are food grade or have no adverse effects such as vegetable waxes,24–26 mixtures of fatty alcohol and fatty acid,27 12-hydroxystearic acid (12-HSA),28–30 γ-oryzanol/sitosterol mixtures31 and ceramides.32 We have recently shown that palmitoylethanolamide, an endogenous fatty amide sold as a nutraceutical, is able to gel edible oils.33For applications in food chemistry, it is necessary to know and control the thermal stability of the gels, their mechanical properties at different temperatures (e.g. at fridge and body temperature) and their phase behaviors. Usually, oleogels and organogels show one transition, a gel–sol transition. This leads to simple phase diagrams with two domains: sol and gel. However, organogels in synthetic organic solvents may exhibit other types of transitions,34 such as monotectic transformations35 and gel-to-gel transitions.33,36–39 The latter corresponds to the transformation of the structure of the network from one polymorph to another one: from worm-like micelles to fibrillar crystals,39 from a liquid crystal to a crystal,37 from a crystalline form to another one,40 or from self-assembled nanotubes to fibrillar crystals.33,41 This polymorphism impacts the phase diagram by adding another gel domain, as exemplified by the few phase diagrams featuring gel-to-gel transitions.33,40 Polymorphic transformations also affect the rheological properties of the organogels.33,39 Therefore it is legitimate to know if such transformations exist in the oleogels developed to texture food products.
In this paper, we have explored the possibility of N-palmitoyl-L-phenylalanine (Palm-Phe, Scheme 1) to form oleogels. Palm-Phe belongs to the family of N-acylaminoacids (N-AAA). These fatty amides are endogenous molecules, i.e. naturally present in human tissues.42,43 As such, their toxicity is limited and they are easily metabolized and excreted. For instance, Ding et al. have shown no adverse effects for mixtures of N-AAA in mice diet at 5 wt%.44 As proven by Perinelli,45N-lauroylserine or N-lauroylproline is not cytotoxic at concentrations as high as 1.5 wt%. These facts show the lack of innocuity of these compounds. Indeed, Luo et al. have already considered N-lauroyl-L-alanine as a gelator of edible oils for food applications.46 In this context, we have showed that Palm-Phe (Scheme 1) can gel edible oils and we have investigated the properties of the gels in rapeseed oil as model oleogels. We have studied their thermodynamic properties by micro differential scanning calorimetry (μ-DSC), and their mechanical properties as a function of temperature. From these measurements, we mapped out the c-T phase diagram. We have evidenced a polymorphism between two forms of gels and we have studied their relative stability. We have studied the microstructures of the gels by cryo-SEM, by X-ray scattering and FTIR, and correlated them with the thermal and mechanical behaviour.
Materials and methods
Chemicals
Rapeseed oil (Vita D’or, refined oil) and olive oil (Carrefour) were purchased from a local grocery shop, safflower oil was obtained from Mon-droguiste. L-Phenylalanine was purchased from Tokyo Chemical Industry, palmitoyl chloride was obtained from Alfa Aesar, sodium hydroxide and magnesium sulfate were obtained from VWR Chemicals, and n-hexane and ethyl acetate were obtained from Carlo Erba.N-Palmitoyl-L-phenylalanine (Palm-Phe)
N-Palmitoyl-L-phenylalanine (Palm-Phe) was synthesized in an acetone/water mixture according to the method reported by Di et al.47 In a solution of L-phenylalanine (1.00 g, 6.10 mmol), NaOH (500 mg, 12.5 mmol) in H2O (120 mL) and acetone (80 mL), palmitoyl chloride (1.73 g, 6.30 mmol, 1 eq.) was added dropwise while the pH of the reaction mixture was maintained above 12 with aqueous NaOH (2 M). The solution was stirred at 25 °C for 48 h. The product was extracted with EtOAc (100 mL) and washed with water (3 × 100 mL). The organic phase was dried (MgSO4) and the solvent was evaporated under vacuum. The solid was recrystallised from n-hexane to afford Palm-Phe as a white solid (510 mg, 1.26 mmol, 21% yield). 1H NMR (500 MHz, DMSO-d6): δ (ppm): 12.70 (s, 1 H, COOH), 8.09 (d, J = 8.2 Hz, 1 H, NH), 7.23 (m, 5 H, CH aromatic), 4.41 (m, J = 5.4 Hz, 1 H, CH), 3.06 (dd, J = 13.8, 4.7 Hz, 1 H, CHNHCO), 2.84 (dd, J = 13.8, 9.9 Hz, 2 H, CH2CHCOOH), 2.02 (t, J = 7.3 Hz, 2 H, CH2CO), 1.37 (q, J = 7.3 Hz, 2 H, CH2CH2CO), 1.31–1.04 (m, 24 H, CH2), 0.89 (t, 3 H, CH3). 13C NMR (125 MHz, DMSO-d6): δ (ppm): 173.7 (COOH), 172.6 (NHCO), 138.3, 129.5, 128.5, 126.8 (CH aromatic), 53.7 (CHNH), 37.2 (CH2C6H6), 35.5 (CH2CO), 31.8 (CH2CH2CH3), 29.53, 29.49, 29.4, 29.3, 29.2 28.9, 25.7 (CH2CH2CO), 22.6 (CH2CH3), 14.4 (CH3). FTIR (ATR diamond, solid) cm−1: 3300 (νNH), 3067–3030 (νCH aromatic), 2957 (νasCH3), 2919 (νasCH2), 2870 (νsCH3), 2850 (νsCH2), 1729 (νC![[double bond, length as m-dash]](https://www.rsc.org/images/entities/char_e001.gif) O acid), 1647 (amide I), 1536 (amide II), 1467 (δCH2). MS (ESI+): 404.32 (MH+). Analysis. Found C 74.47, H 10.32, N 3.47; calc. for C25H41NO3 C 74.40, H 10.24, N 3.47.
O acid), 1647 (amide I), 1536 (amide II), 1467 (δCH2). MS (ESI+): 404.32 (MH+). Analysis. Found C 74.47, H 10.32, N 3.47; calc. for C25H41NO3 C 74.40, H 10.24, N 3.47.
Rheological measurements
The real and imaginary parts of the complex shear modulus were measured in the oscillatory mode with a stress-controlled rheometer Mars III from Haake, and a double Couette cell. The apparatus applies a torque (i.e., a stress) and measures the strain transmitted through the sample. The temperature was regulated using a heating bath and controlled between 80 and −10 °C, within ± 0.05 °C. The experiments consisted in following the evolution of the complex shear modulus at a given frequency (1 Hz) when temperature was decreased or increased between 80 and −10 °C at a rate of 0.25 °C min−1. This rate was selected, because it enabled the measurements at the same rate with all the other techniques. For each sample, the linear regime of deformation was previously determined by a stress sweep, and the applied stress was set to ensure that the response is in this regime. The aged gel was first formed at a cooling rate of −0.25 °C min−1 from 80 °C to −10 °C and rest for 1 h at −10 °C. Then the sample was heated to 18 °C at a rate of 0.25 °C min−1. The sample was then aged for three days at 18 °C and the spectra upon heating to 80 °C at 0.25 °C min−1 were recorded. The thickness of the sample was ∼400 μm. Prior to sample measurements, a blank experiment was conducted without the sample to know the residual stress from the apparatus, in phase with the strain, related to the experimental limit of the device as described previously.48 This residual stress has been subtracted from the rheological measurements presented in this study. The experiments in rheology were done twice. They were also repeated with different applied stresses. We have used two different batches of compounds, but no significant differences were observed between those batches.Micro differential scanning calorimetry (μ-DSC)
The thermograms were recorded with a MC-DSC (TA Instruments) operating with three measuring cells and one reference cell. The measuring cells were filled with different amounts of Palm-Phe (between 3 and 15 mg). Rapeseed oil was added in the cells to obtain the desired weight fraction of Palm-Phe. The final weights of the samples were about 307 mg. The reference cell was filled only with rapeseed oil. The full cells had equal weights within ± 5 mg. The gels were formed by cooling the sample from 80 °C to −10 °C at different rates (0.1, 0.25, 0.5 and 1 °C min−1), let rest for 1 h and heated at a rate of 0.25 °C min−1. The annealed gel was formed by cooling the sample from 80 °C to −10 °C as mentioned before. It was heated at 40 °C, annealed at this temperature for 15 h, cooled back to −10 °C, let rest for 1 h at −10 °C and heated to 80 °C at 0.25 °C min−1. The solidification temperature is measured at the onset of the exotherm. The melting temperatures were measured at the inflection point following the maximum of the endotherm, rather than at the maximum itself, as justified by our previous work.49 The molar enthalpies were calculated by integration of the peaks and their normalizaton to the number of moles of the gelator.Optical microscopy
The samples were observed with an optical microscope Olympus BX51, equipped with a Nikon DXM 1200 camera. The studied mixtures were first heated in an oven to yield a homogenous and isotropic phase. Rectangular capillaries (CM Scientific, 0.5 mm × 2 mm) were filled with this solution by capillarity and sealed with a UV-cured resin glue. The capillaries were placed in a hot stage regulated at ±0.1 °C and observed in brightfield. The sample was cooled and heated between 19 °C and 75 °C at a rate of 0.25 °C min−1, while the phase was observed and photographed at regular intervals.Fourier transform infrared (FTIR)
Mid-IR spectra of the samples were measured as a function of temperature between 20 and 70 °C with a Bruker Vertex 70 spectrometer with a mercury cadmium telluride (MCT) detector. The Palm-Phe/rapeseed oil mixture (2 wt%) was inserted in a home-made liquid cell, between two NaCl windows spaced by an indium flat O-ring (optical path 0.2 mm). The cell was inserted in a thermoregulated Linkam heating stage. For each spectrum, 64 scans were taken with a 2 cm−1 spectral resolution. The temperature was increased in steps of 2 °C, and held constant during each acquisition of spectra. The overall cooling or heating rate was the same as that for μ-DSC and rheology experiments (∼−0.25 °C min−1).Scanning electron microscopy (SEM)
A gel of Palm-Phe in rapeseed oil (2 wt%) was formed by heating the mixture and cooling it at 4 °C. Half of the sample was immersed in n-hexane to exchange the oil with this solvent as previously described.50 The other half was heated at 40 °C for 15 h, after annealing the solvent was exchanged in a similar way to the previous half. The samples were frozen, fractured, etched as previously described,50 and observed with a FEG-cryoSEM (Hitachi SU8010) at 1 kV at −150 °C.X-ray scattering experiments
X-ray scattering experiments were performed with a diffractometer developed by the DiffériX facility at the Institut Charles Sadron. The instrument works with a pinhole collimator and a hybrid photon counting detector (HPC–Dectrics Pilatus®3 R 300 K). The monochromatic beam (λ = 0.154 nm Cu Kα1, resolution = 0.03 nm−1) was obtained by projecting the primary beam from an X-ray generator (Rigaku, MicroMax 007HF) onto a confocal mirror with a multilayer coating (Confocal Max-FluxTM Optic, Rigaku). The footprint of the beam on the sample is about 800 μm wide. The distance between the sample and the detector was set to probe scattering vectors ranging from q = 0.4 to 10 nm−1 (q = 4πsin(θ/2)/λ where θ is the diffraction angle). Data reduction was performed following the standard procedure for isotropic scattering. The scattering vector was scaled with silver behenate. Counting times were approximately 10 minutes.A piece of a Palm-Phe/rapeseed oil gel (2 wt%) was introduced in a home-made cell with two mica windows 1 mm apart. The samples in their cells were subjected to different thermal treatments in an oven to prepare samples in different states. The fresh gels were formed by cooling the solutions from 80 °C to −10 °C at a rate of −0.25 °C min−1 and allowed to rest for 1 h at this temperature. They were heated to 20 °C at 0.25 °C min−1 and the spectrum was recorded. Another sample was prepared in the same way, but allowed to rest for 48 h at 20 °C before measuring the spectra. An annealed gel was formed by cooling a solution from 80 °C to −10 °C at a rate of −0.25 °C min−1 and allowed to rest for 1 h at this temperature. It was heated to 35 °C at 0.25 °C min−1 and allowed to rest for 15 h at this temperature and cooled to 20 °C at 0.25 °C min−1 and the spectra were recorded.
Results and discussion
Gelation tests
Palm-Phe is insoluble at room temperature in rapeseed, safflower and olive oil. It dissolves in these oils by heating and forms gels by cooling, for concentrations above 1 wt%. The formed gels are opaque and their visual aspect is stable with time (Fig. S1, ESI†). For the detailed physicochemical studies, we have selected rapeseed oil, because of its benefits for health, especially due to its polyunsaturated fatty acids (PUFA).51 Moreover, rapeseed oil does not freeze at temperatures as low as −10 °C, which enables the exploration of wide temperature ranges.Transitions of palm-Phe/rapeseed oil gels upon cooling
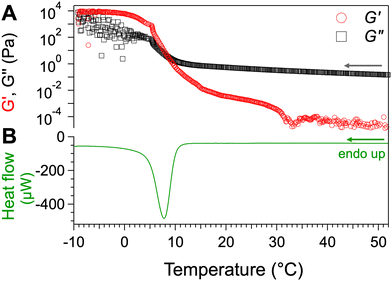
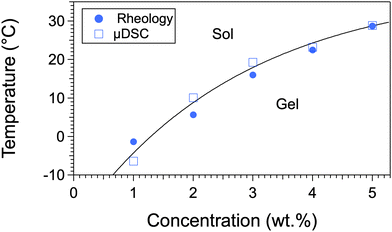
We have studied the transitions of these gels both by mechanical measurements and calorimetry. Fig. 1 shows the results for a sample of concentration 2 wt%. The elastic modulus G′ and the loss modulus G′′ is measured when the temperature decreases (Fig. 1A). At high temperatures, G′ < G′′, reflecting a liquid-like behavior and characterizing the sol phase. At lower temperatures, G′′ < G′, reflecting a solid like behavior and characterizing the gel state. The sol-to-gel transition TSG is considered as the temperature where G′ and G′′ intersects (for c = 2 wt%, TSG = 8.5 °C). The formation of the same gel was followed also by μ-DSC (Fig. 1B). The thermogram shows a sharp exothermal peak resulting from the formation of the solid fraction, with a minimum at 7.8 °C. From the thermodynamical standpoint, the temperature of solidification TCR of the gelator, is the onset temperature at 10.5 °C. The enthalpy of formation of the gel, measured from the area of the peak, is 27.3 ± 0.8 kJ per mol of the gelator. This value is on the same order of magnitude as the energies of the involved H-bonds: 15 kJ mol−1 for the H-bond between two secondary amides,52 30 kJ mol−1 for that between two carboxylic acids.53 The rheological and calorimetric experiments have been repeated for different concentrations, with the same cooling rates. They all show single transition, from sol to gel. There is a good agreement between the temperatures measured by both techniques and the largest difference, 5 °C is observed for 1 wt%. The measured temperatures are reported in the diagram upon cooling (Fig. 2). This state diagram has the aspect of those of classical organogels: it has two domains, a sol and a gel, and the boundary between them a monovariant transition temperature. The phase diagram upon heating is more complex, as showed in the next section.Transitions and phase diagram upon heating
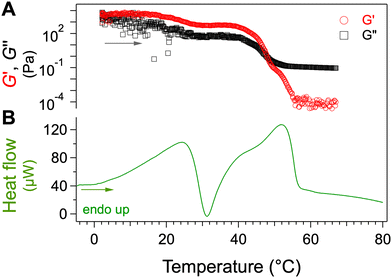
Samples at different concentrations are heated from −10 to 80 °C at a controlled rate (0.25 °C min−1). The phase behavior is also monitored by μ-DSC and rheology. The Fig. 3 shows the measurements with a sample at 2 wt%. The crossing of G′ and G′′ determines the temperature of the gel-to-sol transition TGS = 48 °C (Fig. 3A). The mechanical curves show another event at around 30 °C: when T increases, G′ and G′′ decrease while G′ remains higher than G′′, showing the evolution of the gel towards a weaker gel. Therefore, these curves clearly show a gel-to-gel transition.The thermogram (Fig. 3B) shows an endotherm (max at 25.6 °C) immediately followed by exotherm (min at 31.0 °C). When T further increases, a second endotherm appears at a temperature close to TGS, the transition temperature measured by rheology, which identifies the phase after transition as the sol, this last endotherm corresponds to melting of the gel, at the temperature of 55.3 °C. The thermal event between 26 and 31 °C can be interpreted in light of the mechanical behavior observed at these temperatures. The first endotherm corresponds to the partial melting of a solid phase, and the following exotherm, to its subsequent recrystallization into another solid phase. These events represent a transition of the solid network from one polymorph to another. This transformation is observed when the sample is subjected to several heating and cooling cycles (Fig. S2, ESI†). The succession of endo and exothermic peaks suggests a transition from a metastable phase to a stable phase. This will be confirmed later.
Samples at different concentrations have been studied by the same techniques and under the same conditions. They all show two transitions: around 27 °C, the gel-to-gel transition, and at a higher temperature, the gel-to-sol transition. All the measured temperatures map the phase diagram in Fig. 4. In this diagram, the gel-to-sol transition temperatures varies with c, as usually observed for organogels. The gel-to-gel transition occurs at a constant temperature within experimental errors, which shows that the equilibrium between both polymorphs is non-variant. This invariance can be explained by Gibbs’ phase rule: the variance or degree of freedom is v = c − φ + p, where c is the number of components, φ, the number of phases in equilibrium, and p the number of physical parameters. There are two components, the solvent and the gelator (c = 2); the pressure is constant, only temperature can be varied (p = 1), therefore the variance writes v = 3 − φ. The gel-to-gel transition involves three phases, one liquid and two solids (φ = 3), therefore, v = 0.
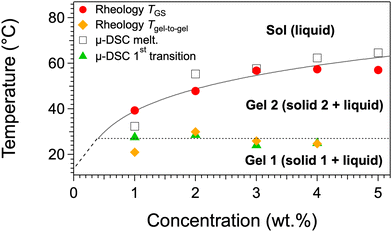 | ||
| Fig. 4 c-T phase diagram of palm-Phe/rapeseed oil; heating rate: 0.25 °C min−1 for the all the experiments. Tgel-to-gel is the temperature of the decrease of G′ and G′′ as observed in Fig. 3 around 27 °C; the 1st transition in DSC corresponds to the endotherm/exotherm combination around the same temperature. Gel 1 is metastable. The lines are guides to the eye. The dotted line represents the gel-to-gel transition and its presence depends on the thermal history of the sample (see the text for further details). | ||
The lower transition is easily observed by μ-DSC but is less sharp by rheology. Calorimetry measures the temperature of the transformation of a solid phase into another one; it is sensitive to the enthalpic change during this transformation. Rheology is sensitive to the overall structure of the solid network: not only its molecular packing, but also the shape of the solid aggregates and their connectivity. Hence, the transformation of solid 1 to solid 2 may have little impact on the mechanical properties. This first transition is not always present and its existence depends on the formation conditions and on the history of the gel. This fact, along with the aspects of the thermograms suggests the metastability of one form, which is studied more in details below.
Relative stability of both gels
In order to investigate the stabilities of gels 1 and 2, the transitions were studied in gels at 4 wt% with different thermal histories. A first gel was formed by cooling the sample from 80 °C to −10 °C, at a rate of −0.5 °C min−1. It was kept for only 1 h at −10 °C before measuring the thermogram upon heating. A second gel was formed under the same conditions, heated at 40 °C, annealed at this temperature for 15 h, cooled back to −10 °C and its thermogram was measured upon heating. The full sequences are monitored by DSC but only the final endotherm is reported in Fig. 5 (see Fig. S2 and S3, ESI† for examples of complete measurements). The first sample, which is not annealed shows both transitions (Fig. 5, top curve): the first endotherm (23 °C) along with the next exotherm (26 °C) correspond to the gel-to-gel transition; the second endotherm at 54 °C, coincident with TGS, corresponds to the gel-to-sol transition.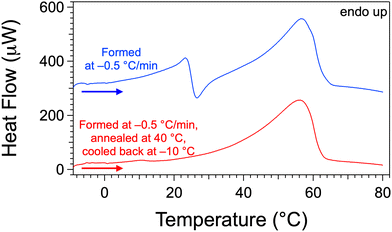 | ||
| Fig. 5 Thermograms of Palm-Phe gels at 4 wt% with different thermal histories. Only the final heating phases at 0.25 °C min−1 are shown. An example of a complete cycle for the annealing experiment is reported in Fig. S3 (ESI†). The upper curve is shifted for clarity. | ||
The second sample was annealed above the gel-to-gel transition and below the fusion of the gel. It showed only the gel-to-sol transition at 54 °C (Fig. 5, bottom curve) but no longer gel-to-gel transition at around 26 °C. This proves that the gel below the first transition (gel 1) is metastable. The solid fraction of this gel transforms into another solid, but the reverse transition is not observed on cooling. Consequently, the dotted line representing the gel-to-gel transition in the phase diagram (Fig. 4) delimits a metastable domain and is observed only if the gel 1 is present and thus depends on the thermal history.
The metastability of gel 1 is also observed when it is aged. A gel at 2 wt% was formed and allowed to rest at 18 °C for three days and its elastic and viscous moduli were measured while the temperature was increased (Fig. 6A). The decrease of the elastic and viscous moduli at 25 °C, is visible in the freshly prepared gel but no longer in the aged gel. In parallel, the freshly prepared gel shows both transitions by μ-DSC (Fig. 6B) but no longer gel-to-gel transition after annealing.
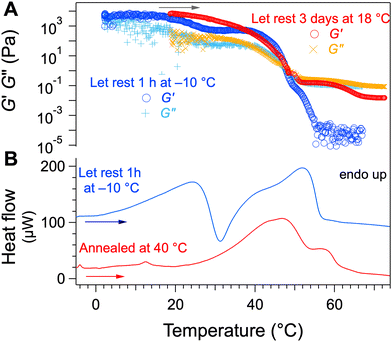 | ||
| Fig. 6 (A) Elastic, viscous moduli of Palm-Phe/rapeseed oil gels (2 wt%) with different thermal histories. (B) Thermograms of the same samples. | ||
We have studied whether slower cooling rates during the formation of the gel favors the formation of the more stable polymorph. Gels at 1 and 2 wt% were prepared at different cooling rates: −1, −0.5, −0.25 and −0.1 °C min−1. The thermograms upon cooling showed one endotherm, with an onset temperature which varies linearly with the cooling rate (Fig. S2 and S4, ESI†). The thermograms of the following heating phases all showed both transitions (Fig. S5, ESI†). Therefore, for low concentrations, slow cooling rates do not favor the formation of the thermodynamically stable gel 2, unlike annealing or ageing. But when the gel at 4 wt%, is formed at a rate of −0.25 °C min−1 instead of −0.5 °C min−1, the first transition disappears (Fig. S6, ESI†).
On the cooling curves, the temperature of crystallization increases linearly when the cooling rate decreases from 1 to −0.25 °C, and increases abruptly at −0.1 °C min−1 (Fig. S4, ESI†), which indicates that for this low rate, only the solid 2 forms. These studies show that the formation of gel 1 is kinetically favored. The rate of formation of the stable gel 2 is slower, but increases faster with concentration than for gel 1.
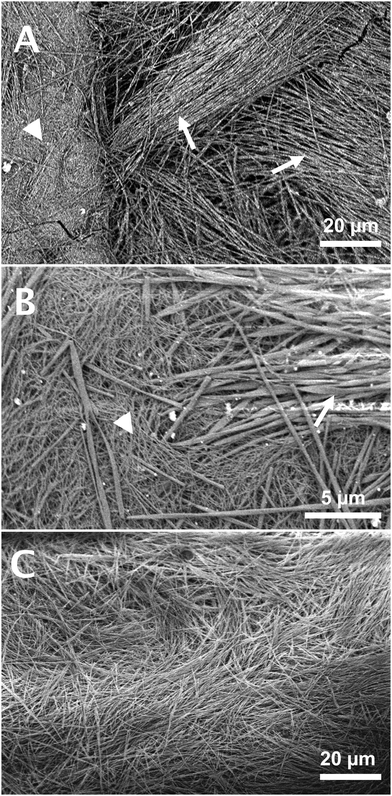
Gel morphologies and structural studies
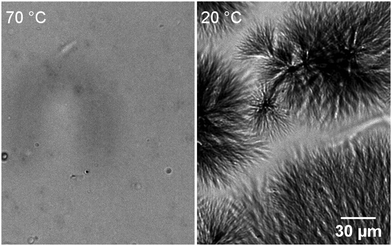
The samples were observed during their transitions by optical microscopy to identify the nature and morphology of the phases. During the cooling phase, large objects grow from nucleation points (Fig. 7) to reach diameters of tens of micrometers. They are dendritic or spherulitic structures made of fibers visible at the edges. When the sample is heated, the spherulites start to decrease in size at ∼51 °C and disappear at 57 °C, when the gel melts (Fig. S7, ESI†). No other structure is observed although the existence of two different gels has been evidenced. However, the mixture is not homogeneous since the visible objects do not fill the whole volume of the sample. The interstices between the spherulites, tens of micrometers wide, may contain other structures too small to be detected by OM. For this reason, we have explored the structures of the gels by cryo-SEM (Fig. 8) after exchange of the oil by n-hexane and sublimation of the solvent. Two gels have been observed: a freshly formed one and an annealed one (15 h at 40 °C). The gel observed just after its formation is heterogenous with two kinds of domains segregated by marked limits (Fig. 8A): the first one contains thick fibers, visible at low magnification, the second one is a denser area. Observation of both domains at higher resolution show that the thick fibers have an average diameter of 350 ± 149 nm and are twisted (Fig. 8B, arrows). The dense phase is also made of fibrils (Fig. 8B, arrow head), thinner than the previous ones with diameters of ∼70 ± 24 nm. When the sample is annealed for 15 h at 40 °C, the thin fibrils disappear and when observed at large field, the sample shows a uniform structure with only large fibers (Fig. 8C). Both domains observed before annealing correspond to both polymorphic solids previously described. The thin disordered fibrils disappear from the annealed gel, which identified them as the metastable structures. The large fibers can be identified as the thermodynamically stable population. Given their sizes, they also constitute the large objects visible by OM. The dense domains observed in Fig. 8A are likely the transparent areas observed by OM. Both the observations by OM and SEM show the difficulty to obtain a pure gel 1: there is an amount of large fibers even at lower temperature. This suggests that the transformation of the metastable solid 1 into solid 2 is fast enough to have progressed significantly in the observed sample. Annealing just brings it to completion. Therefore, the transitions observed by μ-DSC or rheology may correspond to the transformation of only a fraction of the solid. The change of the morphology during the transition may explain the change in elastic modulus of the samples (Fig. 3). The elasticity depends both on the density of the nodes of the network and on the intrinsic stiffness of the aggregates. The fibrils in gel 1 are thinner objects and probably less rigid than the fibers in gel 2. However, a given amount of gelator forms more thin fibers than large one, and may lead to a higher density in nodes.The structural difference between gel 1 and 2 is evidenced by analysis by X-ray scattering (Fig. 9). Gels of Palm-Phe (2 wt%) were prepared with different thermal histories and their intensities measured for q-values composed between 0.04 and 1.04 Å−1. When the gel was freshly formed to afford gel 1, it showed a peak at 0.131 Å−1 and a weak peak at 0.187 Å−1 (Fig. 9, bottom curve). The large oscillation between 0.1 and 0.7 Å−1 is due to the scattering by the oil. After two days at 20 °C, the gel is totally transformed into gel 2 and additional peaks are observed: a large one at 0.232 Å−1 corresponding to a repeat distance of 27 Å, and a smaller one at 0.697 Å−1 (Fig. 9, middle curve). A gel annealed at 35 °C for 15 h shows the same peaks than the aged gel (Fig. 9, top curve). This evolution of the spectra, shows that in gel 1 and gel 2, the solid networks are polymorphs, with distinct crystalline forms.
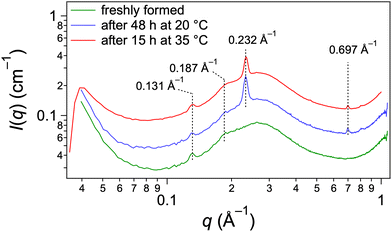 | ||
| Fig. 9 X-ray scattering of palm-Phe/rapeseed oil 2 wt% when freshly formed at 0.25 °C min−1 (bottom curve), aged for 2 days at 20 °C (middle curve) and heated at 35 °C during 15 h (top curve). | ||
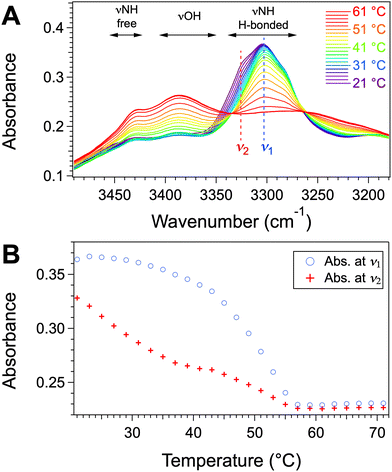
We studied the evolution of the intermolecular interactions in the gels by variable temperature FTIR. The spectra of the mixtures of Palm-Phe and rapeseed oil were measured at different temperatures, from 20 °C to 70 °C (Fig. 10A). In the stretching XH area, the spectra at low temperature show a major band at ν1 = 3305 cm−1, corresponding to the NH stretching band (νNH). In the carbonyl stretching area, at low temperatures, the amide I band is found at 1643 cm−1 (Fig. S8, ESI†). These wavenumbers show that the majority of the amide groups are H-bonded with each other.54 The wavenumber and the intensity of the νNH band do not change significantly upon heating up to 35 °C. When the gel is further heated, the νNH band of the linked amides disappears gradually, while two bands at 3388 and 3425 cm−1, minor at low temperatures, increase and become preponderant. These bands can be attributed to the νOH bands of the acid group and to the νNH of free amides. The νNH band of the free amides disappears at 55 °C, which is the melting temperature measured by μ-DSC. A similar evolution can be observed with the amide I and amide II bands (Fig. S8, ESI†). The amide I band at 1643 cm−1 decreases and disappears when the gel melts. It is progressively replaced by the band at 1682 cm−1, characteristic of free amides. This evolution shows that the aggregation is governed by H-bonds between the amide groups. The apparition of the νOH band at 2425 cm−1 suggests that H-bonds between carboxylic acids are also involved in the aggregation.
The spectra were examined in detail between 21 and 35 °C, where the gel-to-gel transition occurs. The spectra show no evolution except a shoulder at ν2 = 3326 cm−1 which decreases and disappears at about at 35 °C (Fig. 10A). The intensity at ν2 decreases linearly and faster than the intensity at ν1 = 3305 cm−1 below 35 °C (Fig. 10B). At 35 °C, after a change of slope, it decreases with a different regime. The first step coincides with the disappearance of gel 1, while the second one corresponds to the evolution of gel 2.
The transformation upon heating results in very slight spectroscopic changes. But, as shown by OM and SEM, even at low temperatures, the gel contains a mixture of both forms; therefore, the spectra at low temperature represent already a mixture of both forms. Therefore the small changes observed between 21 and 31 °C represent the conversion of only the remaining form 1. Below 29 °C, the spectra show one isosbestic point at 3264 cm−1 and above 29 °C, and a second one at 3335 cm−1. This evolution is consistent with two successive transformations. The shoulders in gel 1 corresponds to amides linked with weaker H-bonds than the other amides.
Conclusions
Palm-Phe, an endogenous N-acylaminoacid, is able to gel edible oil at a concentration of ∼1 wt%. The study of the transitions of these gels revealed two kinds of transitions. A classical gel-to-sol transition, at a temperature varying with concentration, and at a lower temperature a gel-to-gel transition, which is non-variant. The latter corresponds to a polymorphic transformation of the solid network. The gel-to-gel transformation impacts the rheological properties of the oleogels and their thermal stability. The knowledge of their phase diagram can explain and predict the change of their properties when processing them. The polymorphism, and the stability or metastability of the polymorphs also explain how the properties of the gels depend on the thermal treatments.Author contributions
Conceptualization, P. J. M. and D. C.; methodology, D. S., S. Y., A. C., D. C., and P. J. M.; formal analysis, D. S., S. Y., D. C., and P. J. M.; investigation, D. S, S. Y., A. C., and D. C.; resources, P. J. M.; writing—original draft preparation, D. S. and S. Y. P. J. M.; writing—review and editing, D. S., S. Y., D. C., and P. J. M.; visualization, D. S., S. Y., and P. J. M.; supervision, D.C. and P. J. M.; and funding acquisition, P. J. M.Conflicts of interest
There are no conflicts to declare.Acknowledgements
The ICS characterization facility and Anaïs de Maria are acknowledged for the FTIR measurements. We thank Mélanie Legros for the help with μ-DSC. The ICS electronic microscopy facility is acknowledged for the SEM experiments. This project was funded by the Carnot Institute MICA (project Oleogel). D. S and S. Y. was supported by fellowship from the French High Education and Research Department (MESR, ED 182). The SAXS detector was financed by the Carnot Institute MICA. As part of the Interdisciplinary Institute HiFunMat, the work was supported by IdEx Unistra (ANR-10-IDEX-0002) and SFRI (STRAT’US project, ANR-20-SFRI-0012) under the framework of the French Investments for the Future Program.Notes and references
- Low Molecular Mass Gelators - Design, Self-Assembly, Function, ed. F. Fages, Springer Berlin Heidelberg, Berlin, Heidelberg, 2005, vol. 256 Search PubMed.
- R. G. Weiss and P. Terech, Molecular gels: materials with self-assembled fibrillar networks, Springer, Dordrecht, 2006 Search PubMed.
- S. S. Babu, V. K. Praveen and A. Ajayaghosh, Chem. Rev., 2014, 114, 1973–2129 CrossRef CAS PubMed.
- J.-M. Guenet, in Organogels: Thermodynamics, Structure, Solvent Role, and Properties, ed. J.-M. Guenet, Springer International Publishing, Cham, 2016, pp. 17–36 Search PubMed.
- R. G. Weiss, Molecular Gels, The Royal Society of Chemistry, 2018 Search PubMed.
- A. Dawn, T. Shiraki, S. Haraguchi, S. Tamaru and S. Shinkai, Chem. – Asian J., 2011, 6, 266–282 CrossRef CAS PubMed.
- A. R. Hirst, B. Escuder, J. F. Miravet and D. K. Smith, Angew. Chem., Int. Ed., 2008, 47, 8002–8018 CrossRef CAS PubMed.
- E. Carretti, M. Bonini, L. Dei, B. H. Berrie, L. V. Angelova, P. Baglioni and R. G. Weiss, Acc. Chem. Res., 2010, 43, 751–760 CrossRef CAS PubMed.
- B. Escuder, F. Rodríguez-Llansola and J. F. Miravet, New J. Chem., 2010, 34, 1044–1054 RSC.
- S. Murdan, Expert Opin. Drug Delivery, 2005, 2, 489–505 CrossRef CAS PubMed.
- A. Vintiloiu and J.-C. Leroux, J. Controlled Release, 2008, 125, 179–192 CrossRef CAS PubMed.
- K. J. Skilling, F. Citossi, T. D. Bradshaw, M. Ashford, B. Kellam and M. Marlow, Soft Matter, 2014, 10, 237–256 RSC.
- X. Du, J. Zhou, J. Shi and B. Xu, Chem. Rev., 2015, 115, 13165–13307 CrossRef CAS PubMed.
- A. Ajayaghosh, V. K. Praveen and C. Vijayakumar, Chem. Soc. Rev., 2008, 37, 109–122 RSC.
- S. S. Babu, S. Prasanthkumar and A. Ajayaghosh, Angew. Chem., Int. Ed., 2012, 51, 1766–1776 CrossRef CAS PubMed.
- A. G. Marangoni and N. Garti, Edible oleogels: structure and health implications, Elsevier, 2018 Search PubMed.
- A. K. Zetzl and A. G. Marangoni, in Trans Fats Replacement Solutions, ed. D. R. Kodali, AOCS Press, 2014, pp. 215–243 Search PubMed.
- W. P. Castelli, R. J. Garrison, P. W. F. Wilson, R. D. Abbott, S. Kalousdian and W. B. Kannel, JAMA, 1986, 256, 2835–2838 CrossRef CAS PubMed.
- M. J. Martin, W. S. Browner, S. B. Hulley, L. H. Kuller and D. Wentworth, The Lancet, 1986, 328, 933–936 CrossRef PubMed.
- F. B. Hu, J. E. Manson and W. C. Willett, J. Am. Coll. Nutr., 2001, 20, 5–19 CrossRef CAS PubMed.
- D. Mozaffarian, M. B. Katan, A. Ascherio, M. J. Stampfer and W. C. Willett, N. Engl. J. Med., 2006, 354, 1601–1613 CrossRef CAS PubMed.
- I. A. Brouwer, A. J. Wanders and M. B. Katan, PLoS One, 2010, 5, e9434 CrossRef PubMed.
- P. M. Clifton and J. B. Keogh, Nutr., Metab. Cardiovasc. Dis., 2017, 27, 1060–1080 CrossRef CAS PubMed.
- J. F. Toro-Vazquez, J. A. Morales-Rueda, E. Dibildox-Alvarado, M. Charó-Alonso, M. Alonzo-Macias and M. M. González-Chávez, J. Am. Oil Chem. Soc., 2007, 84, 989–1000 CrossRef CAS.
- L. S. K. Dassanayake, D. R. Kodali, S. Ueno and K. Sato, J. Am. Oil Chem. Soc., 2009, 86, 1163 CrossRef CAS.
- H.-S. Hwang, S. Kim, M. Singh, J. K. Winkler-Moser and S. X. Liu, J. Am. Oil Chem. Soc., 2012, 89, 639–647 CrossRef CAS.
- F. G. Gandolfo, A. Bot and E. Flöter, J. Am. Oil Chem. Soc., 2004, 81, 1–6 CrossRef CAS.
- C. A. Elliger, D. G. Guadagni and C. E. Dunlap, J. Am. Oil Chem. Soc., 1972, 49, 536–537 CrossRef CAS.
- M. A. Rogers, Food Res. Int., 2009, 42, 747–753 CrossRef CAS.
- M. A. Rogers and A. G. Marangoni, Cryst. Growth Des., 2008, 8, 4596–4601 CrossRef CAS.
- A. Bot and W. G. M. Agterof, J. Am. Oil Chem. Soc., 2006, 83, 513–521 CrossRef CAS.
- M. A. Rogers, A. J. Wright and A. G. Marangoni, Soft Matter, 2009, 5, 1594–1596 RSC.
- D. Schwaller, S. Zapién-Castillo, A. Carvalho, J. Combet, D. Collin, L. Jacomine, P. Kékicheff, B. Heinrich, J.-P. Lamps, N. P. Díaz-Zavala and P. J. Mésini, Soft Matter, 2021, 17, 4386–4394 RSC.
- S. Yilmazer, D. Schwaller and P. J. Mésini, Gels, 2023, 9, 273 CrossRef CAS PubMed.
- E. Christ, C. Blanc, A. Al Ouahabi, D. Maurin, R. Le Parc, J.-L. Bantignies, J.-M. Guenet, D. Collin and P. J. Mésini, Langmuir, 2016, 32, 4975–4982 CrossRef CAS PubMed.
- A. Meister, S. Drescher, V. M. Garamus, G. Karlsson, G. Graf, B. Dobner and A. Blume, Langmuir, 2008, 24, 6238–6246 CrossRef CAS PubMed.
- A. Kotlewski, B. Norder, W. F. Jager, S. J. Picken and E. Mendes, Soft Matter, 2009, 5, 4905–4913 RSC.
- V. A. Mallia, P. D. Butler, B. Sarkar, K. T. Holman and R. G. Weiss, J. Am. Chem. Soc., 2011, 133, 15045–15054 CrossRef CAS PubMed.
- H. Xie, M. A. Ayoubi, W. Lu, J. Wang, J. Huang and W. Wang, Sci. Rep., 2017, 7, 1–6 CrossRef CAS PubMed.
- C. H. Chen, I. V. Damme and E. M. Terentjev, Soft Matter, 2009, 5, 432–439 RSC.
- M. Gubitosi, A. D’Annibale, K. Schillén, U. Olsson, N. V. Pavel and L. Galantini, RSC Adv., 2017, 7, 512–517 RSC.
- H. B. Bradshaw, N. Rimmerman, S. S.-J. Hu, S. Burstein and J. M. Walker, Vitamins & Hormones, Elsevier, 2009, vol. 81, pp. 191–205 Search PubMed.
- S. H. Burstein, Mol. Pharmacol., 2018, 93, 228–238 CrossRef CAS PubMed.
- B. Ding, L.-Z. Wan and Y.-Q. Zhang, J. Surfactants Deterg., 2017, 20, 1173–1187 CrossRef CAS.
- D. R. Perinelli, L. Casettari, M. Cespi, F. Fini, D. K. W. Man, G. Giorgioni, S. Canala, J. K. W. Lam, G. Bonacucina and G. F. Palmieri, Colloids Surf., A, 2016, 492, 38–46 CrossRef CAS.
- C. Luo, B. Yang, Y. Zhou, J. Yang, F. Han and X. Baocai, Colloids Surf., A, 2020, 585, 124184 CrossRef CAS.
- B. Di, L. Cheng, Q. Jiang, M. Su and W. Hao, New J. Chem., 2013, 37, 1603 RSC.
- D. Collin, R. Covis, F. Allix, B. Jamart-Grégoire and P. Martinoty, Soft Matter, 2013, 9, 2947–2958 RSC.
- D. Schwaller, E. Christ, M. Legros, D. Collin and P. J. Mésini, Gels, 2021, 7, 93 CrossRef CAS PubMed.
- D. Schwaller, Y. Sui, A. Carvalho, D. Collin and P. J. Mésini, Food Chem., 2022, 386, 132671 CrossRef CAS PubMed.
- L. Lin, H. Allemekinders, A. Dansby, L. Campbell, S. Durance-Tod, A. Berger and P. J. Jones, Nutr. Rev., 2013, 71, 370–385 CrossRef PubMed.
- M. Davies and D. K. Thomas, J. Phys. Chem., 1956, 60, 767–770 CrossRef CAS.
- A. D. H. Clague and H. J. Bernstein, Spectrochim. Acta, Part A, 1969, 25, 593–596 CrossRef CAS.
- D. Lin-Vien, N. B. Colthup, W. G. Fateley and J. G. Grasselli, The Handbook of Infrared and Raman Characteristic Frequencies of Organic Molecules, Academic Press, Boston, 1991, pp. 155–167 Search PubMed.
Footnote |
| † Electronic supplementary information (ESI) available: Photographs of the gels in different oils; thermograms of palm-Phe/rapeseed oil (2 wt%) formed at different cooling rates, or annealed; temperatures of formation as a function of cooling rates; thermograms of gels at 4 wt% with different thermal treatments; OM micrographs of gels at 4 wt% upon heating; and VT-FTIR spectra of gels between 1700 and 1500 cm−1. See DOI: https://doi.org/10.1039/d2sm01637k |
| This journal is © The Royal Society of Chemistry 2023 |


