 Open Access Article
Aerosol-assisted sol–gel synthesis of mesoporous Ag–Ta–SiO2 catalysts for the direct upgrading of ethanol to butadiene†
Denis D.
Dochain
a,
Antoine
Van Den Daelen
a,
Ales
Styskalik
b,
Vit
Vykoukal
b and
Damien P.
Debecker
 *a
*a
aInstitute of Condensed Matter and Nanosciences – Université Catholique de Louvain (UCLouvain), Place Louis Pasteur, 1, 1348 Louvain-la-Neuve, Belgium. E-mail: damien.debecker@uclouvain.be
bDepartment of Chemistry – Masaryk University, Kotlarska 2, CZ-61137, Brno, Czech Republic
First published on 20th March 2023
Abstract
The Lebedev process, or the direct catalytic conversion of bioethanol to butadiene, offers an up-and-coming sustainable alternative to the petrochemical route toward this high-demand C4 hydrocarbon. Since the reaction mechanism involves a cascade of dehydrogenation, hydrogen transfer and dehydration steps, a bifunctional catalyst combining both redox (for the dehydrogenation reaction) and acid (for hydrogen transfer and dehydration reactions) functionalities is required. Multi-step preparation methods are typically implemented to obtain tailored bifunctional catalysts, and one of the challenges is to balance the two functions to maximize the BD yield. Here, we disclose a straightforward, one-step, and continuous preparation method of Ta-doped SiO2 loaded with Ag nanoparticles by coupling sol–gel chemistry with aerosol processing. Combining tantalum ethoxide, silver nitrate, hydrolysed tetraethyl orthosilicate and pluronic F127 as templating agent in the aerosol process leads to mesoporous bifunctional catalysts featuring a specific surface area between 310–370 m2 g−1, a pore volume of ca. 0.5 mL g−1 and an average pore diameter of 5 nm. As attested by a variety of characterization techniques, the method leads to the homogeneous incorporation of highly dispersed tantalum species in the silica matrix, thereby creating the required acidic sites. These new catalysts have higher dehydration activity, as compared to the corresponding reference catalysts prepared by classical impregnation. Concomitantly, relatively small silver nanoparticles are stabilized (∼15 nm). The relative Ta and Ag loading can be tuned easily. In the ethanol to butadiene reaction, these aerosol-made catalysts achieve a butadiene yield of ca. 25% by optimizing the relative loadings of Ta and Ag, outcompeting the corresponding formulations prepared by impregnation.
Sustainability spotlightCurrent butadiene production relies primarily on naphtha steam cracking, a non-sustainable and energy consuming process.3 With the rise of shale gas, butadiene shortages and price increases are also expected.2 Effective and selective on-purpose butadiene production from sustainable bioethanol would mitigate our dependence towards fossil resources. To that end, we must develop new catalytic formulations that exhibit the right balance between dehydrogenation and dehydration activity. Stepping away from multi-step grafting/impregnation/hydrothermal preparation, we disclose a direct, continuous, low waste, low energy preparation method, based on reactive aerosol processing. Mesoporous Ag–Ta–SiO2 catalysts are readily obtained and feature advantageous texture, highly dispersed acidic TaOx species, and small Ag nanoparticles. Research on the ethanol-to-butadiene reaction aligns with https://sdgs.un.org/goals number 9, 12, 13. |
1. Introduction
The polymer industry is constantly evolving, facing numerous challenges in the current transition to a more sustainable society. The tire and nylon sectors depend heavily on 1,3-butadiene (BD) as a monomer.1 BD is traditionally obtained through the steam cracking of naphtha as a by-product of ethylene production; its market is currently under tension mainly due to the rising of shale gas.2 In fact, the weight ratio butadiene/ethylene sits at around 0.02 for ethane cracking, the main component of shale gas, compared to 0.13 for naphtha cracking.1 This difference could lead to a further unbalance in the BD market. Thus, alternative and more sustainable ways to produce BD are needed.Bio-based processes are currently considered as potential candidates to substitute the petroleum industry, in particular bioethanol valorisation.3–7 The production of bioethanol reached 120 billion litres in 2017 and is expected to rise above 130 billion litres by 2024.3 This important platform molecule has a wide array of applications,4,5 among which the catalytic upgrading to butadiene is attracting a lot of attention.3,8–14 Historically, Ostromislensky et al. proposed in 1915 a process to synthesize butadiene from a mixture of ethanol and acetaldehyde.15 During the 1930s, another industrial process developed by Lebedev emerged where butadiene is obtained directly from ethanol.16 The technology made it possible to produce synthetic rubber, notably during the Second World War. After the Second World War, petroleum-based processes took over,1 and research on the subject declined until the last 10–15 years. Nowadays, a blooming interest in bio-based processes for the substitution of the petroleum industry is observed.3–6 In this context, the Lebedev process is considered more interesting from an environmental and economic point of view compared to the Ostromislensky.3
For acid catalysts, the generally accepted reaction mechanism is the “Kagan mechanism”, consisting of a complex network of dehydrogenation, hydrogen transfer and dehydration steps (Scheme 1).17,18 To trigger the different types of reactions and obtain butadiene, a bifunctional catalyst featuring (i) redox sites for dehydrogenation and (ii) acid sites for hydrogen transfer and dehydration is needed. The aldol condensation of acetaldehyde to acetaldol has been generally described as the rate limiting step when considering mixed oxide catalysts from periodic group 4 and 5.19–25 This step is thought to be catalysed by so-called Lewis open sites, i.e. isolated atoms in a tetrahedral position connected to three Si–O– groups and one OH moiety.24,26 In addition, emphasis is often made on the MPV reduction step involving ethanol and crotonaldehyde to produce crotyl alcohol, although it is currently not recognized as the rate limiting step.23,27–29 But when considering MgO–SiO2 catalytic systems, the rate limiting step is believed to be the acetaldehyde formation, meaning that the type of active sites (acid or basic) determines the rate limiting step.11,13,30
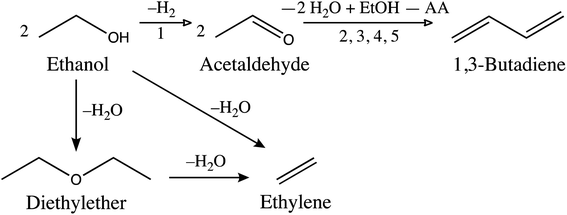 | ||
| Scheme 1 Direct conversion of ethanol to butadiene according to the Kagan mechanism for the Lebedev process,14 which occurs in 5 steps: (1) non-oxidative dehydrogenation of ethanol (EtOH) to acetaldehyde (AA); (2) condensation of two AA molecules into 3-hydroxybutanal (acetaldol); (3) acetaldol dehydration to crotonaldehyde; (4) production of crotyl alcohol and AA via a Meerwein–Ponndorf–Verley (MPV) reduction with ethanol; (5) dehydration of crotyl alcohol to butadiene.14,17 In parallel, acid-catalysed dehydration of ethanol to diethylether or ethylene is unwanted. | ||
In terms of catalysts formulations, acidic transition metal oxide-based catalysts such as Ta–SiO2 or Zr–SiO2 promoted with nanoparticles of Ag, Cu, Zn, Co or Fe have been extensively described in the literature.1,12,18,23,26,31,32 To solve the different limitations such as poor metal dispersion or lack of control on the active elements speciation – which tend to arise using classical synthesis methods such as impregnation – advanced synthesis protocols have been proposed to achieve better homogeneity and well dispersed metal nanoparticles.1,14,18,23 Ta-based zeolites, promoted with Ag, Cu or Zn are another class of effective catalysts.25,33–35 Here, diffusion limitations associated with the microporosity of zeolite-based catalysts are tackled by proposing mesoporous or hierarchically porous materials that facilitate mass transfer or provide larger external specific surface area.25,35
Arguably, sol–gel chemistry offers unique opportunities to tailor the properties of such bifunctional catalysts.36,37 Through these versatile techniques, molecular precursors undergo hydrolysis and inorganic polycondensation reactions to create a solid material. Playing with reactions conditions, nature of precursors, use of additives such as reactivity modifiers and sacrificial pore-generating agents, a large array of formulations can be achieved, with tuneable composition, surface chemistry, porosity, etc.36
In the so-called “aerosol-assisted sol–gel” process (AASG), a precursors solution is atomized in the form of air born droplets which are rapidly dried.38–41 During drying, the solvent evaporates, and molecular precursors undergo inorganic polycondensation reactions. The addition of templating agents in the precursors solution allows controlling the texture of the final material.36 This aerosol route was shown to give access to a variety of efficient (mixed) oxide catalysts with a high degree of control on homogeneity and texture.41–44 The method can also be used to prepare supported metal nanoparticles.45–47
This prompted us to explore the potential of AASG to obtain mesoporous Ta–SiO2 catalysts promoted with Ag nanoparticles and to assess their performance in the ETB reaction. The catalysts are compared to similar formulations obtained from commercial supports and via classical impregnation. We rationalize the catalytic performance by characterizing the texture, acidity, and active species dispersion.
2. Experimental
2.1 Catalyst preparation
2.2 Characterization
Textural properties (surface area, pore volume, pore size) were determined by nitrogen physisorption at 77.4 K on a Tristar 3000 instrument from Micromeritics, USA. Prior to measurement, samples were degassed at 150 °C for 8 h minimum. The specific surface area was determined by the BET method with at least five data points with relative pressure between 0.05 and 0.30.Silicon, tantalum and silver content were determined on an ICP optical emission spectrometer iCAP 6500 Duo from Thermo, UK equipped with a solid-state generator with a frequency of 27.12 MHz and a maximum power input of 1350 W.
X-ray photoelectron spectroscopy measurements were carried out on a SSI X probe spectrometer (model SSI 100, Surface Science Laboratories, Mountain View, CA) equipped with a monochromatized Al-Kα radiation (1486 eV). The catalyst powders previously pressed in small stainless troughs of 4 mm diameter, were placed on an insulating home-made ceramic carousel. The pressure in the analysis chamber was set at around 10−6 Pa. The analysed area was approximately 1.4 mm2 and the pass energy was set at 150 eV. The Si 2p peak of carbon has been fixed to 103.5 eV to set the binding energy scale.49 Data treatment was performed with the CasaXPS program (Casa Software Ltd, UK) and spectra were decomposed with the least squares fitting routine provided by the software with a Gaussian/Lorentzian (85/15) product function and after baseline subtraction.
Temperature programmed desorption of ammonia (NH3-TPD) was performed on a Hiden CATLAB-PCS microreactor connected to a mass spectrometer equipped with a quadrupole separator. Samples (400–800 μm particle size) were first dehydrated at 300 °C (10 °C min−1) for 1 h under Ar (40 ml min−1). Ammonia adsorption took place at 150 °C for 40 minutes (20 mL min−1 of Ar, 5% vol NH3) before a 80 minutes purge under Ar (40 mL min−1). The temperature was then increased to 600 °C (10 °C min−1) to desorb ammonia.
FTIR spectra (4000–400 cm−1, 256 scans, resolution 4 cm−1) were recorded on a Bruker Equinox 55 spectrometer (transmission mode, through KBr pellets).
FTIR spectra after pyridine adsorption were similarly recorded. Catalysts were pelleted and degassed overnight at 350 °C. Pyridine adsorption was carried out at room temperature. FTIR spectra were taken at room temperature and after 2 h degassing under vacuum at 150 °C.
A transmission electron microscope Thermo Fisher F200C equipped with a field emission gun source, a 4k CCD camera (FEI Eagle) and operated at 200 kV was used for sample visualization. STEM-EDS measurements were performed on a F200C Titan Themis instrument with a combination of a spherical aberration image (Cs) corrector, a monochromator system, sensitive ChemiSTEM technology, and a high-end GATAN GIF Quantum energy filter for EELS and EFTEM with a new enhanced piezo stage, FEI and GATAN software, and a FEI Ceta 4x4k CMOS camera.
2.3 Ethanol to butadiene reaction
Calcined catalysts (0.192 g, pressed and sieved in the 0.20–0.40 mm particle size range) were diluted with glass beads (0.5–1 mm) in order to keep the volume of the catalyst bed constant. The rest of the tubular reactor (stainless steel, 0.6 cm internal diameter) was filled with silica beads. Before reaction, the catalyst was pre-treated in situ by feeding hydrogen (30 vol% H2 in N2) for 1 h at 355 °C (silver reduction). Catalytic testing was carried out by feeding 0.212 g h−1 of absolute ethanol (fed with a NE-300 syringe pump) and 40 cm3 min−1 of nitrogen (4.4 mol% of ethanol in N2). The WHSV was 1.1 h−1 unless stated otherwise. The tests were carried out at atmospheric pressure and from 325 °C to 385 °C with steps of 30 °C. After a stabilization of 10 minutes at the set temperature, the gas effluent was analysed on a VARIAN 3800 Gas Chromatograph (5 injections at each temperature, 15 min runtime per injection) equipped with a flame ionization detector (FID) and a Restek Rt-U-Bond column (30 m long, internal diameter of 0.32 mm, film thickness of 10 μm).3. Results and discussion
3.1 Comparing impregnation with one-pot aerosol
Here we compare on the one side a catalyst prepared in one-pot using the AASG process and on the other side two reference catalysts prepared by impregnation (either on a commercial silica support (SiO2-A) or on an aerosol-made silica support (SiO2)). We first targeted formulations with 5 wt% Ta and 1 wt% Ag.ICP results in Table 1 are close to the nominal values aimed for the Si/Ta ratio (65–76 for bulk Ta obtained vs. 75 aimed, corresponding to 5 wt%). For Ag, we aimed at a Si/Ag ratio of 179 (corresponding to 1 wt%) and we generally obtained high values, indicating a lower amount of Ag. XPS results confirms that the impregnation process brings majority of active sites to the surface of the catalysts, as shown by lower Si/Ta and Si/Ag surface ratios relative to bulk ratios (Table 1).
| Sample | S BET (m2 g−1) | V p (mL g−1) | D p (nm) | Bulk Si/Tac | Bulk Si/Agc | Surface Si/Tad | Surface Si/Agd | Acid sitese (mmol g−1) |
|---|---|---|---|---|---|---|---|---|
| a Pore volume at P/P0 = 0.98. b Calculated as 4 Vp/SBET. c Determined by ICP. d Determined by XPS. e Determined by NH3-TPD. | ||||||||
| SiO2-A | 190 | 0.61 | 14.3 | — | — | — | — | — |
| 1Ag5Ta/SiO2-A | 140 | 0.57 | 16.2 | 77 | 214 | n.m. | n.m. | n.m. |
| SiO2 | 370 | 0.50 | 5.4 | — | — | — | — | — |
| 5Ta–SiO2 | 380 | 0.40 | 4.1 | n.m. | — | n.m. | — | — |
| 1Ag5Ta/SiO2 | 340 | 0.51 | 6.0 | 65 | 215 | 8.7 | 14.2 | 2.4 × 10⁻² |
| 1Ag/5Ta–SiO2 | 310 | 0.35 | 4.5 | 76 | 192 | 72.5 | 34.2 | 6.1 × 10⁻² |
| 1Ag5Ta–SiO2 | 370 | 0.47 | 5.0 | 71 | 222 | 62.5 | 57.0 | 4.1 × 10⁻² |
The commercial silica support (SiO2-A) and 1Ag5Ta/SiO2-A, textural properties are mainly macroporous, as shown by a type III isotherm in Fig. S1.† The pristine AASG-made silica is predominantly mesoporous (Fig. 1) with type IV isotherms presenting a well-defined hysteresis loop, specific surface area reaching 360 m2 g−1, large pore volume (0.61 cm3 g−1) and a narrow mesopore size distribution, centred around 9 nm (Fig. S2†). When incorporating Ta directly in the AASG process, the texture was not significantly affected. In the same way, the bifunctional catalyst prepared in one-pot through AASG (1Ag5Ta–SiO2) exhibited very similar isotherms and textural parameters.
The impregnation of Ag on the AASG-made 5Ta–SiO2 (1Ag/5Ta–SiO2) or the simultaneous impregnation of Ta and Ag on the AASG-made silica (1Ag5Ta/SiO2) only altered the textural properties of the catalysts in a minor way; while the SSA and pore volume tended to decrease marginally, the mesoporous structure of the material was maintained (Fig. 1 and Table 1). Similarly, the texture of the catalyst prepared by impregnation on the commercial silica support (1Ag5Ta/SiO2-A), was not strongly affected as compared to the support (slight decrease in specific surface area and pore volume, and minor increase in the average pore diameter (Fig. S3† and Table 1)).
In the ethanol-to-butadiene reaction, the bifunctional catalyst prepared by impregnation of Ta and Ag on the commercial silica (1Ag5Ta/SiO2-A) reaches ca. 45% of ethanol conversion with 16% in butadiene selectivity and 24% in dehydration by-products (ethylene + diethylether) and 42% of dehydrogenation product (acetaldehyde) (Table 2). The catalyst prepared by impregnation of Ta and Ag on AASG silica (1Ag5Ta/SiO2) is less active (23% conversion), also showing a high selectivity for acetaldehyde, together with a high selectivity for ethylene. The catalyst prepared by direct AASG process (1Ag5Ta–SiO2), reaches 80% ethanol conversion but with a low acetaldehyde selectivity and a very low BD selectivity (2%). This goes hand in hand with a high selectivity towards ethylene, as a result of the direct dehydration of ethanol, typically catalysed by acid sites.50–52 Characterisation of such acid sites is thus required to better understand the catalytic behaviour and optimize the AASG catalysts.
| Catalyst | Ethanol conversion (%) | Butadiene (%) | Acetaldehyde (%) | Ethylene (%) | Diethylether (%) | Others (%) | |||||
|---|---|---|---|---|---|---|---|---|---|---|---|
| Yield | Sel | Yield | Sel | Yield | Sel | Yield | Sel | Yield | Sel | ||
| 1Ag5Ta/SiO2-A | 43.5 | 6.9 | 15.9 | 20.1 | 46.2 | 3.6 | 8.4 | 7.0 | 16.0 | 5.9 | 13.6 |
| 1Ag5Ta/SiO2 | 22.6 | 2.3 | 10.3 | 9.4 | 41.7 | 9.5 | 42.2 | 0.01 | 3.1 | 0.01 | 2.7 |
| 1Ag5Ta–SiO2 | 80.6 | 1.8 | 2.2 | 13.9 | 17.2 | 46.3 | 57.4 | 3.3 | 4.1 | 15.3 | 19.0 |
3.2 Characterizing the peculiarities of aerosol made AgTa–SiO2 catalysts
With the intent to understand the catalytic behaviour of the new formulations prepared by aerosol, we here undertake a thorough characterization of the acidic and redox properties of the catalyst (and compare them to impregnated catalysts). We extend our investigations to various formulations containing 1, 2, 5, or 10 wt% of Ta and 1, 2, or 5 wt% of Ag.TEM analyses reveal the morphology of the silica-based microspheres formed through the aerosol process (Fig. 2). Spherical particles with a diameter ranging from 50 to 500 nm can be seen as well as the porosity created by the templating agent (∼5 nm), compared to the more chaotic structure observed for the commercial silica (Fig. S4a†). As expected, the elemental mapping presented in Fig. S5a† confirms that the impregnation method concentrates Ta and Ag species on the surface of the microspheres. In the AASG-made catalysts, STEM-EDS analysis shows well dispersed Ta throughout the silica spheres (Fig. 2b) as well as Ag nanoparticles of around 10–20 nm (Fig. 2c). Even after increasing the silver loading to 5 wt% (2Ag5Ta–SiO2), silver nanoparticles dispersion remains similar (Fig. S6†).
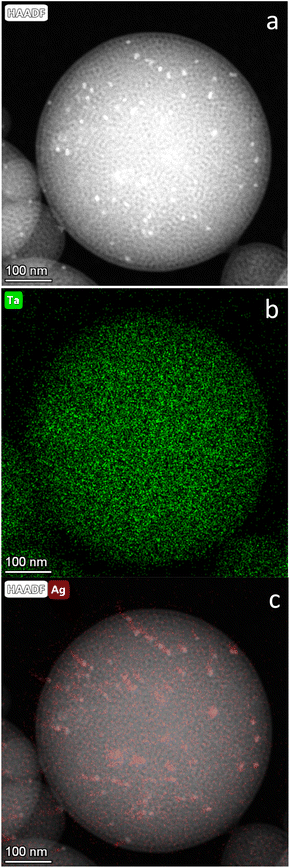 | ||
| Fig. 2 Electron microscopy analysis of 1Ag5Ta–SiO2: (a) STEM; (b) STEM-EDS of Ta; (c) STEM-EDS of Ag. | ||
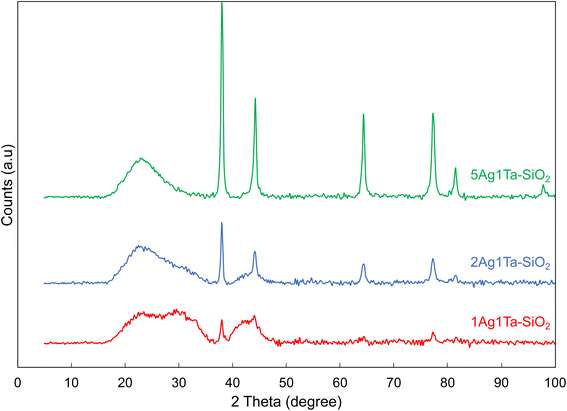
Consistently, XRD shows Ag nanoparticles of 15 ± 3 nm (Fig. 3). It should be noted that the uncalcined materials already contain some Ag nanoparticles of smaller size (∼8 nm, see Fig. S7†). Upon calcination, the silver ions and/or the small silver nanoparticles that are dispersed in the silica matrix sinter to stabilize in the form of ∼15 nm sized Ag crystallites. Importantly, the Ag crystallite size remains stable with increasing silver loadings (1, 2 and 5 wt%, see Fig. 3). Furthermore, the presence of tantalum does not influence the size of Ag nanoparticle; for example, by doubling the tantalum loading from 1 to 2 wt% coupled with 5 wt% Ag, the crystallite size remains constant at 15 ± 2 nm (Fig. S7†). Thus, a good dispersion of silver is maintained even at relatively high loadings.
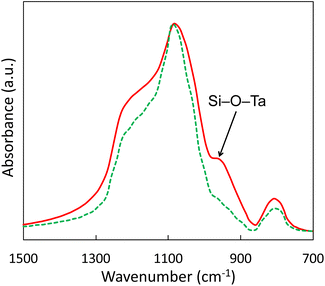
FTIR spectra were very similar for all catalysts, with the typical main absorption bands originating from the silica matrix (Fig. S7†).53–57 The band at 750–850 cm−1 was attributed to the symmetric vibration of Si–O–Si bonds whereas the most intense absorption band at 1050–1065 cm−1 was ascribed to the asymmetric stretching vibration of Si–O–Si. The distinct shoulder at 1170–1220 cm−1 was due to SiO4 and their external linkage. The two bands at 1580–1660 cm−1 and 3000–3700 cm−1 were respectively assigned to the bending of H–O–H bonds and the stretching of O–H bonds. Interestingly, catalysts with Ta incorporated through the aerosol process displayed an additional distinct band at 950 cm−1 (Fig. 4). This band corresponds to the Si–O–Ta stretching mode.58,59 It suggests that tantalum was effectively incorporated into the silica matrix through the AASG process. Furthermore, the intensity of the band can be correlated with the tantalum loading (Fig. S8†). As expected, this band is absent in the pristine silica. Strikingly, this band is not found in the impregnated catalysts (where TaOx is deposited on the silica surface rather than incorporated in the silica matrix). Thus, FTIR spectroscopy points to a very different environment for Ta, depending on the preparation mode. Here, NH3-TPD measurements (Table 1) complement FTIR by bringing to light higher acidity for samples with Ta incorporated through the aerosol process (e.g. +71% for 1Ag5Ta–SiO2, compared to 1Ag5Ta/SiO2, see Fig. S2† and Table 1).
Going further and looking at the identity of those acid sites, pyridine adsorption followed by FTIR measurements were also performed (Fig. S4†). These pointed to a higher concentration of Lewis acid sites in the catalyst made by aerosol compared to the impregnated one. This can be explained by a better insertion of Ta inside the silica matrix. Si–O–Ta bonds shown in IR are known to be more acidic than polymeric TaOx species. No significant Brondsted acidity was observed for both catalysts. We note that a more precise description of the acidic sites formed by the Ta–O–Si species in aerosol catalysts could usefully be obtained via dedicated CO-FTIR experiments.60,61
Altogether, these characterization results substantiate the benefits of the AASG method. Both FTIR and NH3-TPD point to the fact that homogeneously dispersed Ta within the silica matrices through AASG displays higher acidity compared to polymeric TaOx surface species, predominant in the impregnation process. However, the high acidity of AASG catalysts also leads to a high selectivity towards dehydration products (ethylene and diethylether) (Table 2). Very similar results were previously obtained via the non-hydrolytic sol–gel (NHSG) process.14,62 NHSG catalysts displayed higher acidity leading to higher production of ethylene. An important take away message is that AASG represents a reliable method to obtain highly dispersed Ta species in silica matrices. Concomitantly, the dispersion of Ag nanoparticles and the texture are maintained for the various compositions that have been explored.
3.3 Optimizing the catalyst composition to boost butadiene yield
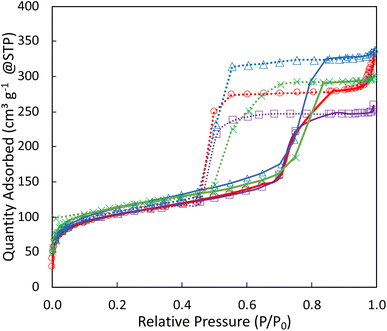
In an attempt to understand the influence of acid and redox sites on the butadiene yield and selectivity, and to ultimately mitigate the formation of unwanted by-products observed with 1Ag5Ta–SiO2, loadings of Ta and Ag have been modified (Table 3). Interestingly, the method allows tuning the composition without modifying the textural properties (Fig. 5 and Table S1†) or the active sites dispersion (Fig. S6†). Indeed, a similar mesoporous texture is obtained for all catalysts, even at high loading, with constant pore sizes (Fig. 5).| Catalyst | Ethanol conversion (%) | Butadiene (%) | Acetaldehyde (%) | Ethylene (%) | Diethylether (%) | Others (%) | |||||
|---|---|---|---|---|---|---|---|---|---|---|---|
| Yield | Sel | Yield | Sel | Yield | Sel | Yield | Sel | Yield | Sel | ||
| 1Ag5Ta/SiO2-A | 43.5 | 6.9 | 15.9 | 20.1 | 46.2 | 3.6 | 8.4 | 7.0 | 16.0 | 5.9 | 13.6 |
| 1Ag5Ta–SiO2 | 80.6 | 1.8 | 2.2 | 13.9 | 17.2 | 46.3 | 57.4 | 3.3 | 4.1 | 15.3 | 19.0 |
| 1Ag1Ta–SiO2 | 46.7 | 0.3 | 0.7 | 34.9 | 74.7 | 1.9 | 4.0 | 0.8 | 1.7 | 8.8 | 18.8 |
| 2Ag1Ta–SiO2 | 68.3 | 1.5 | 2.2 | 52.6 | 76.9 | 4.3 | 6.4 | 0.5 | 0.8 | 9.3 | 13.6 |
| 5Ag1Ta–SiO2 | 84.6 | 5.3 | 6.2 | 52.4 | 61.9 | 5.3 | 6.2 | 0.4 | 0.4 | 21.4 | 25.3 |
| 1Ag2Ta–SiO2 | 45.8 | 1.1 | 2.3 | 16.3 | 35.6 | 13.0 | 28.4 | 3.5 | 7.7 | 11.9 | 26.0 |
| 2Ag2Ta–SiO2 | 69.7 | 9.4 | 13.6 | 30.6 | 43.9 | 13.9 | 19.9 | 3.9 | 5.5 | 11.9 | 17.1 |
| 5Ag2Ta–SiO2 | 86.6 | 15.1 | 17.4 | 35.9 | 41.4 | 11.4 | 13.2 | 2.1 | 2.4 | 22.2 | 25.6 |
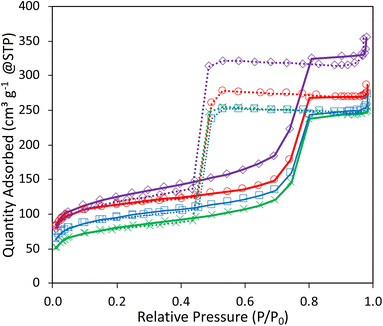 | ||
| Fig. 5 N2-physisorption isotherms of 1Ag1Ta–SiO2 (purple ◊), 1Ag2Ta–SiO2 (red ○), 2Ag2Ta–SiO2 (blue ■), 5Ag2Ta–SiO2 (green ×). | ||
By decreasing the tantalum loading (1Ag1Ta–SiO2), the overall ethanol conversion was lowered, together with the ethylene and diethylether selectivity. This confirms that Ta acid sites are responsible for the formation of these dehydration by-products. In conjunction to this, the dehydrogenation activity of the catalyst was increased, as shown by the significant increase in acetaldehyde selectivity, from 17 to 52%. Nevertheless, BD selectivity remained very low (<1%). By increasing the Ag loading to 2 and 5 wt%, BD selectivity increased only to ca. 6%. Still, the acetaldehyde yield reached 43%, a sign that the catalyst lacks the ability to effectively convert acetaldehyde to crotonaldehyde over the appropriate acid sites. To overcome this issue, the Ta loading was also increased (to 2 wt%). Combined with 1 wt% of Ag, acetaldehyde yield sat at 13.5% whereas dehydration by-products (ethene, x, y) reached a combined yield of ca. 15%, a sign that the catalyst demonstrates balanced dehydration and dehydrogenation activities. Yet, BD selectivity remained under 1%. With the increase of the Ag loading to 2 and 5 wt%, BD yields rose respectively to 9.4 and 15.1%. In parallel, selectivity towards dehydration by-products was gradually decreased. When considering the overall effect of the Ta loading, its increase systematically led to an increase in BD selectivity combined with a decrease in acetaldehyde selectivity. This is consistent with previous claims of the importance of the presence Ta–O–Si species to catalyse the aldol condensation step and confirms the importance of this step in the overall mechanism of the reaction. But in all tested catalysts, no traces of crotonaldehyde or crotyl alcohol were observed, further indicating that the MPV reduction and the final dehydration of crotyl alcohol to 1,3-butadiene are not limiting in the case of these acid catalysts. However, the accumulation of unconverted acetaldehyde can indicate a slower reaction rate for the aldol condensation.
Thus, we show that adapting the absolute and relative loadings of the redox and acidic functions in these bifunctional catalysts can be done easily via AASG and can be used to drive the process towards the desired product. Within the series of catalysts presented in Table 3, the formulation with 2 wt% Ta and 5 wt% Ag appears to present the most suitable balance between acid and redox sites, leading to a relatively high BD yield.
3.4 Pushing the butadiene production
With the best catalyst in hands (5Ag2Ta–SiO2), we attempt to boost the process by playing with operational parameters. In particular, temperature plays a role in both the overall ethanol conversion and the reaction products distribution (Table 4). The lower temperature of 325 °C gives the lowest ethanol conversion and tends to favor acetaldehyde, with a selectivity above 50%. When switching to higher temperatures, ethanol conversion increases to values above 80%, along with a higher selectivity towards dehydration by-products, 15% and 25% for 355 °C and 385 °C respectively. Thus, it means that the redox power of the catalyst is favored at lower temperatures (high acetaldehyde selectivity), whereas the dehydrating features are dominant at higher temperatures (high ethylene + diethylether selectivities). The optimum is found at 355 °C with the highest butadiene selectivity (ca. 18%) among the tested temperatures. At this temperature, a correct balance is achieved between the redox and acidic properties to efficiently obtain butadiene while maintaining dehydration by-products at a low level.| Catalyst | Ethanol conversion (%) | Butadiene (%) | Acetaldehyde (%) | Ethylene (%) | Diethylether (%) | Others (%) | |||||
|---|---|---|---|---|---|---|---|---|---|---|---|
| Yield | Sel | Yield | Sel | Yield | Sel | Yield | Sel | Yield | Sel | ||
| 5Ag2Ta–SiO2 325 °C | 68.6 | 8.5 | 12.3 | 36.6 | 53.4 | 6.8 | 9.9 | 3.6 | 5.3 | 13.1 | 19.1 |
| 5Ag2Ta–SiO2 355 °C | 86.6 | 15.1 | 17.4 | 35.9 | 41.4 | 11.4 | 13.2 | 2.1 | 2.4 | 22.2 | 25.6 |
| 5Ag2Ta–SiO2 385 °C | 84.1 | 9.0 | 10.7 | 28.6 | 34.0 | 3.6 | 8.4 | 7.0 | 16.0 | 5.9 | 13.6 |
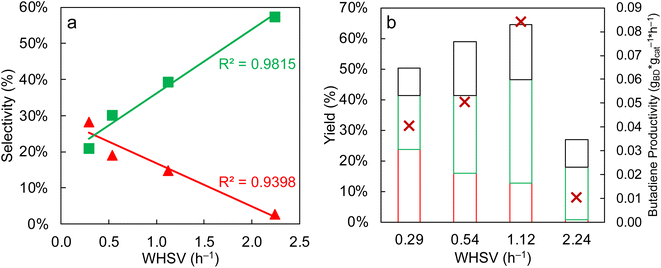
Secondly, the weight hourly space velocity (WHSV) is known to play a major role in the catalyst performance, since a network of inter-dependent reactions is involved.14 Here, a linear relationship between the WHSV and the butadiene selectivity was highlighted (Fig. 6a). Concomitantly, the acetaldehyde selectivity increased when the WHSV increases. When the WHSV is low, the contact time is increased, giving more possibility to the newly produced acetaldehyde to undergo the self-condensation to the acetaldol, which will be further dehydrated to crotonaldehyde and finally butadiene. As the aldol condensation is often recognized in the literature as the rate-limiting step in the ETB mechanism,20,21 increasing the odds of achieving it yields more butadiene. In contrast, when the WHSV is increased, the amount of unreacted acetaldehyde logically rises.
Fig. 6b shows the influence of the WHSV on the products distribution. At WHSV below 0.5 h−1, the most abundant product is butadiene, with a maximum yield of 24%. At WHSV of 1.12 h−1 and 2.24 h−1, ethylene and acetaldehyde are the most abundant products. Since ethylene is the result of a fast dehydration of ethanol on acid sites and acetaldehyde is the product of direct dehydrogenation of ethanol on redox sites, these two compounds are favored at lower contact time in comparison to BD.
In terms of productivity, 5Ag2Ta–SiO2 reaches 0.085 gBD gcat−1 h−1 at WHSV = 1.12 h−1. This is lower than the record performance reached with other catalytic systems, such as Zn–Zr based zeolites.63–65 However, higher ethanol conversion and similar butadiene yields are obtained with the best AASG-made catalyst, when comparing with other Ag/silica-based systems reported in the literature.23,66 It must be recalled that the AASG is a straightforward one step, low waste preparation method that compares favorably to classical multistep catalyst preparation processes.
4. Conclusions
The aerosol-assisted sol–gel method allows, in one step, highly homogeneous bifunctional AgTa–SiO2 catalysts with advantageous mesoporous texture (large pore volumes and relatively high specific surface area) to be obtained. Characterization data displays a high degree of insertion of dispersed Ta species in the silica matrices, resulting in an acidic catalyst producing markedly more dehydration by-products compared to impregnated tantalum oxide. With the addition of well dispersed Ag nanoparticles, we are able to obtain butadiene from ethanol. Upon optimization of the Ta and Ag loadings it is possible to temper the dehydration activity, while increasing the dehydrogenation activity and maintaining sufficient acidity to complete the cascade reactions towards butadiene. We show that playing with the reaction conditions (in particular reaction temperature and contact time) allows further boosting the butadiene yield.Conflicts of interest
There are no conflicts to declare.Acknowledgements
Denis D. Dochain is under FRIA-FNRS scholarship no. 35505359. Damien P. Debecker thanks the Francqui Foundation for the Francqui Research Professor chair. The CIISB research infrastructure project LM2015043 funded by the MEYS CR is gratefully acknowledged for the financial support of the measurements at the CEITEC MU CF Cryo-electron Microscopy and Tomography. The TEM part of this work was carried out with the support ofthe CEITEC Nano Research Infrastructure (ID LM2015041, MEYS CR, 2016–2019), CEITEC Brno University of Technology. Authors thank L. Simonikova for performing ICP-OES analyses. We acknowledge CEITEC MU CF Cryo-electron Microscopy and Tomography of CIISB, Instruct-CZ Centre, supported by MEYS CR (LM2018127). CzechNanoLab project LM2018110 funded by MEYS CR is gratefully acknowledged for the financial support of the measurements at CEITEC Nano Research Infrastructure. The work has been financially supported by the Czech Science Foundation under the project GJ20-03636Y. Dr François Devred is acknowledged for the technical and logistical support.References
- E. V. Makshina, M. Dusselier, W. Janssens, J. Degreve, P. A. Jacobs and B. F. Sels, Chem. Soc. Rev., 2014, 43, 7917–7953 RSC.
- A. Al-Douri, D. Sengupta and M. M. El-Halwagi, J. Nat. Gas Sci. Eng., 2017, 45, 436–455 CrossRef CAS.
- D. Cespi, F. Passarini, I. Vassura and F. Cavani, Green Chem., 2016, 18, 1625–1638 RSC.
- L. Chaudhary, P. Pradhan, N. Soni, P. Singh and A. Tiwari, Int. J. ChemTech Res., 2014, 6, 1381–1389 Search PubMed.
- R. Muktham, S. K. Bhargava, S. Bankupalli and A. S. Ball, J. Sustainable Bioenergy Syst., 2016, 06, 72–92 CrossRef CAS.
- R. Gérardy, R. Morodo, J. Estager, P. Luis, D. P. Debecker and J.-C. M. Monbaliu, Top. Curr. Chem., 2019, 377, 1 CrossRef PubMed.
- P. Gallezot, Chem. Soc. Rev., 2012, 41, 1538–1558 RSC.
- F. Dumeignil, M. Capron, B. Katryniok, R. Wojcieszak, A. Löfberg, J.-S. Girardon, S. Desset, M. Araque-Marin, L. Jalowiecki-Duhamel and S. Paul, J. Jpn. Pet. Inst., 2015, 58, 257–273 CrossRef CAS.
- J. Sun and Y. Wang, ACS Catal., 2014, 4, 1078–1090 CrossRef CAS.
- T.-W. Kim, J.-W. Kim, S.-Y. Kim, H.-J. Chae, J.-R. Kim, S.-Y. Jeong and C.-U. Kim, Chem. Eng. J., 2015, 278, 217–223 CrossRef CAS.
- E. V. Makshina, M. Dusselier, W. Janssens, J. Degrève, P. A. Jacobs and B. F. Sels, Chem. Soc. Rev., 2014, 43, 7917–7953 RSC.
- G. Pomalaza, M. Capron, V. Ordomsky, F. Dumeignil, G. Pomalaza, M. Capron, V. Ordomsky and F. Dumeignil, Catalysts, 2016, 6, 203 CrossRef.
- S. Shylesh, A. A. Gokhale, C. D. Scown, D. Kim, C. R. Ho and A. T. Bell, ChemSusChem, 2016, 9, 1462–1472 CrossRef CAS PubMed.
- D. D. Dochain, A. Stýskalík and D. P. Debecker, Catalysts, 2019, 9, 920 CrossRef CAS.
- I. Ostromislensky, Journal of Russian Physical and Chemical Society, 1915, 47, 1885 Search PubMed.
- A. Talalay and L. Talalay, Rubber Chem. Technol., 1942, 15, 403–429 CrossRef CAS.
- C. Angelici, F. Meirer, A. M. van der Eerden, H. L. Schaink, A. Goryachev, J. P. Hofmann, E. J. Hensen, B. M. Weckhuysen and P. C. Bruijnincx, ACS Catal., 2015, 5, 6005–6015 CrossRef CAS.
- G. Pomalaza, P. Arango, M. Capron and F. Y. Dumeignil, Catal. Sci. Technol., 2020, 10, 4860–4911 RSC.
- M. Gao, Z. Liu, M. Zhang and L. Tong, Catal. Lett., 2014, 144, 2071–2079 CrossRef CAS.
- S. Da Ros, M. D. Jones, D. Mattia, M. Schwaab, E. Barbosa-Coutinho, R. C. Rabelo-Neto, F. B. Noronha and J. C. Pinto, Chem. Eng. J., 2017, 308, 988–1000 CrossRef CAS.
- V. L. Sushkevich and I. I. Ivanova, Appl. Catal., B, 2017, 215, 36–49 CrossRef CAS.
- O. Larina, P. Kyriienko and S. Soloviev, Theor. Exp. Chem., 2016, 52, 51–56 CrossRef CAS.
- V. L. Sushkevich, I. I. Ivanova, V. V. Ordomsky and E. Taarning, ChemSusChem, 2014, 7, 2527–2536 CrossRef CAS PubMed.
- P. Müller, S. P. Burt, A. M. Love, W. P. McDermott, P. Wolf and I. Hermans, ACS Catal., 2016, 6, 6823–6832 CrossRef.
- P. I. Kyriienko, O. V. Larina, S. O. Soloviev, S. M. Orlyk and S. Dzwigaj, Catal. Commun., 2016, 77, 123–126 CrossRef CAS.
- V. L. Sushkevich, I. I. Ivanova and E. Taarning, Green Chem., 2015, 17, 2552–2559 RSC.
- W. E. Taifan, T. Bučko and J. Baltrusaitis, J. Catal., 2017, 346, 78–91 CrossRef CAS.
- M. Lewandowski, G. S. Babu, M. Vezzoli, M. D. Jones, R. E. Owen, D. Mattia, P. Plucinski, E. Mikolajska, A. Ochenduszko and D. C. Apperley, Catal. Commun., 2014, 49, 25–28 CrossRef CAS.
- T. De Baerdemaeker, M. Feyen, U. Müller, B. Yilmaz, F.-S. Xiao, W. Zhang, T. Yokoi, X. Bao, H. Gies and D. E. De Vos, ACS Catal., 2015, 5, 3393–3397 CrossRef CAS.
- Q. Zhu, B. Wang and T. Tan, ACS Sustainable Chem. Eng., 2017, 5, 722–733 CrossRef CAS.
- V. L. Sushkevich and I. I. Ivanova, ChemSusChem, 2016, 9, 2216–2225 CrossRef CAS PubMed.
- V. L. Sushkevich, I. I. Ivanova and E. Taarning, ChemCatChem, 2013, 5, 2367–2373 CrossRef CAS.
- B. B. Corson, H. E. Jones, C. E. Welling, J. A. Hinckley and E. E. Stahly, Ind. Eng. Chem., 1950, 42, 359–373 CrossRef CAS.
- P. I. Kyriienko, O. V. Larina, N. O. Popovych, S. O. Soloviev, Y. Millot and S. Dzwigaj, J. Mol. Catal. A: Chem., 2016, 424, 27–36 CrossRef CAS.
- P. I. Kyriienko, O. V. Larina, S. O. Soloviev, S. M. Orlyk, C. Calers and S. Dzwigaj, ACS Sustainable Chem. Eng., 2017, 5, 2075–2083 CrossRef CAS.
- D. P. Debecker, Chem. Rec., 2018, 18, 662–675 CrossRef CAS PubMed.
- J. Livage, Catal. Today, 1998, 41, 3–19 CrossRef CAS.
- V. Smeets, C. Boissière, C. Sanchez, E. M. Gaigneaux, E. Peeters, B. F. Sels, M. Dusselier and D. P. Debecker, Chem. Mater., 2019, 31, 1610–1619 CrossRef CAS.
- A. B. D. Nandiyanto and K. Okuyama, Adv. Powder Technol., 2011, 22, 1–19 CrossRef CAS.
- D. P. Debecker, S. Le Bras, C. Boissière, A. Chaumonnot and C. Sanchez, Chem. Soc. Rev., 2018, 47, 4112–4155 RSC.
- D. P. Debecker, M. Stoyanova, F. Colbeau-Justin, U. Rodemerck, C. Boissière, E. M. Gaigneaux and C. Sanchez, Angew. Chem., Int. Ed., 2012, 51, 2129–2131 CrossRef CAS PubMed.
- S. Maksasithorn, P. Praserthdam, K. Suriye and D. P. Debecker, Microporous Mesoporous Mater., 2015, 213, 125–133 CrossRef CAS.
- S. Pega, C. Boissière, D. Grosso, T. Azaïs, A. Chaumonnot and C. Sanchez, Angew. Chem., Int. Ed., 2009, 48, 2784–2787 CrossRef CAS PubMed.
- A. Vivian, L. Fusaro, D. P. Debecker and C. Aprile, ACS Sustainable Chem. Eng., 2018, 6, 14095–14103 CrossRef CAS.
- C. Paris, A. Karelovic, R. Manrique, S. Le Bras, F. Devred, V. Vykoukal, A. Styskalik, P. Eloy and D. P. Debecker, ChemSusChem, 2020, 13, 6409–6417 CAS.
- L. Kuai, J. Wang, T. Ming, C. Fang, Z. Sun, B. Geng and J. Wang, Sci. Rep., 2015, 5, 992 Search PubMed.
- J. E. Hampsey, S. Arsenault, Q. Hu and Y. Lu, Chem. Mater., 2005, 17, 2475–2480 CrossRef CAS.
- F. E. Tuler, E. M. Gaigneaux, E. E. Miró, V. G. Milt and D. P. Debecker, Catal. Commun., 2015, 72, 116–120 CrossRef CAS.
- M. Jacquemin, M. J. Genet, E. M. Gaigneaux and D. P. Debecker, ChemPhysChem, 2013, 14, 3618–3626 CrossRef CAS PubMed.
- A. Styskalik, I. Kordoghli, C. Poleunis, A. Delcorte, C. Aprile, L. Fusaro and D. P. Debecker, Microporous Mesoporous Mater., 2020, 110028 CrossRef.
- D. P. Debecker, C. Boissière, G. Laurent, S. Huet, P. Eliaers, C. Sanchez and R. Backov, Chem. Commun., 2015, 51, 14018–14021 RSC.
- T. K. Phung and G. Busca, Catal. Commun., 2015, 68, 110–115 CrossRef CAS.
- A. Beganskienė, V. Sirutkaitis, M. Kurtinaitienė, R. Juškėnas and A. Kareiva, Mater. Sci., 2004, 10, 287–290 Search PubMed.
- A. J. Majewski, J. Wood and W. Bujalski, Int. J. Hydrogen Energy, 2013, 38, 14531–14541 CrossRef CAS.
- X.-D. Wang, Z.-X. Shen, T. Sang, X.-B. Cheng, M.-F. Li, L.-Y. Chen and Z.-S. Wang, J. Colloid Interface Sci., 2010, 341, 23–29 CrossRef CAS PubMed.
- L. Singh, S. Agarwal, S. Bhattacharyya, U. Sharma and S. Ahalawat, Nanomater. Nanotechnol., 2011, 1, 9 CrossRef.
- T. Lehmann, T. Wolff, C. Hamel, P. Veit, B. Garke and A. Seidel-Morgenstern, Microporous Mesoporous Mater., 2012, 151, 113–125 CrossRef CAS.
- D. Blanc, W. Zhang, C. Massard and J. Mugnier, Opt. Mater., 2006, 28, 331–335 CrossRef CAS.
- Y. S. Ko and W. S. Ahn, Microporous Mesoporous Mater., 1999, 30, 283–291 CrossRef CAS.
- V. L. Sushkevich, D. Palagin and I. I. Ivanova, ACS Catal., 2015, 5, 4833–4836 CrossRef CAS.
- X. Li, J. Pang, C. Wang, L. Li, X. Pan, M. Zheng and T. Zhang, Green Chem., 2020, 22, 2852–2861 RSC.
- D. Hradsky, P. Machac, D. Skoda, L. Leonova, P. Sazama, J. Pastvova, D. Kauchy, D. Vsiansky, Z. Moravec and A. Styskalik, ChemRxiv, 2022 DOI:10.26434/chemrxiv-2022-n5xkb.
- P. I. Kyriienko, O. V. Larina, D. Y. Balakin, S. O. Soloviev and S. M. Orlyk, Catal. Lett., 2021, 1–10 Search PubMed.
- G. Pomalaza, G. Vofo, M. Capron and F. Dumeignil, Green Chem., 2018, 20, 3203–3209 RSC.
- C.-I. Ahn, C. Kim, J. W. Bae, J. Jeon, H. S. Jung, Y.-B. Kim, S. Lee, J. Lee and K.-S. Ha, Fuel Process. Technol., 2020, 200, 106317 CrossRef CAS.
- W. Janssens, E. V. Makshina, P. Vanelderen, F. De Clippel, K. Houthoofd, S. Kerkhofs, J. A. Martens, P. A. Jacobs and B. F. Sels, ChemSusChem, 2015, 8, 994–1008 CrossRef CAS PubMed.
Footnote |
| † Electronic supplementary information (ESI) available. See DOI: https://doi.org/10.1039/d2su00080f |
| This journal is © The Royal Society of Chemistry 2023 |

