 Open Access Article
Creative Commons Attribution 3.0 Unported Licence
Understanding the electrocatalytic oxidation of propionic acid for the sustainable production of ethylene†
Andrea
Angulo
 ,
Carolina
Elizarraras
,
Ju Hee
Shin
,
Alexandra
van Riel
,
Toshihiro
Akashige
and
Miguel
Modestino
,
Carolina
Elizarraras
,
Ju Hee
Shin
,
Alexandra
van Riel
,
Toshihiro
Akashige
and
Miguel
Modestino
 *
*
Department of Chemical and Biomolecular Engineering, Tandon School of Engineering, New York University, 6 Metrotech Ct, Brooklyn, NY 11201, USA. E-mail: modestino@nyu.edu
First published on 20th October 2023
Abstract
The need for the chemical industry to transition to renewable energy sources to achieve industrial decarbonization has propelled the study of alternative production pathways for important chemicals. Thermochemical ethylene production is one of the most significant contributors to greenhouse gas emissions. In this paper, we explore the electrochemical oxidation of propionic acid, a component of aqueous waste from a hydrothermal liquefaction process, as an alternative pathway for ethylene production. We investigate the effect of initial substrate concentration, operating current density, and electrolyte pH on faradaic efficiency towards ethylene and other reaction products. Our results show that a faradaic efficiency of >50% towards ethylene production can be achieved for initial substrate concentrations above 2 M, with an increase in initial concentration leading to an increase in faradaic efficiency towards ethylene. We also demonstrate how the distribution of organic products remained unaffected within the range of current density evaluated (20–95 mA cm−2). Finally, our results show how operating at electrolyte pH above the pKa of propionic acid favors the oxidation of propionic acid over the parasitic oxygen evolution reaction. This study provides valuable insights into the effect of electrolyte composition and electrochemical conditions on the electrocatalytic oxidation of propionic acid and its competition with oxygen evolution in aqueous electrolytes.
Sustainability spotlightEthylene, one of the most important building blocks of the chemical industry, is currently manufactured from fossil feedstocks, and its production accounts for approximately 10% of the industry's total energy consumption, contributing to over 150 million metric tons of CO2 emissions. In this study, we explore an alternative electrochemical production method for ethylene, which sources its feedstock, propionic acid, from sustainable biomass waste streams. Furthermore, powering this process directly with renewable electricity would result in substantial emission reductions in one of the most carbon-intensive processes in the chemical industry. The results presented in this work provide fundamental design guidelines for electrolytes and electrochemical reactor operation strategies that lead to high ethylene selectivity and production rates, approaching performance metrics relevant to practical implementation. The deployment of this electrochemical process in the chemical industry would help support the UN Sustainable Development Goals number 12 by promoting sustainable production of chemicals, and number 13 by reducing the carbon intensity of ethylene manufacturing and helping to combat climate change. |
Introduction
The chemical industry contributes to 7% of the world's greenhouse gas (GHG) emissions arising primarily from the use of fossil fuel combustion to power chemical processes.1,2 To achieve industrial decarbonization, the industry needs to transition to renewable energy sources and integrate them with chemical manufacturing processes. Amongst the chemicals with the highest decarbonization potential, ethylene stands out as the product with the highest global annual production volume (>150 MMT per year).3 Nearly all of it is produced via steam cracking, which is an energy-intensive process that involves injecting ethane or naphtha with hot steam into a reactor and heating it to 850–950 °C to cleave and transform C–H and C–C bonds.4–6 Conversion yields are limited to 40–50% since multiple competing reactions produce a wide range of products, which must be separated via cryogenic distillation.7,8 Ethylene production alone is responsible for 126 MMT of CO2 emissions per year.8,9Several alternative production pathways for ethylene production have been studied, including plasma catalytic conversion of methane to ethylene,10,11 low temperature electrolysis of carbon dioxide to ethylene,12,13 solid oxide electrolysis,14 ethanol dehydration,15,16 and more recently, the electrochemical oxidation of aqueous waste from a hydrothermal liquefaction (HTL) process after stream via non-Kolbe electrolysis.17–21
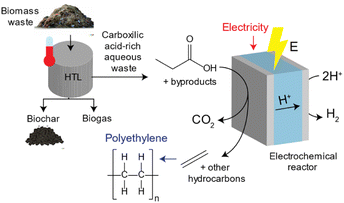
HTL processes can transform biomass waste into biogas, hydrochar and an aqueous waste stream rich in carboxylic acids.22–24 Approximately ∼5–25% of the carbon content in biomass waste remains in the carboxylic acid-rich aqueous waste stream which can be upgraded into high value chemical products upon pre-treatment.25,26 An illustration of this process is shown in Fig. 1. Lopez-Ruiz and coauthors studied the electrochemical valorization of a HTL waste stream into H2 and hydrocarbons. They studied the electrocatalytic oxidation of individual carboxylic acids into alcohols, olefins and paraffins via (non-)Kolbe electrolysis, and demonstrated conversion of propionic acid (PA) into ethylene with a faradaic efficiency (FE) of ∼24%. In another study, Pichler et al. investigated the electrochemical oxidation of succinic acid derived from food waste to generate ethylene, utilizing a range of carbon-based catalysts. They achieved faradaic efficiencies of up to 27.5% using a graphite catalyst. Furthermore, the authors conducted a comparative analysis with the electrochemical oxidation of propionic acid to produce ethylene, yielding results of comparable magnitude.27
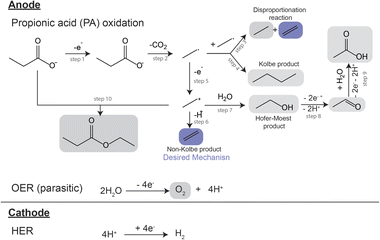
A proposed reaction mechanism for the electrocatalytic conversion of PA to ethylene is presented in Scheme 1. The reaction starts by the electrochemical oxidation of deprotonated PA molecules, leading to a single electron transfer event (Scheme 1, step 1) and the formation of a carboxyl radical. This radical then undergoes decarboxylation, yielding a CO2 molecule and an alkyl radical (Scheme 1, step 2). The alkyl radical can react with another alkyl radical through a disproportionation reaction, forming one molecule of ethylene and one molecule of ethane (Scheme 1, step 3), or through a radical coupling reaction forming butane, often referred as the Kolbe product (Scheme 1, step 4). Alternatively, the alkyl radical can suffer a second single electron transfer forming an ethyl cation (Scheme 1, step 5). The cation can lose a proton via β-H-elimination, forming the non-Kolbe product, ethylene (Scheme 1, step 6) or it can react with a water molecule forming ethanol, the Hoefer–Moest product (Scheme 1, step 7). Ethanol can further oxidize at the anode into acetaldehyde and subsequently into acetic acid (Scheme 1, steps 8 and 9). Finally, the ethyl cation can also react with the deprotonated form of PA, yielding ethyl propanoate (Scheme 1, step 10).17,19,28 The ester can also be obtained via the esterification reaction of ethanol and PA.28,29 Additionally, if using aqueous electrolytes, oxygen evolution also takes place at the anode as a parasitic reaction.17,19 The reaction mechanism of the electrocatalytic oxidation of PA as well as its competition with oxygen evolution in aqueous electrolyte have found to be strongly influenced by the concentration of the reactant and intermediates in the microenvironment near the electrode surface.19,28 This local environment is influenced by initial substrate concentration, electrolyte pH, current density and potential, the nature of the catalyst and additional electrolyte components. Building in the previous demonstration of the production of ethylene from biomass HTL waste,17 here we developed a systematic study where we further explored the effects of electrolyte composition and electrochemical environment on the electrocatalytic oxidation of PA for ethylene production. Our study was performed using a batch reactor with an anodic and cathodic chamber divided by a Nafion® membrane to avoid organic reactions at the cathode, and used Pt electrodes as they have been proven to be suitable for ethylene production from PA.17 We investigated the effects of initial substrate concentration, operational current density, and initial electrolyte pH on the ethylene production, and identified a set of conditions that yielded faradaic efficiency towards ethylene of >50%.
Results and discussions
Effect of initial substrate concentration
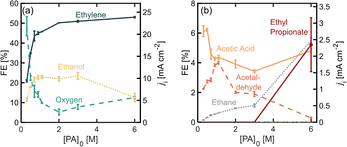
To study the effect of initial PA concentration on FE towards ethylene, we prepared solution of different PA concentrations, ranging from 0.3 M up to 6.0 M and in each case adjusting the initial pH to 7.0 ± 0.2 and maintaining the operating current density at 45 mA cm−2. All these solutions were prepared maintaining a 0.5 M concentration of Na3PO4 as buffering supporting electrolyte. It is important to point out that under the present operation conditions, the half-cell potential is maintained above the oxidation potential of Pt, which is 1.5 V vs. RHE, and several stable oxide layers are expected to form on the electrode.30Fig. 2 shows the distribution of the products detected, as well as their production rates in terms of partial current density. Among the major products, we find ethylene, oxygen, and ethanol (Fig. 2a), and acetic acid, acetaldehyde and ethane are detected in smaller quantities (Fig. 2b). As the initial substrate concentration [PA]0 increases, the oxygen evolution reaction (OER) becomes inhibited while the faradaic efficiency for the organic products increases, which can be attributed to an increase in concentration of the deprotonated acid [PA−] near the electrode surface and a local decrease in the concentration of water, which favors the production of organic products. Our results also show that within the organic products, the FE towards ethylene, increases when [PA]0 is increased from 0.3 M to 2.0 M, reaching values of up to 51% which plateau at higher concentrations. For this reason, the experiments in the following sections were carried out with [PA]0 of 2.0 M. Beyond ethylene, the most abundant organic product is ethanol, which is produced through the Hofer–Moest reaction (Scheme 1, step 7), when [PA]0 increases from 0.3 M to 1.1 M, ethanol formation is promoted at the same rate than ethylene and other organic products, from 10% to 23%, due to the higher concentration of organic molecules near the electrode. Beyond 1.1 M, the FE towards ethanol starts to decrease again, from 23% to 12%, as the [PA]0 is further increased to up to 6 M which, which can be attributed to a decrease in water molecules near the electrode surface (the bulk water concentration decreasing from 51 M at [PA]0 of 1.1 to 31 M at a [PA]0 of 6 M), reducing the electrode coverage by hydroxyl ions inhibiting the Hofer–Moest reaction. Additionally, the negatively charged propionate ions are likely to increase their concentration in the electrical double layer (EDL) and displace water at the electrode/electrolyte interface.When [PA]0 is increased to 6 M the FE of ethane increases from 1.1% to 5.6% (Fig. 2b), which means that at higher initial substrate concentrations, the single-electron reaction of disproportionation is being favored. A higher bulk concentration of the substrate will occupy a larger amount of adsorption sites on the electrode surface over the hydroxyl ions, and it will proportionally increase reaction rates of the disproportionation reaction.31 This result suggests that although the total amount of ethylene produced at [PA]0 6 M is approximately the same as for 2 and 3 M, about 5% of ethylene can be attributed to the disproportionation reaction mechanism and not to the non-Kolbe reaction alone. Under the highest substrate concentrations evaluated, 6 M, the ester product, ethyl propionate, was detected for the first time, with a FE of around 5%. This can also be attributed to an increase in [PA−] in the electrolyte which also increases the probability of this molecule to combine with an ethyl cation in the bulk, favoring the formation of the ester product.
Notably, the Kolbe product, butane, was not detected under the conditions evaluated so far. This can be attributed to two factors. First, the Kolbe dimerization has been reported to be favored at much higher current densities, within a range of 250 to 1000 mA cm−2.18,19,31,32 A higher current density and therefore, electrode potential, will increase the electrode surface coverage of the organic radicals, and the rate of dimerization is proportional to the concentration of the alkyl radical per unit area of the electrode surface. Secondly, it has also been demonstrated that the shorter the chain of the carboxylic acid, the higher the yield towards the two electron reactions (non-Kolbe and Hoefer–Moest product) over the single-electron reaction (Kolbe dimerization and disproportionation) which might be due to the relatively lower stabilities of the alkyl radical in shorter chains.32,33 Even at high concentrations of the substrate, these two factors prevent the formation of butane. It remains unclear why the disproportionation reaction is observed and the dimerization reaction is not. This could be explained by differences in the reaction kinetics of both pathways or the nature of the reactions (whether they are either of heterogeneous or homogeneous nature).
Effect of operating current density
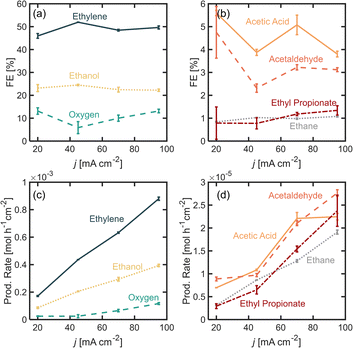
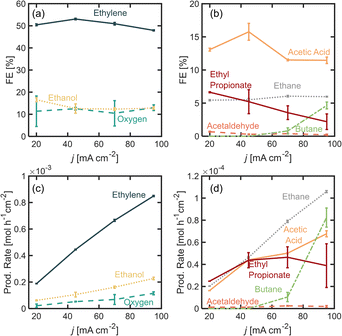
In this section, we explore the effects of operating current density in the distribution of products. Current density was varied from j = 20 to 95 mA cm−2. Current density affects surface potential and the rate at which reactants are consumed electrochemically, and depending on the reaction kinetics, can affect the product distribution. Previous studies have shown that current densities below 100 mA cm−2 favor the formation of non-Kolbe products vs. Kolbe products, as higher currents increase the electrode surface coverage by the alkyl radical promoting the single-electron reactions.17 For the experiments presented in this section, the electrolyte pH was kept at 7.0 ± 0.2 and [PA]0 at 2 M. Fig. 3a and b show the FE for all of the major and minor products detected. In Fig. 3a, it can be observed that as current density increases beyond 20 mA cm−2, the ethylene FE is maintained at ∼50% and the ethanol FE at ∼21%. In contrast, the oxygen FE increases with current density for values >45 mA cm−2, which is likely due to the depletion of PA− molecules near the electrode surface at higher reaction rates which enhances the local water concentration leading to higher OER rates. As for the rest of the organic products (Fig. 2b), FE of acetic acid, acetaldehyde, ethyl propionate and acetaldehyde does not change significantly with current density (<1%) which implies that the organic reaction is not sensitive to the operating current density within the range evaluated. It can also be noted that by keeping [PA]0 at 2 M, butane production remained inhibited and ethane production remained negligible, for the same reasons discussed in the previous section. For all the current densities studied, the anode potentials were measured to be within 2.6 and 4.4 V vs. RHE, which is consistent with the literature17,31–33 (see ESI†). Interestingly, within the range of current densities evaluated, the half-cell potential appeared to slightly decrease with increasing current between 20 and 45 mA cm−2, which can be attributed to an increase in the electrolyte temperature at higher current density due to the increased ohmic losses and leading to a reduction of reaction overpotentials.Overall operating current density affects not only the distribution of products but also the net production rates of each species, which is an important measure of reactor performance. Fig. 3c and d show production rates for each species. An increase in current density, while not affecting the FE of ethylene significantly, linearly increases its production rate. Notably, the production rate for ethylene increases at a higher rate than the production rate for oxygen. These results suggest that it might be beneficial to operate at higher current densities to maximize ethylene production, even if the distribution of products is not affected significantly. Under the conditions evaluated in this study, we demonstrated that it is possible to achieve ethylene production rates of up to 8.8 × 10⁻⁴ mol h−1 cm−2 or 0.59 kg per day per cm2.
Given the results shown on Fig. 2 where we observed important changes in product distribution at [PA]0 6 M, we were interested in exploring the effect of operating at a higher current density with this initial substrate concentration. These results are presented in Fig. 4, where we found that for values of j > 45 mA cm−2 the Kolbe reaction starts to take place, resulting in a FE for butane of ∼5%. Under these conditions, both the initial substrate concentration and the increase in current density improve the electrode surface coverage of the alkyl radical, and this coverage has been found to be proportional to the reaction rate of the dimerization. These observations are consistent with those observed in previous studies,17 and suggest that the faster production rates for ethyl radical production can promote their coupling and increase the production rate of butane. In contrast, the ethane FE, which is produced via a radical–radical disproportionation reaction, does not vary significantly which again has to do with the difference in the reaction kinetics of each pathway. It is also notable that the FE for ethylene decreases by 5% when the current is increased from 45 to 90 mA cm−2, which is roughly the same amount in which the FE for butane is increasing, and since two electrons are required to form one molecule of ethylene and one molecule of butane, it can be concluded that the Kolbe reaction is now capturing those electrons that were previously destined for the non-Kolbe reaction. Nonetheless, while FE for ethylene decreases by 5% when current density is increased from 45 to 95 mA cm−2, its production rate increased from 4.4 × 10⁻⁴ mol h−1 cm−2 to 8.5 mol h−1 cm−2.
Effect of electrolyte pH
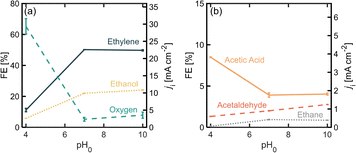
The pH of the electrolyte determines the equilibrium between PA and PA− at the electrode interfaces which affects the relative rates towards each reaction pathway.19 Operating with a pH above the pKa of the acid is expected to favor the organic reaction, which for PA has a value of 4.87.34 Moreover, slightly basic pH values have been observed to favor the formation of the carbocation through the second electron transfer in (non-)Kolbe reactions.19Fig. 5 shows product distribution in terms of FE for different electrolyte pHs. Starting with an initial pH of 4 (where most of the PA molecules are protonated), it is noticeable that the OER is favored over the organic reactions, but once the pH is increased to 7 and 10, the distribution toward the organic products, and to ethylene in particular, greatly improves. It is important to consider that since we were using a batch reactor, the pH decreased over time due to the increase in H+ given by the proposed β-H elimination of the ethyl cation (Scheme 1, step 6), the oxidation of ethanol and acetaldehyde (Scheme 1, steps 8 and 9) and/or the OER. At the end of the 50 min experimental runs, pH values were 2.9, 6.0 and 6.5 for initial pH values of 4, 7 and 10 respectively. This decrease of pH in time will shift the equilibrium of [PA] vs. [PA−] towards the non-deprotonated acid promoting oxygen evolution causing for the production rates of the organic products to decrease over time. Using flow reactors where the electrolyte is constantly being replenished can provide an opportunity to operate at steady pH values and potentially improve ethylene production rates.Conclusions
This study investigated the effect PA concentration, operating current density and electrolyte pH on FE towards ethylene and other organic byproducts. Our results show that as the initial substrate concentration increased from 0.3 M to 2 M, the ethylene FE increased from 20% to 51%, while FE towards oxygen decreases from 48.9% to 8.0%. However, when the initial substrate concentration was increased to 6 M, the distribution of organic products changed significantly with an increase in ethane, butane and ethyl propionate FEs. The overall operating current density was found to have no significant effect in ethylene FE, resulting in a monotonic increase in ethylene production rates with current density. At a higher current density of 95 mA cm−2 with a 6 M initial PA concentration, our results demonstrated that the product distribution changed substantially, resulting in an increased FE towards ethane and butane, and an inhibited production of ethyl propionate. The pH of the electrolyte was proven to have a significant impact on the product distribution, favoring the organic reaction over OER when initial pH was higher than the pKa of PA. In summary, this study provides general guidelines for electrolyte formulation and electrochemical conditions that control the electrocatalytic oxidation of PA to ethylene, improving the performance of this alternative production route for one of the most important building blocks of the chemical industry. The insights presented in our study can help to achieve green chemistry advances in the production of ethylene by providing a path for bio-derived plastic precursors that valorizes a waste stream from HTL of biomass, and by potentially integrating renewable electricity into chemical production. Achieving these advances would require future research aimed at overcoming technological barriers to achieve high ethylene selectivity and production rates at lower overpotentials and identifying alternative earth-abundant catalysts that are stable under PA electrocatalytic oxidation conditions.Experimental methods
Materials
All chemicals were purchased from Sigma Aldrich, including propionic acid (≥99.5%), sodium phosphate, sodium hydroxide (≥97%), formic acid (98–100%), ethanol (≥99.5%), ethyl propionate (99%), acetic acid (99.7%) and sulfuric acid (95–97%). A standard gas hydrocarbon mixture containing 1% butane (99.99%), 1% ethylene (99.99%), 1% ethane (99.99%), 1% propane (99.99%), 1% propylene (99.95%), 1% CO2 (99.999%) and 1% CO (99.99%) in nitrogen (99.999%) was purchased from Advance Specialty Gases for gas chromatography calibration. Platinum foil (99.95% metal basis) of thickness 0.125–0.135 mm used for the anode was also purchased from Sigma Aldrich, and Platinum gauze (99.95% metal basis) used as the cathode was purchased from VWR.The anolyte consisted of 0.5 M electrolyte solution with propionic acid added before every experiment in sufficient quantities to achieve the desired concentration (0.3–6 M), after which sodium hydroxide or phosphoric acid was added for pH adjustment to a desired value (4, 7 or 10). A total concentration of phosphate ions (including PO43−, HPO42−, H2PO4−) at 0.5 M. The catholyte consisted of a 1 M solution of sulfuric acid. Nafion 117 purchased from the Fuel Cell Store was used to separate the cathodic and anodic chambers.
Electrochemical characterization
A three-electrode setup was used to study the effect of initial substrate concentration [PA]0, current density j and initial pH. The electrodes consisted of a piece of Pt foil of dimensions 1.5 cm × 1.5 cm for the anode, Pt mesh of dimensions 2 cm × 2 cm as the cathode and a Ag/AgCl reference electrode. Electrochemical Impedance Spectroscopy (EIS) and Chronopotentiometry (CP) experiments were performed using a BioLogic VSP-300 potentiostat equipped with a ±1 A/±48 V booster. CP were carried out by setting the desired current and the time duration was set as to maintain the total charge transferred constant along the different current densities evaluated. The durations were 116, 52, 34 and 25 min for j = 20, 45, 70, 95 mA cm−2 respectively. EIS was used to characterize the resistance of the cell and correct the electrode potential for iR losses.Reactor setup
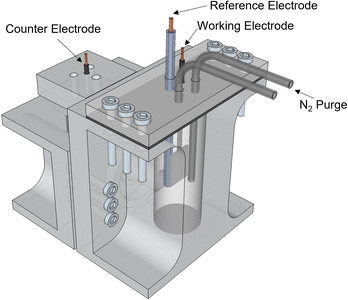
All experiments were performed in an H-cell fabricated using a Stratasys® Objet30 3D printer, and with VeroClear resin as printing material (Fig. 6). The cathode and anode sides were separated by a Nafion 117 membrane. The anode side was sealed to the atmosphere and equipped with a nitrogen purge to aid in the collection of gas products. Nitrogen was flowed at a rate of 10 sccm into the reactor. For the experiments in the Effect of Current Density section, since operating at higher current densities caused the temperature in the electrolyte to increase as a cause of ohmic heating, a cold trap was incorporated downstream the nitrogen and gas products to condense any evaporated products. Gas products were collected using a Tedlar sample bag.Product analysis
The gas products were identified and quantified by gas chromatography using an Agilent 990 Micro GC equipped with a MolSieve 5A column (channel 1) and a PoraPLOT Q column (channel 2). Acquisition parameters for channel 1 were: injection temperature 110 °C, injection time 80 ms, column temperature 80 °C, carrier gas He, run time 300 s. Acquisition parameters for channel 2 were injection temperature 110 °C, injection time 200 ms, column temperature 70 °C, carrier gas He, run time 300 s. A standard gas mixture containing CO2, ethylene, ethane, butane and other hydrocarbons was used as a reference. The liquid products were analyzed via H1NMR using a Bruker AV4-500 nuclear magnetic resonance (NMR) spectrometer with a delay time of 10 s, 16 scans per measurement and without solvent suppression. The samples consisted of 90% anolyte and 10% D2O. Sodium formate was added to all NMR samples as a standard reference at a final concentration of 0.3 M for product quantification. For the case of acetic acid quantification, an adjustment was made to the peak area measured during H-NMR due to the presence of what appeared to be acetic acid contamination of the PA purchased. Details on this adjustment is included in the ESI.†Faradaic efficiency calculations
Once the final amount of each product was determined, the FE was calculated for each j species as:were nj is the number of moles of species i, F is Faraday's constant, zi is the number of electrons transferred in the formation of a molecule of the species i, and Q is the total charge transferred.
Author contributions
The manuscript was written through the contributions of all authors. All authors have approved the final version of the manuscript. A. A., C. E., J. H. S. and A. v. R. performed the electrochemical experiments. T. A. designed the electrochemical reactor. M. M. conceptualized this work.Conflicts of interest
MAM is a co-founder and has a financial interest in Sunthetics, Inc., a start-up company in the chemical process optimization space.Acknowledgements
The authors acknowledge the financial support provided by the National Science Foundation (Grant # CBET-1943972) and the Centre for Decarbonizing Chemical Manufacturing Using Electrification (DC-MUSE), formed with the help of a generous grant from the Sloan Foundation (Grant # 201-16807).References
- A. Kätelhön, R. Meys, S. Deutz, S. Suh and A. Bardow, Proc. Natl. Acad. Sci. U. S. A., 2019, 116, 11187–11194 CrossRef PubMed.
- Greenhouse Gas Emissions from Large Facilities, 2021, https://ghgdata.epa.gov/, accessed 05/01/2023 Search PubMed.
- Y. Gao, L. Neal, D. Ding, W. Wu, C. Baroi, A. M. Gaffney and F. Li, ACS Catal., 2019, 9, 8592–8621 CrossRef CAS.
- M. S. Shokrollahi Yancheshmeh, S. Seifzadeh Haghighi, M. R. Gholipour, O. Dehghani, M. R. Rahimpour and S. Raeissi, Chem. Eng. J., 2013, 215–216, 550–560 CrossRef CAS.
- M. Yang and F. You, Ind. Eng. Chem. Res., 2017, 56, 4038–4051 CrossRef CAS.
- B. Yuan, Y. Zhang, W. Du, M. Wang and F. Qian, Appl. Energy, 2019, 254, 113583 CrossRef CAS.
- T. Ren, M. Patel and K. Blok, European Conference on Energy Efficiency, 2004 Search PubMed.
- T. Ren, M. Patel and K. Blok, Energy, 2006, 31, 425–451 CrossRef CAS.
- D. E. Blanco and M. A. Modestino, Trends Chem., 2019, 1, 8–10 CrossRef CAS.
- M. Scapinello, E. Delikonstantis and G. D. Stefanidis, Chem. Eng. Process., 2017, 117, 120–140 CrossRef CAS.
- E. Delikonstantis, M. Scapinello and G. D. Stefanidis, Fuel Process. Technol., 2018, 176, 33–42 CrossRef CAS.
- K. Ogura, J. CO2 Util., 2013, 1, 43–49 CrossRef CAS.
- F. P. G. d. Arquer, C.-T. Dinh, A. Ozden, J. Wicks, C. McCallum, A. R. Kirmani, D.-H. Nam, C. Gabardo, A. Seifitokaldani, X. Wang, Y. C. Li, F. Li, J. Edwards, L. J. Richter, S. J. Thorpe, D. Sinton and E. H. Sargent, Science, 2020, 367, 661–666 CrossRef PubMed.
- V. Patel, L. Battrell, R. Anderson, N. Zhu and L. Zhang, Int. J. Hydrogen Energy, 2019, 44, 18340–18350 CrossRef CAS.
- M. Zhang and Y. Yu, Ind. Eng. Chem. Res., 2013, 52, 9505–9514 CrossRef CAS.
- D. Fan, D.-J. Dai and H.-S. Wu, Materials, 2012, 6, 101–115 CrossRef PubMed.
- J. A. Lopez-Ruiz, Y. Qiu, E. Andrews, O. Y. Gutiérrez and J. D. Holladay, J. Appl. Electrochem., 2021, 51, 107–118 CrossRef CAS.
- P. Levy, J. Sanderson and L. Cheng, J. Electrochem. Soc., 1984, 131, 773 CrossRef CAS.
- F. J. Holzhäuser, J. B. Mensah and R. Palkovits, Green Chem., 2020, 22, 286–301 RSC.
- G. Amarante Guimarães Pereira, J. Rincones Perez, M. Falsarella Carazzolle, A. L. Ribeiro de Castro Morschbacker, L. Roza and M. H. dos Santos Andrade, US Pat., 20130203953A1, 2013 Search PubMed.
- S. Palkovits and R. Palkovits, Chem. Ing. Tech., 2019, 91, 699–706 CrossRef CAS.
- S. Ciuta, D. Tsiamis and M. J. Castaldi, Gasification of waste materials: technologies for generating energy, gas, and chemicals from municipal solid waste, biomass, nonrecycled plastics, sludges, and wet solid wastes, Academic Press, 2017 Search PubMed.
- S. A. Akhade, N. Singh, O. Y. Gutiérrez, J. Lopez-Ruiz, H. Wang, J. D. Holladay, Y. Liu, A. Karkamkar, R. S. Weber, A. B. Padmaperuma, M.-S. Lee, G. A. Whyatt, M. Elliott, J. E. Holladay, J. L. Male, J. A. Lercher, R. Rousseau and V.-A. Glezakou, Chem. Rev., 2020, 120, 11370–11419 CrossRef CAS PubMed.
- P. Biller, R. B. Madsen, M. Klemmer, J. Becker, B. B. Iversen and M. Glasius, Bioresour. Technol., 2016, 220, 190–199 CrossRef CAS PubMed.
- M. Sevilla and A. B. Fuertes, Carbon, 2009, 47, 2281–2289 CrossRef CAS.
- G. K. Parshetti, S. K. Hoekman and R. Balasubramanian, Bioresour. Technol., 2013, 135, 683–689 CrossRef CAS PubMed.
- C. M. Pichler, S. Bhattacharjee, E. Lam, L. Su, A. Collauto, M. M. Roessler, S. J. Cobb, V. M. Badiani, M. Rahaman and E. Reisner, ACS Catal., 2022, 12, 13360–13371 CrossRef CAS PubMed.
- R. Mathison, A. L. Ramos Figueroa, C. Bloomquist and M. A. Modestino, Annu. Rev. Chem. Biomol. Eng., 2023, 14(1), 85–108 CrossRef PubMed.
- Y. Qiu, J. A. Lopez-Ruiz, G. Zhu, M. H. Engelhard, O. Y. Gutiérrez and J. D. Holladay, Appl. Catal., B, 2022, 305, 121060 CrossRef CAS.
- S. Liu, N. Govindarajan, H. Prats and K. Chan, Chem Catal., 2022, 2, 1100–1113 CrossRef CAS.
- H. Tanaka, M. Kurobishi and T. Sigeru, in Organic Electrochemistry: Revised and Expanded, ed. O. Hammerich and B. Speiser, CRC Press, Boca Raton, Florida, 5th edn, 2015 Search PubMed.
- J. Grimshaw, in Electrochemical Reactions and Mechanisms in Organic Chemistry, ed. J. Grimshaw, Elsevier Science B.V., Amsterdam, 2000, pp. 300–329, DOI:10.1016/B978-044472007-8/50009-4.
- L. Lang, Y. Li, J. C.-H. Lam, Y. Ding, X. Yin and C. Wu, Sustainable Energy Fuels, 2022, 6, 2797–2804 RSC.
- PubChem Compound Summary for CID 1032, Propionic Acid, https://pubchem.ncbi.nlm.nih.gov/compound/1032#section=Canonical-SMILES) Search PubMed.
Footnote |
| † Electronic supplementary information (ESI) available. See DOI: https://doi.org/10.1039/d3su00347g |
| This journal is © The Royal Society of Chemistry 2023 |

