Facilitating reversible transition metal migration and expediting ion diffusivity via oxygen vacancies for high performance O3-type sodium layered oxide cathodes†
Chenhan
Lin
,
Xiangcong
Meng
,
Min
Liang
,
Wenya
Li
,
Jinji
Liang
,
Tengfei
Liu
,
Xi
Ke
 ,
Jun
Liu
,
Zhicong
Shi
and
Liying
Liu
,
Jun
Liu
,
Zhicong
Shi
and
Liying
Liu
 *
*
School of Materials and Energy, Guangzhou Key Laboratory of Low-Dimensional Materials and Energy Storage Devices, Guangdong University of Technology, Guangzhou, 510006, China. E-mail: liyingliusy@gdut.edu.cn
First published on 14th November 2022
Abstract
Currently, O3-type layered sodium transition metal oxides (NaxTMO2, TM = transition metal) are the most competitive cathodes for sodium-ion batteries (SIBs). However, affected by the scourge of irreversible TM migration when more than 0.5 mol Na+ is deintercalated, the practical capacities of this class of cathodes fall short of their theoretical values and the cyclabilities in the high-voltage range are significantly deteriorated. To mitigate the above issues, NaCrO2, one of the typical O3-type layered oxides, has been investigated as a model system and the oxygen vacancy strategy instead of the commonly used chemical substitution is audaciously proposed in this study. The oxygen vacancy-modified NaCrO2−x cathode exhibits an extended reversible discharge capacity of 134.5 mA h g−1 corresponding to ∼0.7 mol Na+ de/intercalation and excellent capacity retention after 400 cycles. The mechanistic link between oxygen vacancies and stable high-voltage operation (charged up to 3.8 V) via reversible TM migration is expounded through a combined X-ray diffraction, electron diffraction and electrochemistry study. In addition, preeminent rate capability benefiting from the oxygen vacancy-expedited ion diffusivity has also been demonstrated. Furthermore, the as-constructed pouch cell model that paired with a Na metal anode exhibits high capacity and cycling endurance as well, guaranteeing the practical applicability. Our finding provides a novel view of structural design in O3-type layered oxide cathodes for SIBs and will provoke more in-depth thoughts on the usage of oxygen vacancies in other sodium cathodes.
1. Introduction
Over the past three decades, lithium-ion batteries (LIBs) have indisputably been the dominating technology applied in portable electronic devices and successfully infiltrated into the market of plug-in hybrid electric vehicles (PHEVs) and electric vehicles (EVs).1 However, owing to the anticipated depletion and the uneven geographic distribution of Li and Co (the two most important metal elements for LIBs) resources, the explosive market requirement of rechargeable batteries has raised considerable concerns on the economic sustainability of LIBs.2 With this backdrop, scientific and industrial societies are beginning to gravitate toward SIBs, especially those equipped with advanced cobalt-free cathodes, considering their high cost-effectiveness enabled by the natural abundance and extensive distribution of Na resources.3–5Based on the fact that the intercalation chemistry of sodium bears a resemblance to that of lithium, one of the most universal design strategies toward suitable cathodes for SIBs is to develop sodium analogues from commercial cathodes for LIBs. Hence, layered Na-intercalated transition metal oxide (NaxTMO2) cathodes, the sodium counterparts of prevalent layered LixTMO2 cathodes, have received much attention as compelling alternatives, which are expected to provide excellent electrochemical performance by virtue of their stable solid-state intercalation reactions and large two-dimensional alkali-ion diffusion paths.6–8 Following the notation defined by Delmas,9 layered NaxTMO2 materials are classified into two families including the trigonal prismatic (P-type) and octahedral (O-type) ones. But scanning the current research status, O3-type NaxTMO2 has undoubtedly gained more interests, since it possesses sufficient sodium reservoirs with a large theoretical capacity of ∼250 mA h g−1 and high initial coulombic efficiency (CE) that satisfies the criteria of commercialization.3 Unfortunately, such sodium layered cathodes in most cases are subject to the instability of the layered structure at a high state of charge. The available capacity barely remains ∼120 mA h g−1 under a limited operation voltage window, corresponding to a reversible de/intercalation of ∼0.5 Na per formula unit, which hardly reaches parity with the delivered capacity of lithium based equivalents and thereby explains the lack of commercial batteries based on these chemistries.10,11 A consensus has been reached that the inaccessible capacity, when the Na extraction exceeds the limit (approximately 0.5 Na per formula unit in most cases), primarily arises from the collapse of the layered structure correlated to the irreversible high valence TM (≥3+) migration into the alkali metal layer. This adverse TM migration is prone to concurrently shrink the interlayer spacing and trigger the layered-to-spinel or rock-salt transformation, leading to a greatly reduced degree of Na+ diffusion and finally inducing the degradation cascade of cell performance.10–12
Aside from controlling the cut-off voltage, the most common strategy for mitigating such pernicious effects is chemical substitution on the TM sites.13–15 Numerous previous studies have demonstrated that introducing dopants to tune the electronic transfer and structural characteristics indeed denotes creditable efficaciousness for stabilizing the structure at high states of charge and realizing high-capacity batteries. But at the same time, the high precision of synthetic conditions and the high price of the doped elements (such as Ti and Mg) are worrisome, which have been identified as the decisive bottleneck issues for their sustainable practice and production.16,17 In this context, it is high time to seek other tactics to redeem the inaccessible capacity of deeply charged NaxTMO2. Recently, the reports on Li-rich Mn-based cathodes and Ni-rich cathodes for LIBs that are meticulously designed with oxygen vacancies have provided outstanding prospects for the attainment of high-voltage stability.17–19 The related studies indicate that the oxygen vacancies pre-formed on the surface have triple functions for stable high-voltage operation: (1) facilitate reversible TM cation migration in the bulk phase for inhibiting infaust phase transformation; (2) produce a pinning effect for riveting the dislocation motion and buffering the further structure deformation; (3) improve the electron/ion conductivity for ensuring sufficient electrons on high capacity of LIB cathodes.20–23 Nonetheless, only a handful of reports shed light on the effect of oxygen vacancies in NaxTMO2 cathodes for SIBs and the relevant interplay between oxygen vacancies and stable high-voltage operation is still in an infant stage.24
Within this scope, O3-type layered NaCrO2 is chosen as the model system in the present work, which is known to reflect strong effect of irreversible TM migration when charged above 3.6 V. Mere half of its theoretical capacity (∼250 mA h g−1) can be achieved, corresponding to less than 0.5 mol Na+ reversibly inserted into the layered structure.25,26 To tackle this issue, we innovatively adopt a hydrogen reduction method assisted by spray-drying to in situ construct adequate oxygen vacancies into host materials with no need for harsh chemical conditions or extra multi-step reactions (Fig. 1a). The introduced spray-drying method plays a role in removing the crystal-water in raw materials for better preparation of pure samples and optimization of cell performance.27,28 According to former research,29 the hydrogen reduction can be described as Na2CrO4 + 3/2H2 = NaCrO2 + NaOH + H2O, where NaOH functions as an oxygen vacancy-generating agent.30 As predicted, oxygen vacancy-enriched NaCrO2−x (hereafter denoted as OV-NCO) with intact structural integrity is successfully synthesized and the existence of oxygen vacancies is accurately detected by a series of advanced physical and chemical characterization. For comparison, NaCrO2 material is also synthesized by a reported solid-state reaction and is denoted as S-NCO.26 After tested in SIBs, the electrochemical performance of OV-NCO mainly exhibits the following two features: reversible cycle within an increased operating voltage window to 3.8 V (a maximum discharge capacity of 134.5 mA h g−1 at 1C) and optimized rate capability at room and elevated temperatures. What's more, through leveraging ex situ X-ray diffraction (ex situ XRD) and ex situ X-ray photoelectron spectroscopy (ex situ XPS) techniques on the target material OV-NCO, we identify a genuinely innovative mechanism of oxygen vacancies assisted reversible TM migration for regulating the phase transition, which brings benefits to the stable charge–discharge cycling of NaCrO2 at high operating voltage (3.8 V). Such a new mechanism is probably suitable for other O3-type Na-based layered oxides deeply afflicted by high-voltage degradation. Here and now, a plausible fire-new pathway to design high-capacity and high-power Na intercalation cathodes for SIBs is exploited.
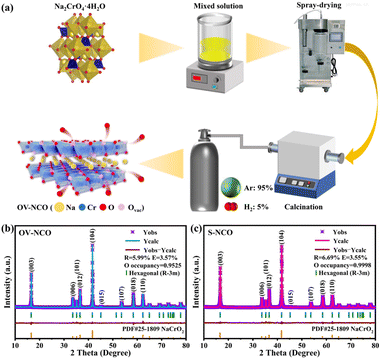 | ||
| Fig. 1 (a) Schematic illustration of the preparation process of OV-NCO. The XRD patterns and corresponding Rietveld refinement results of (b) OV-NCO and (c) S-NCO. | ||
2. Results and discussion
2.1. Structural analysis
The refined powder X-ray diffraction (XRD) patterns of the prepared OV-NCO and S-NCO samples are shown in Fig. 1b and c. All diffraction peaks in the cases of OV-NCO and S-NCO can be well indexed to the hexagonal layered structure with a space group R![[3 with combining macron]](https://www.rsc.org/images/entities/char_0033_0304.gif) m (166) in accordance with PDF card no. 25-1809, affirming that no other unwanted phases or contamination exist in the two samples. Of note is that the diffraction peaks of the OV-NCO sample slightly offset toward a lower angle compared with those of S-NCO, which reflects the localized increases of lattice spacing on account of the introduced oxygen vacancies.31 The successful incorporation of oxygen vacancies, meanwhile, is clearly validated by the decreased oxygen occupancies of OV-NCO, which are pronouncedly reduced to 0.9525 compared to 0.9998 of S-NCO. In addition, the c/a ratio of OV-NCO, greater than 5.3, manifests its good retainment of the orderly arranged layered structure even after the generation of oxygen vacancies (Tables S1 and S2†).18 Furthermore, the molar ratios between Na and Cr of the two samples measured by inductively coupled plasma-atomic emission spectroscopy (ICP-OES) are both close to 1
m (166) in accordance with PDF card no. 25-1809, affirming that no other unwanted phases or contamination exist in the two samples. Of note is that the diffraction peaks of the OV-NCO sample slightly offset toward a lower angle compared with those of S-NCO, which reflects the localized increases of lattice spacing on account of the introduced oxygen vacancies.31 The successful incorporation of oxygen vacancies, meanwhile, is clearly validated by the decreased oxygen occupancies of OV-NCO, which are pronouncedly reduced to 0.9525 compared to 0.9998 of S-NCO. In addition, the c/a ratio of OV-NCO, greater than 5.3, manifests its good retainment of the orderly arranged layered structure even after the generation of oxygen vacancies (Tables S1 and S2†).18 Furthermore, the molar ratios between Na and Cr of the two samples measured by inductively coupled plasma-atomic emission spectroscopy (ICP-OES) are both close to 1![[thin space (1/6-em)]](https://www.rsc.org/images/entities/char_2009.gif) :
:![[thin space (1/6-em)]](https://www.rsc.org/images/entities/char_2009.gif) 1 as expected, confirming the designed compositions (Table S3†).
1 as expected, confirming the designed compositions (Table S3†).
To recognize the influence of oxygen vacancies on the morphology and surface chemistry, scanning electron microscopy (SEM) combined with energy-dispersive spectroscopy (EDS) elemental mapping is employed on both samples (Fig. S2 and S3†). From SEM images and inset particle size distribution curves, it can be seen that both samples are made up of irregular particles with a similar size range (Fig. S2a and S3a†). To zoom in, there are a number of small nanoparticles (<500 nm) surrounding the microparticles due to the heterogeneous solid-state reaction (Fig. S2b and S3b†). But remarkably, more notches are apparently developed on the surface of OV-NCO, which could serve as a fingerprint for the formation of oxygen vacancies.32 The EDS mapping images show that Na, Cr, and O elements are evenly scattered in both samples, suggesting that the uniformly generated oxygen vacancies do not affect the elemental distribution (Fig. S2c and S3c†).
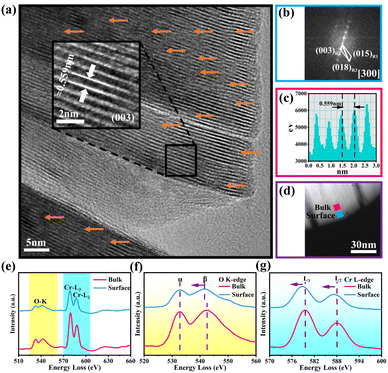
Fig. 2a discloses the high-resolution transmission electron microscopy (HRTEM) image of OV-NCO. A distinct lattice stripe with an interlayer spacing of 0.559 nm corresponding to the (003) crystal plane can be clearly observed. Notably, OV-NCO contains a certain number of distorted lattice fringes caused by the extraction of oxygen atoms, as indicated by orange arrows. The corresponding Fast Fourier Transformation (FFT) pattern in Fig. 2b, matching with the [300] zone axis from the crystal structure of the hexagonal system, exhibits a well-crystallized single-crystal nature. In the meantime, electron energy-loss spectroscopy (EELS) is applied to explore the preferred locations of oxygen vacancies and the electronic states of the transition metal. The selected regions of spatially resolved EELS spectra are marked with blue (near the surface) and pink (near the bulk) squares in the high-angle annular dark-field scanning transmission electron microscopy (HAADF-STEM) image of OV-NCO (Fig. 2d). The extracted EELS profiles in Fig. 2e show that the O K-edges and Cr L3,2-edges are located at ∼530 eV and ∼580 eV, respectively. The magnified O K-edges in Fig. 2f encompass two main peaks. The pre-edge peaks (labeled α) are related to the transition of electrons from the O 1s orbital to the unoccupied 2p orbital that are hybridized with the TM ions. The other peaks (labeled β) stem from the transition of electrons from the O 1s state to the hybridized O 2p and metal 4s and 4p states.33 From the surface region, the weakened intensity of peak α and the narrower gap between the peaks of α and β are indicative of the aggregation of oxygen vacancies.34 Accordingly, the valence of TM (Cr) near the surface is proverbially reduced to compensate for the change in charge. Through comparing the fine structures of Cr-L2,3 edges in Fig. 2g, two distinguishing features have been analyzed to authenticate the lowered valence of Cr on the surface. In the surface region, (1) the Cr-L2,3 edges are shifted to lower energies with a reduced oxidation state and (2) the peak height of the L3 edge relative to that of the L2 edge increases with a reduced valence.35
Electron paramagnetic resonance (EPR) analysis is also a well-known straightforward means to identify and characterize the oxygen vacancies by providing the finger printing information of unpaired electrons trapped at oxygen vacancies.36 Therefore, EPR test is adopted and the resulting mass-normalized spectrum shows that OV-NCO possesses a typical oxygen vacancy signal at g = 1.997 (Fig. 3a). Given that the intrinsic defects are unavoidably generated during heat treatment, this resonance is visible in S-NCO as well but with lower intensity.37,38 In the meantime, X-ray photoelectron spectroscopy (XPS) spectra are collected to support the EELS and EPR analyses and probe the component elements. The survey spectra of the two powders in Fig. 3b are nearly same, revealing the presence of Na, Cr and O elements. The high-resolution Cr 2p XPS spectra of OV-NCO and S-NCO in Fig. 3c present one doublet of Cr 2p3/2 and Cr 2p1/2 peaks. After the deconvolution of each core level into distinct peaks, the peaks for S-NCO centered at 574.8 eV, 575.5 eV, 576.1 eV, 577.4 eV, 585.3 eV and 586.7 eV are attributed to Cr3+.39 In contrast, except the predominant Cr3+ contribution, a new peak appears at 575.1 eV as shown by the brown line in the fitting analysis of Cr 2p for OV-NCO, which means the reduction of Cr3+ regarding the strong reducibility of NaOH and the charge compensation due to oxygen vacancies.19,35,40–42 As for the O 1s region for S-NCO in Fig. 3d, the splitted peaks located at 529.0 eV, 531.7 eV and 533.6 eV correspond to lattice oxygen, oxygen vacancies (Ovac) and chemisorbed oxygen, respectively. Comparatively, excluding the peak assigned to Na KLL Auger (located at 535.4 eV), the O 1s peaks of OV-NCO reveal a diminished percentage of lattice oxygen and chemisorbed oxygen, and a prevailing contribution of Ovac (52% compared with the 44% for S-NCO). Up to this point, it can be concluded that the proposed hydrogen reduction method successfully realizes the in situ creation of rich oxygen vacancies in the NaCrO2 cathode material. The abundant oxygen vacancies and low chemisorbed oxygen are beneficial for Na+ diffusion and conducive to improving the electrochemical reactivity and kinetics.18,38,43
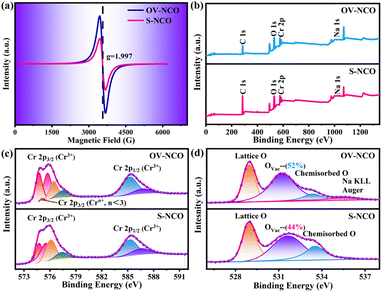 | ||
| Fig. 3 (a) EPR spectra of OV-NCO and S-NCO. (b) Comparative XPS survey spectra and high-resolution spectra of (c) Cr 2p, and (d) O 1s for OV-NCO and S-NCO. | ||
2.2. Electrochemical properties and mechanisms
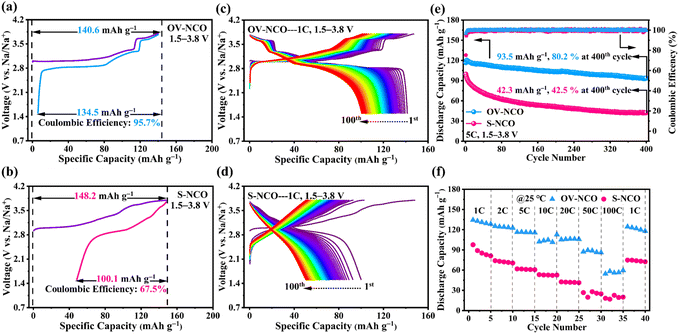
The electrochemical performance of OV-NCO and S-NCO is comprehensively evaluated using CR2023 coin cells with metallic Na as the counter electrode. Fig. 4a and b present the first desodiation/sodiation profiles of OV-NCO and S-NCO at a current rate of 1C (1C = 175 mA g−1) within the voltage window of 1.5–3.8 V. As shown in Fig. 4a and b, OV-NCO delivers an initial discharge capacity of 134.5 mA h g−1, corresponding to an initial CE of 95.7%; that for S-NCO decreases to 100.1 mA h g−1 with a low initial CE of 67.5%. The representative differential capacity vs. voltage (dQ/dV) curves of both samples are manifested in Fig. S4† to explain the increased CE of OV-NCO. In a similar manner, both samples comprise a pair of broad, intense peaks related to the Cr3+/Cr4+ redox in the lower potential range of 2.82–3.05 V (colored shading). But it is noteworthy that the irreversible cathodic peak around 3.8 V in S-NCO is absent in OV-NCO and the peaks and shape of OV-NCO are more distinct and stable than those of S-NCO. These two discrepancies imply that the prejudicious layered-to-rock-salt structural transformation in the high-voltage region (>3.6 V) is mitigated in OV-NCO and sodium can more readily transport into the bulk of the cathode during discharging.11,19 Additionally, the discharged dQ/dV plots for OV-NCO exhibit a higher overlap, highlighting the great reversibility of the redox reactions toward stable electrochemical performance after introducing oxygen vacancies (Fig. S4c†). In contrast, S-NCO evinces sluggish Na+ diffusion dynamics reflected by the left-shift peak position and substantially reduced peak intensity of its Cr4+ reduction peak (Fig. S4d†).To elucidate the effect of oxygen vacancies on the cycling stability, the cells are tested at 1C and 2C. The comparison of the cycling performance in Fig. S5† reveals that OV-NCO exhibits better stability at 1C for 100 cycles, with a higher capacity retention of 76.2% than that of 50.5% for S-NCO. Also, compared to S-NCO, the features of the long-term charge–discharge profiles of OV-NCO have no significant variation over repeated (de)sodiation, substantiating the resilient structural integrity of OV-NCO by modifying its surface chemistry via oxygen vacancies (Fig. 4c and d). At 2C, more pronounced cyclic stability improvement of OV-NCO by almost 32% capacity retention is observed after 150 fully charge–discharge cycles (Fig. S6a†). The corresponding median discharge voltage (MPV) decay profiles in Fig. S6b† show that the OV-NCO electrode has a lower attenuation value of 0.59 mV per cycle (vs. 1.08 mV per cycle for S-NCO) with a slower attenuation rate of 3.0% (vs. 5.5% for S-NCO). This indicates that the oxygen vacancies can suppress the voltage fading owing to the decline of lattice stress.19 Moreover, the result of our high-rate cycling tests further verifies the better cyclic stability of OV-NCO. OV-NCO denotes superior cyclic stability at 5C, with an initial discharge capacity of 116.6 mA h g−1 and a capacity-retention percentage of 80.2% after 400 cycles. By contrast, S-NCO delivers a lower initial discharge capacity (99.6 mA h g−1) and a weaker cycling performance (42.5%) (Fig. 4e).
The rate performance of OV-NCO and S-NCO measured at various current rates up to 100C is compared in Fig. 4f. The discharge capacities of OV-NCO at the end of 1C, 2C, 5C, 10C, and 20C are 128.4, 125.2, 116.3, 112.7, and 106.2 mA h g−1 and reach 89.5 and 59.6 mA h g−1 when the current rate is increased to 50C and 100C, respectively. The capacity increases to 124.5 mA h g−1 when the current rate is reset to 1C, for 92.7% capacity retention relative to 1C. Conversely, S-NCO exhibits inferior rate performance with reversible capacities falling to as low as 42.5 mA h g−1 at a current rate of 20C. And the capacity fleetly declines below 20 mA h g−1 as current rates beyond 50C. As Table S4† shows, the conspicuously improved power sustainability of OV-NCO, especially the high capacity at the highest test current rates, is the best among many state-of-the-art Cr-based layered oxide cathodes charged beyond 3.6 V, suggesting that the oxygen vacancies in OV-NCO indeed expedite the sodium-ion diffusivity by facilitating the migration of Na trapped in the tetrahedral sites.44
To further understand the superior electrochemical performance of OV-NCO and unearth the enhanced kinetics of Na+ intercalation/extraction, electrochemical impedance spectroscopy (EIS) is carried out before and after cycle. Before cycle, OV-NCO and S-NCO show similar Nyquist plots composed of an uncompensated ohmic resistance in the high-frequency region (Rs), a semicircle correlating with the charge-transfer resistance (Rct) between the electrolyte and electrode, and an inclined line in the low-frequency area linked to the Na+ diffusion (Wo) (Fig. S7a†). After 10 cycles at 2C, a new semicircle, representing the cathode electrolyte interphase (CEI) resistance (Rf), is observed in the high-medium-frequency region (Fig. S7b†). Through comparative analysis on the fitting lines and detailed parameters, it is plain that OV-NCO exhibits much lower interfacial impedance and a larger slope of the oblique line in the low-frequency area (Fig. S7†). As such, it can be inferred that the pre-formed oxygen vacancies in OV-NCO not only contribute to retarding the decomposition of the electrolyte for a thinner CEI layer, but also boost the electron and ion diffusion.21,32,45
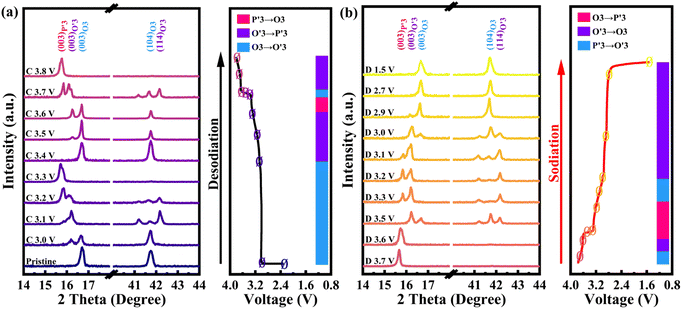
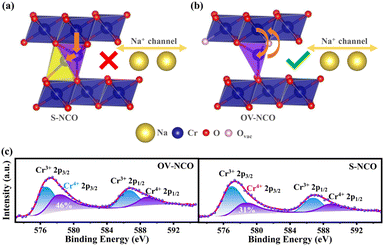
To reveal the detailed mechanism under the optimized electrochemical performances of the OV-NCO cathode, the phase evolution during galvanostatic charging and discharging is examined through ex situ XRD measurement and analyzed by tracking the XRD pattern evolution of the electrode (Fig. 5a and b). During the early step of charging, the new diffraction peaks assigned to the O′3 phase emerge with the coexistence of the initial O3 phase through O3–O′3 phase transition, which is consistent with the long voltage plateau of around 3.0 V. Subsequently, the two phases gradually diminish and a complete phase transition to the P′3 monoclinic phase is concomitantly achieved by the gliding of oxide slabs associated with Na removal, which implies a solid-solution behavior coinciding with the sloping profiles from 3.0–3.3 V.3 As Na+ ions are further removed, it is anomalous that a transition back to the original O3 phase is observed, ascertained by the right-shift to the primal position (∼16.7°) of the (003) peak. Generally, such a right-shift of diffraction peaks along with a contraction of interlayer spacing usually occurs near the end of the desodiation process for O3-type ferrous layer-structured cathodes such as NaFeO2,10,16 NaCr1/4Fe1/4Ni1/4Ti1/4O2 (ref. 46) and NaCr1/3Fe1/3Mn1/3O2.13 It is explained by the migration of TMs from the octahedral sites in TM oxide slabs to the neighbor tetrahedral sites in the interslab space through the shared oxygen plane. However, such TM migrations are mostly irreversible as the migrated TMs would continue to penetrate into the octahedral sites face-shared with the tetrahedral sites by subsequent Na+ removal.25 The trapped TMs directly block the Na+ diffusion channels as well as inducing covalent layer-to-layer bonds that prevent layer gliding, and thus hamper the further O3–O′3–P3 phase transition (Fig. 6a).11,16 Without Fe doping, the TM migrations have been already activated at about half charged state of OV-NCO, probably because the presence of oxygen vacancies weakens the steric hindrance by elongating the O–O distance and therefore lowers the energy barrier of TM migration (Fig. 6b).20,47,48 More surprisingly, the triphasic transition is not restrained in OV-NCO when Na ions resume extraction and the phase structure finally transforms into the P′3 phase at the cut-off voltage (3.8 V), demonstrating that the migrated TMs do not interfere with the Na+ diffusion. In view of this apparition, we suppose that the migrated Cr ions are still maintained in a Cr3+ (d3) or Cr4+ (d2) configuration below 3.6 V, which intrinsically prefer octahedral sites and are possible to spontaneously move back to the TM layer along with subsequent Na+ extraction.11,13 Upon discharging, an opposite evolution is reversely unfolded and a set of well-defined O3 phase peaks are recovered to the initial position at the end of the sodiation process. In a word, highly reversible phase transition resulting from reversible TM migration in OV-NCO is effectively driven by the pre-formed oxygen vacancies, whose mechanism shares a degree of similarity with those of Li-rich oxide (Li1.2Mn0.6Ni0.2PxO2−y)20 or Mn-rich oxide (Na1−xLix[(Mn0.66Co0.17Ni0.17)0.8□0.2]O2−y)49 with oxygen vacancies. And thanks to this new mechanism, the phase transition behavior of OV-NCO is reserved effectively with the majority of capacity being in the O3-type region, which promotes the structural stability upon long-term cycling.50
What's more, ex situ XPS techniques are used to investigate the oxidation state of Cr for both samples at the charged state of 3.8 V during the second cycle. Based on the recent literatures, the irreversible TM transition during cycling is intimately related to the charge disproportionation of Cr4+ (3Cr4+ → 2Cr3+ + Cr6+).11,14 The formed Cr6+ (0d) ions with a small ionic radius tend to drop into tetrahedral sites in the Na layer and then permanently fall into the octahedral sites through a comproportionation reaction, resulting in the loss of active Cr cations.11,13 Since the enmeshed Cr cations cannot participate in the Cr3+/Cr4+ redox to provide capacity, a higher proportion of Cr4+ at the fully charged state (3.8 V) during the second cycle for OV-NCO, depicted in Fig. 6c, means the less occurrence of undesirable disproportionation in its first cycle, which again verifies the availability of oxygen vacancies for suppressing the layer-to-rock-salt transition by facilitating reversible TM migration and thus improving high-voltage stability of NaCrO2.
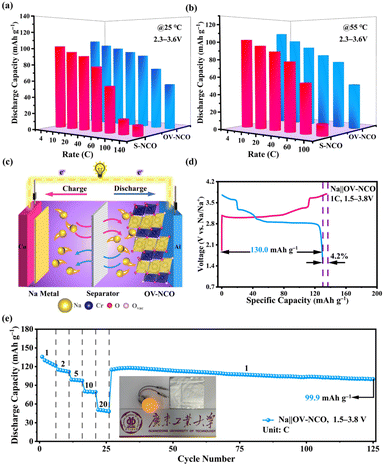
Apart from the superior electrochemical performance in the wide voltage range of 1.5–3.8 V, the rate performance of OV-NCO in the conventional voltage region (2.3–3.6 V) also ignites our interest, which is explored at current rates ranging from 4C to 140C at room temperature (25 °C) (Fig. 7a). For OV-NCO, high discharge capacities of 109.9, 106.8 and 99.9 mA h g−1 are obtained at 4C, 10C and 20C, respectively, and they eventually reach 93.6, 89.4, 73.7 and 54.7 mA h g−1 at 40C, 60C, 100C and 140C, respectively. The rate capability of S-NCO is almost identical to that of OV-NCO at relatively low current rates. However, rapid capacity fading in S-NCO is observed when increasing the current rate beyond 40C. The discharge capacities of S-NCO at 60C, 100C, and 140C remain only 55.1, 12.6 and 15.1 mA h g−1, respectively. When the current rate reverts to 4C, the discharge capacities of both samples nearly restore to the initial values. Furthermore, symmetric rate tests are also conducted at an elevated temperature of 55 °C. Fig. 7b reveals that OV-NCO still yields exceptional rate capability at elevated temperature (55 °C), which can be found particularly at the high current rate of 100C that displays a prominent increased capacity of ∼40 mA h g−1 by comparison with that of S-NCO. More strikingly, the rate capability of OV-NCO has shown certain competition ability among bulk NaCrO2 cathodes and other well-studied cathodes (Tables S5 and S6†), whether at room temperature (25 °C) or elevated temperature (55 °C). For the reason of studying the state of electrochemical kinetics, galvanostatic intermittent titration technique (GITT) analyses are performed to quantify the apparent Na+ diffusion coefficients (DNa+) according to the following equation:
 | (1) |
In order to validate the feasibility for practical applications, the OV-NCO cathode is implemented at a prototypical single-layer pouch cell level with a Na metal anode, denoted as Na‖OV-NCO. As schematically illustrated in Fig. 7c, Na+ serves as the ion charge carrier to shuttle back and forth between the anode and cathode through the electrolyte in this pouch-type configuration. In the voltage range of 1.5–3.8 V, the assembled pouch cell delivers an initial CE of 95.8% with a discharge capacity of 130.0 mA h g−1 at 1C and the discharge/charge plateaus are superimposable with those tested in coin cells (Fig. 4a and 7d). The pouch cell also exhibits discharge capacities of 115.0, 99.0, 80.2 and 50.5 mA h g−1 at current rates of 2, 5, 10 and 20C, respectively, which increased to 115.1 mA h g−1 as the current rate returns to 1C. Remarkably, the capacities are stable for 100 cycles (99.9 mA h g−1) at this current rate, exhibiting no dramatic decay in capacity (Fig. 7e). Furthermore, the cycling performance of the pouch cell at 5C in Fig. S10† demonstrates that 80% of the original capacity (100.4 mA h g−1) is retained after 250 cycles with an average CE of 97.4%. For the actual operating condition, this pouch cell with an appropriate open-circuit voltage (∼2.4 V) can successfully power a bulb, as depicted in Fig. 7e. These results indicate that the overall performance of OV-NCO strikes a balance between the capacity and cyclability in the pouch-type system and is able to bridge the typical gap between a coin cell and a pouch cell with an area of 7.5 cm2.
3. Conclusions
In summary, we have demonstrated a simple but resultful routine to synthesize the NaCrO2 cathode and synchronously introduce plenty of oxygen vacancies. Through the electrochemistry study of OV-NCO and S-NCO, we ascertain the dual functionality of pre-formed oxygen vacancies for realizing the high-voltage operation of NaCrO2−x (charged up to 3.8 V) by facilitating reversible TM migration and prodigiously improving the rate capability by expediting Na+ diffusion. Such an OV-NCO electrode delivers a reversible sodiation capacity of 134.5 mA h g−1 in a voltage range of 1.5–3.8 V at 1C, long-term cycling stability with 80% capacity retention after 400 cycles at 5C, and superior rate capability with approximately 50% capacity retention at 100C. As a concept-proof model, the OV-NCO cathode is integrated with a Na metal anode in a single-layer pouch cell, the prototype of which displays balanced capacity with satisfactory cyclability. Most importantly, the detailed mechanism of how oxygen vacancies suppress detrimental phase transformation and store the majority of the total capacity in the O3-type region is uncovered through ex situ XRD and XPS. In in-depth analysis, we emphasized the premature but reversible TM migration activated by oxygen vacancies at low alkali metal deintercalated levels. It is such a dominant factor that enables highly reversible O3–O′3–P3 phase transition behavior and ultimately guarantees the stable high-voltage operation of NaCrO2. This creative mechanism undoubtedly paves a brand-new viable way to tailor high performance O3-type layered Na intercalation cathodes and will inspire a wave of efforts to extend the utility of oxygen vacancies to other SIB cathodes.Conflicts of interest
There are no conflicts to declare.Acknowledgements
We gratefully acknowledge the financial support from the National Science Foundation, China (21673051), Department of Science and Technology, Guangdong Province, China (2019A050510043) and Foshan Education Bureau, China (2020XCC03).References
- Y. You and A. Manthiram, Adv. Energy Mater., 2018, 8, 1701785 CrossRef.
- S. Chu, S. Guo and H. Zhou, Chem. Soc. Rev., 2021, 50, 13189–13235 RSC.
- J. Yang, M. J. Tang, H. Liu, X. Y. Chen, Z. W. Xu, J. F. Huang, Q. M. Su and Y. Y. Xia, Small, 2019, 15, 190531 Search PubMed.
- J. Yang, J. M. Lim, M. Park, G. H. Lee, S. Lee, M. Cho and Y. M. Kang, Adv. Energy Mater., 2021, 11, 2102444 CrossRef CAS.
- C. Zhao, Q. Wang, Z. Yao, J. Wang, B. Sanchez-Lengeling, F. Ding, X. Qi, Y. Lu, X. Bai, B. Li, H. Li, A. Aspuru-Guzik, X. Huang, C. Delmas, M. Wagemaker, L. Chen and Y.-S. Hu, Science, 2020, 370, 708–711 CrossRef CAS.
- K. Kubota, S. Kumakura, Y. Yoda, K. Kuroki and S. Komaba, Adv. Energy Mater., 2018, 8, 1703415 CrossRef.
- Y. Sun, S. Guo and H. Zhou, Energy Environ. Sci., 2019, 12, 825–840 RSC.
- X.-G. Yuan, Y.-J. Guo, L. Gan, X.-A. Yang, W.-H. He, X.-S. Zhang, Y.-X. Yin, S. Xin, H.-R. Yao, Z. Huang and Y.-G. Guo, Adv. Funct. Mater., 2022, 32, 2111466 CrossRef CAS.
- C. Delmas, C. Fouassier and P. Hagenmuller, Physica B+C, 2007, 99, 81–85 CrossRef.
- X. Li, Y. Wang, D. Wu, L. Liu, S.-H. Bo and G. Ceder, Chem. Mater., 2016, 28, 6575–6583 CrossRef CAS.
- S.-H. Bo, X. Li, A. J. Toumar and G. Ceder, Chem. Mater., 2016, 28, 1419–1429 CrossRef CAS.
- S. Lee, S. W. Doo, M. S. Jung, S. G. Lim, K. Kim and K. T. Lee, J. Mater. Chem. A, 2021, 9, 14074–14084 RSC.
- M. H. Cao, Y. Wang, Z. Shadike, J. L. Yue, E. Hu, S. M. Bak, Y. N. Zhou, X. Q. Yang and Z. W. Fu, J. Mater. Chem. A, 2017, 5, 5442–5448 RSC.
- I. Lee, G. Oh, S. Lee, T. Y. Yu, M. H. Alfaruqi, V. Mathew, B. Sambandam, Y. K. Sun, J. Y. Hwang and J. Kim, Energy Storage Mater., 2021, 41, 183–195 CrossRef.
- Y. J. Guo, P. F. Wang, Y. B. Niu, X. D. Zhang, Q. H. Li, X. Q. Yu, M. Fan, W. P. Chen, Y. Yu, X. F. Liu, Q. H. Meng, S. Xin, Y. X. Yin and Y. G. Guo, Nat. Commun., 2021, 12, 5267 CrossRef CAS.
- B. Silvan, E. Gonzalo, L. Djuandhi, N. Sharma, F. Fauth and D. Saurel, J. Mater. Chem. A, 2018, 6, 15132–15146 RSC.
- L. Wang, X. Lei, T. Liu, A. Dai, D. Su, K. Amine, J. Lu and T. Wu, Adv. Mater., 2022, 34, 2200744 CrossRef CAS PubMed.
- Q. Ma, Z. Chen, S. Zhong, J. Meng and T. Liu, Nano Energy, 2020, 81, 105622 CrossRef.
- Q. Li, D. Ning, D. Zhou, K. An, D. Wong, L. Zhang, Z. Chen, G. Schuck, C. Schulz, Z. Xu, G. Schumacher and X. Liu, J. Mater. Chem. A, 2020, 8, 7733–7745 RSC.
- K. Chai, J. Zhang, Q. Li, D. Wong, L. Zheng, C. Schulz, M. Bartkowiak, D. Smirnov and X. Liu, Small, 2022, 18, 2201014 CrossRef CAS.
- B. Qiu, M. Zhang, L. Wu, J. Wang, Y. Xia, D. Qian, H. Liu, S. Hy, Y. Chen, K. An, Y. Zhu, Z. Liu and Y. S. Meng, Nat. Commun., 2016, 7, 12108 CrossRef CAS PubMed.
- Y. Su, Q. Zhang, L. Chen, L. Bao, Y. Lu, Q. Shi, J. Wang, S. Chen and F. Wu, ACS Appl. Mater. Interfaces, 2020, 12, 37208–37217 CrossRef CAS.
- H. Guo, Z. Wei, K. Jia, B. Qiu, C. Yin, F. Meng, Q. Zhang, L. Gu, S. Han, Y. Liu, H. Zhao, W. Jiang, H. Cui, Y. Xia and Z. Liu, Energy Storage Mater., 2019, 16, 220–227 CrossRef.
- M. Jiang, D. Xu, B. Yang, C. Zhang and M. Cao, Adv. Mater. Interfaces, 2021, 8, 2100188 CrossRef CAS.
- K. Kubota, I. Ikeuchi, T. Nakayama, C. Takei, N. Yabuuchi, H. Shiiba, M. Nakayama and S. Komaba, J. Phys. Chem. C, 2015, 119, 166–175 CrossRef CAS.
- J. Liang, L. Liu, X. Liu, X. Meng, L. Zeng, J. Liu, J. Li, Z. Shi and Y. Yang, ACS Appl. Mater. Interfaces, 2021, 13, 22635–22645 CrossRef CAS.
- H. R. Yao, L. T. Zheng, S. Xin and Y. G. Guo, Sci. China Chem., 2022, 65, 1076–1087 CrossRef CAS.
- Y. Kim, H. Park, J. H. Warner and A. Manthiram, ACS Energy Lett., 2021, 6, 941–948 CrossRef CAS.
- Y. Bai, H. Xu and Y. Zhang, J. Wuhan Univ. Technol., 2010, 25, 388–390 CrossRef CAS.
- G. Li, W. Yang, S. Gao, Q. Shen, J. Xue, K. Chen and Q. Li, Chem. Eng. J., 2021, 404, 127115 CrossRef CAS.
- M. Du, Z. Miao, H. Li, F. Zhang, Y. Sang, L. Wei, H. Liu and S. Wang, Nano Energy, 2021, 89, 106477 CrossRef CAS.
- Z. Huang, T. Xiong, X. Lin, M. Tian, W. Zeng, J. He, M. Shi, J. Li, G. Zhang, L. Mai and S. Mu, J. Power Sources, 2019, 432, 8–15 CrossRef CAS.
- B. Chen, L. B. Ben, Y. Y. Chen, H. L. Yu, H. Zhang, W. W. Zhao and X. J. Huang, Chem. Mater., 2018, 30, 2174–2182 CrossRef CAS.
- S. Hwang, W. Chang, S. M. Kim, D. Su, D. H. Kim, J. Y. Lee, K. Y. Chung and E. A. Stach, Chem. Mater., 2014, 26, 1084–1092 CrossRef CAS.
- T. L. Daulton and B. J. Little, Ultramicroscopy, 2006, 106, 561–573 CrossRef CAS.
- K. H. Ye, K. S. Li, Y. R. Lu, Z. J. Guo, N. Ni, H. Liu, Y. C. Huang, H. B. Ji and P. S. Wang, TrAC, Trends Anal. Chem., 2019, 116, 102–108 CrossRef CAS.
- Y. F. Su, Q. Y. Zhang, L. Chen, L. Y. Bao, Y. Lu, Q. Shi, J. Wang, S. Chen and F. Wu, ACS Appl. Mater. Interfaces, 2020, 12, 37208–37217 CrossRef CAS.
- S.-L. Cui, X. Zhang, X.-W. Wu, S. Liu, Z. Zhou, G.-R. Li and X.-P. Gao, ACS Appl. Mater. Interfaces, 2020, 12, 47655–47666 CrossRef CAS.
- E. Unveren, E. Kemnitz, S. Hutton, A. Lippitz and W. E. S. Unger, Surf. Interface Anal., 2004, 36, 92–95 CrossRef.
- M. Nazarian-Samani, M. Nazarian-Samani, S. Haghighat-Shishavan and K. B. Kim, Energy Storage Mater., 2021, 36, 229–241 CrossRef.
- M. Aronniemi, J. Sainio and J. Lahtinen, Surf. Sci., 2005, 578, 108–123 CrossRef CAS.
- M. C. Biesinger, B. P. Payne, A. P. Grosvenor, L. W. M. Lau, A. R. Gerson and R. S. Smart, Appl. Surf. Sci., 2011, 257, 2717–2730 CrossRef CAS.
- E. Lee and K. A. Persson, Adv. Energy Mater., 2014, 4, 1400498 CrossRef.
- B. Chen, B. Zhao, J. Zhou, Z. Fang, Y. Huang, X. Zhu and Y. Sun, J. Mater. Sci. Technol., 2019, 35, 994–1002 CrossRef CAS.
- C. Zhang, Y. Feng, B. Wei, C. Liang, L. Zhou, D. G. Ivey, P. Wang and W. Wei, Nano Energy, 2020, 75, 104955 Search PubMed.
- M.-H. Cao, Z. Shadike, S.-M. Bak, T. Wang, E. Hu, S. Ehrlich, Y.-N. Zhou, X.-Q. Yang and Z.-W. Fu, Energy Storage Mater., 2020, 24, 417–425 CrossRef.
- A. Gao, X. Y. Li, F. Q. Meng, S. N. Guo, X. Lu, D. Su, X. F. Wang, Q. H. Zhang and L. Gu, Small Methods, 2021, 5, 2000730 CrossRef CAS PubMed.
- D. N. Qian, B. Xu, M. F. Chi and Y. S. Meng, Phys. Chem. Chem. Phys., 2014, 16, 14665–14668 RSC.
- B. Xiao, Y. Wang, S. Tan, M. Song, X. Li, Y. Zhang, F. Lin, K. S. Han, F. Omenya, K. Amine, X.-Q. Yang, D. Reed, Y. Hu, G.-L. Xu, E. Hu, X. Li and X. Li, Angew. Chem., Int. Ed., 2021, 60, 8258–8267 CrossRef CAS.
- C. Zhao, F. Ding, Y. Lu, L. Chen and Y.-S. Hu, Angew. Chem., Int. Ed., 2020, 59, 264–269 CrossRef CAS PubMed.
- F. Xia, D. Tie, J. Wang, H. L. Song, W. Wen, X. X. Ye, J. S. Wu, Y. L. Hou, X. G. Lu and Y. F. Zhao, Energy Storage Mater., 2021, 42, 209–218 CrossRef.
- X. D. Zhang, J. L. Shi, J. Y. Liang, Y. X. Yin, J. N. Zhang, X. Q. Yu and Y. G. Guo, Adv. Mater., 2018, 30, 1801751 CrossRef.
Footnote |
| † Electronic supplementary information (ESI) available. See DOI: https://doi.org/10.1039/d2ta07413c |
| This journal is © The Royal Society of Chemistry 2023 |

