Anisotropic sol–gel transition and morphological aspects of a hierarchical network of nematic gel and a superimposed photopolymer†
G. V.
Varshini
,
D. S. Shankar
Rao
 * and
S. Krishna
Prasad

Centre for Nano and Soft Matter Sciences, Shivanapura, Bangalore, 562162, India. E-mail: raoshankards@gmail.com
First published on 12th May 2023
Abstract
We report investigations on a liquid crystal confined in a hierarchical double network arising from the fibres of an organogelator and a photopolymer. The morphological characteristics and the gel point are seen to be strongly dependent on temperature, or more accurately on the thermodynamic phase in which the polymerization is carried out and also the concentration of the reactive monomer. The presence or absence of the anisotropy of the phase as well as the fluid or the gel character present architectures that are substantially different in complexity as quantified by the fractal dimension obtained from scanning electron microscopy images. The main aspect of this study, which includes dielectric as well as elastic constant measurements, is the attractive feature of hierarchical networks wherein the polymer and gel networks are caused by different chemical species providing a control to have one of them superimposed on the other leading to interesting confined geometry effects.
1. Introduction
Several studies involving the structural,1–3 morphological, optical, electro-optic, and dielectric properties of liquid crystals (LCs) confined in pre-fabricated or in situ created scaffolds have brought to fore the importance of restricted geometry in anisotropic condensed matter systems.4–9 In this regard, networks created by dopants, such as polymerizable monomers and gelators, have been studied considerably. Physical gels that combine the anisotropic character of LCs and the mechanical rigidity of the thermo-reversible network have been reported to present significant consequences on the LC-gel (LCG) properties, faster electro-optic response, anomalous variations in elastic constants, enhanced photoluminescence, and applications in soft robotics and flexible displays.10–17 We have just reported15 the novel influence of sample thickness and applied pressure on the characteristics of an organogel exhibiting a nematic-to-nematic-gel transition. It was found that the gelation temperature (Tsg) depends strongly on the sample thickness d, for d < 30 μm. On the other hand, applied pressure hinders the gelation process, resulting in a reduced thermal range of the nematic-gel phase. In light of these fascinating findings, we now describe a new dimension to the LCG systems in the form of another constraint played by polymer confinement in the presence or absence of a second network due to gelation, thus mimicking a hierarchical network.Polymer-modified LC systems are well known for applications, such as privacy windows, switchable THz devices, electro-optic devices, and optical filters.4,16–21 Depending on the polymer content in the LC medium, they can be of two types: polymer dispersed liquid crystals (PDLCs) and polymer stabilized liquid crystals (PSLCs). While the former is polymer-rich, in the latter case, the polymer is a minority component. A judicious balance of the material content and the refractive index difference between the polymer and LC gives rise to various modifications in LC properties, such as lowered operating voltages, better scattering ability, and reduction in the backflow effect,22–24 which are essential for device applications.
To understand the polymer + LC network characteristics in liquid, LC, and LC gel environments, we investigated a system wherein the network formation of the gel occurs independent of the monomers that get polymerized. We realised that these systems may be viewed as a parallel amalgamation to the double or inter-penetrating networks, well-studied in hydrogels and polymer gel systems.26–34 Such networks, especially in hydrogels, can be formed either by utilizing polymers or low molecular weight organogels. For instance, two orders of magnitude higher (from 0.2 MPa to 25 MPa) sustainability to compression stress was observed in a double network hydrogel system compared to its single network counterpart,25 even when the water content was nearly 90%. Another example mimicked the extra-cellular matrix for tissue formation and regeneration.26–28 These and such observations have opened up possibilities to deploy them in drug delivery systems, tissue engineering, biosensors, soft contact lens, etc.29–33 Extension of competing network strategy studies to an anisotropic environment will add another dimension to the knowledge base on two networks imposed on a single host.
Although there have been no reports of including two networks in a liquid crystal host, Kato et al.,34 investigated a photo-polymerisable gelator system that displayed enhanced electro-optical responses. Even if one considers this system to have two networks, each of polymerization and gelation, the aspect that the same material leads to both mechanisms reduces the extent of tunability and sequential aspects. Hence, this study is the first of its kind, wherein the two physical networks are caused in a hierarchical fashion by two different materials added to the liquid crystal host. Apart from the fact that we are exploring a new direction, it is observed that the thermodynamic phase of the system offers itself as a parameter for controlling the morphology of the network. For this purpose, we employed a photo-polymerizable monomer and a low-molecular-weight organogelator as separate entities and carried out the polymerization at different temperatures or rather in different phases. This protocol exploits the fact that polymer networks formed mimic, to a great extent, the orientation of LC molecules during polymerisation.4,16,35 We have analysed the details of the morphology of the polymer strands formed, voids created due to the LC trapped within the polymer networks, the mutual interaction of the two networks involved, and their impact on other liquid crystal properties such as gelation and elastic constants based on their hierarchy of existence.
2. Experimental methods
2.1 Materials used and sample preparation
The host LC material (labelled TCMG) consists of a three-LC component mixture and a low-molecular-weight organogelator, 12-hydroxystearic acid, (HSA), present at a concentration of 1.5 weight%. TCMG exhibits the nematic phase over a wide temperature range from 54.2 °C to sub-ambient temperatures as confirmed by polarising optical microscope (POM). A diacrylate reactive mesogenic monomer (RM82 from Merck), added at different concentrations to TCMG, served as the photo-polymerizable monomer. The polymerization was initiated by adding a small amount (2% of RM82) of photoinitiator (BME, Aldrich). The molecular structures of the employed materials and their transition temperatures are shown in Fig. S1(a)–(d) (ESI†). For preparing the polymerizable mixture, required amounts of TCMG, RM82, and BME were weighed and mixed physically at T ∼ 120 °C, well above the isotropic temperature of TCMG.To understand the mutual influence of polymer and gel networks in detail, we studied seven different concentrations of RM82 in TCMG: XRM = 0.5, 1, 1.25, 1.5, 1.75, 2, and 3, where XRM denotes the weight% of RM82 in TCMG. The phase sequence of TCMG remains unaltered upon the addition of RM82, over the range of concentrations studied. All the composites studied show the phase sequence isotropic (Iso) → nematic sol (Nsol) → nematic gel (Ngel) on lowering the temperature. TCMG + monomer mixtures were filled into the cells, whose thickness was maintained around 12–15 μm, using capillary action well above the isotropic temperature. For orienting the nematic director in the planar fashion, the substrates forming the cell were treated with a unidirectionally rubbed polyimide layer. Polymerization of the samples was carried out with low-power (3 mW cm−2) UV radiation having a peak wavelength of 365 nm.
As discussed in the introduction, the primary focus of these studies was to explore the influence of the order of the mesophase on the morphology of the networks formed and on the gelation properties. Hence, the filled cells, labelled as G-P, N-P, and I-P and were polymerized in the three different phases – (a) at 30 °C in the gel phase, (b) at 50 °C in the nematic phase, and (c) at 60 °C in the isotropic phase. This process enabled us to examine the effect of LC orientation at different levels on the network formation and in turn the influence of the first gel/polymer formed network on the second polymer/gel network.
2.2 Measurement techniques
 | (1) |
3. Results and discussions
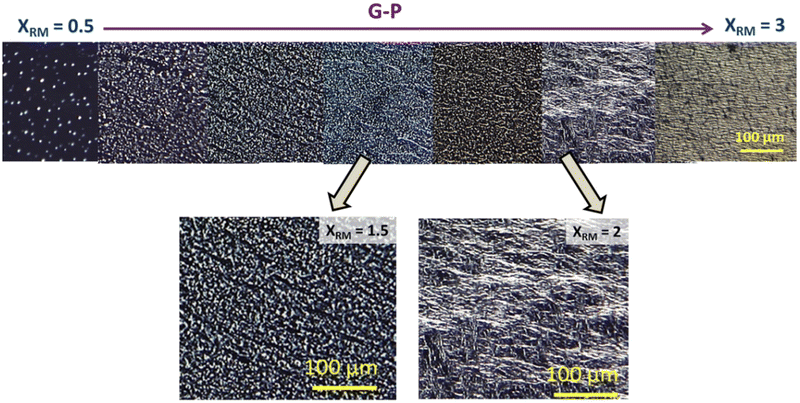
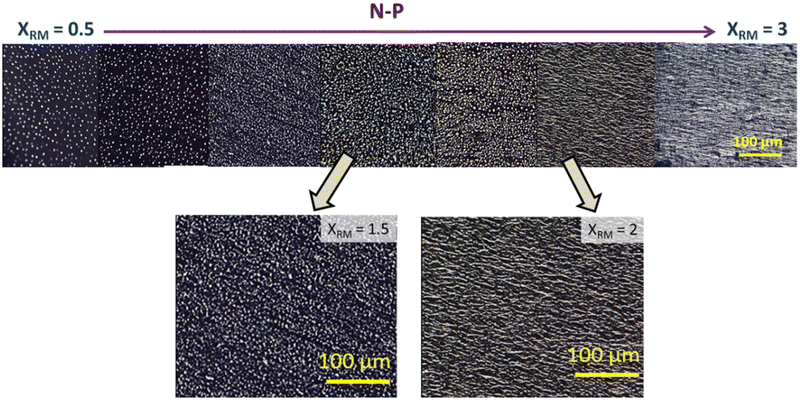
The studied system involves both polymer and gel networks formed on a hierarchical basis that arises owing to the temperature (or equivalently the mesophase) at which the polymerization is carried out. The characteristics of this dual network on the G-P, N-P and I-P samples for different compositions (XRM) of the RM material are comprehended from three different viewpoints: (a) morphological aspects, (b) effect on the gelation temperature and (c) dielectric behaviour.3.1 Morphological observations
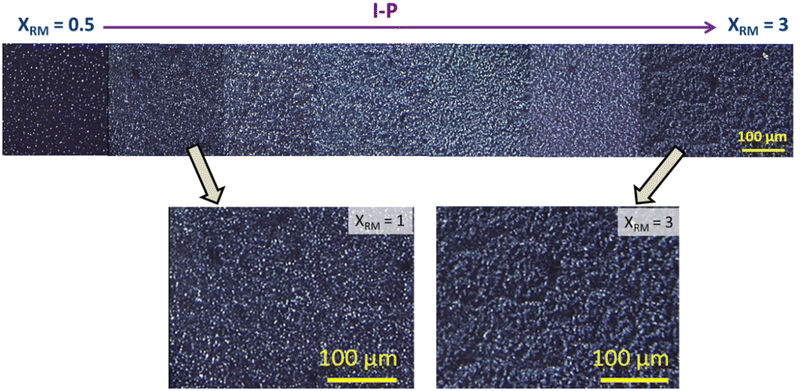 | ||
| Fig. 3 POM images taken in the isotropic when polymerised in the isotropic phase (I-P) for varied XRM. No connected strands are observed for any XRM, even in enlarged images (shown below). | ||
Thus, achieving oriented networks seem to be requiring the orientation of HSA molecules as well. In addition, if a molecular-level control can be realized wherein the H-bondable units of neighbouring HSA molecules are placed in favourable positions, then even better-oriented hierarchical networks can be expected. The strength of the gel network overseen by the concentration of HSA could bring an additional control parameter.
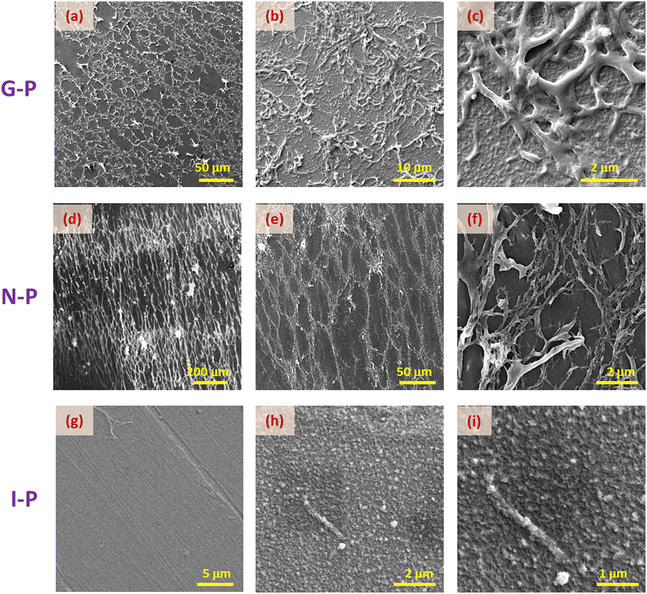
In consonance with the observations under POM, excellent spatially continuous networks are seen for the nematic and gel polymerized samples, but not for the isotropic case. Careful observations of these images reveal the contrasting behaviour between the N-P and G-P samples with the former having director-dictated far better orientation than their counterpart gel polymerized (G-P) sample affected by the random orientation due to the existing gel network and its influence on the yet to be polymerised monomer units. The regions enclosed by the polymer network creating void-like structures are similar to those reported in hydrogels presenting an interpenetrating network.36,37 We shall return to this point later.
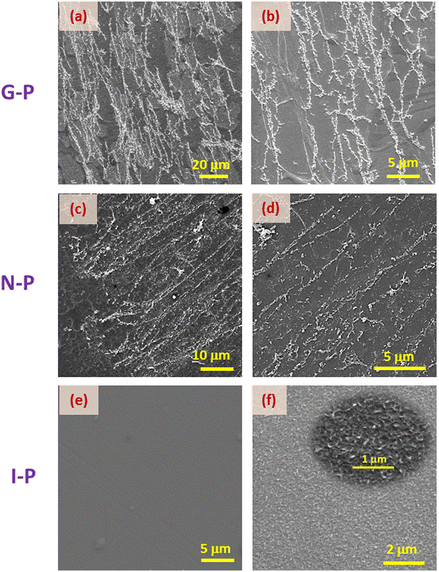
We now compare the situations for two different monomer concentrations, XRM = 1.75 and 3. Unlike the images for the latter material (Fig. 4a–f), the SEM images for lesser monomer concentration (Fig. 5a–d), do not present any noticeable difference in the morphology of the N-P and G-P samples. For example, in the higher concentration material, the G-P case has a much less orientationally ordered structure than the N-P sample, whereas in the XRM = 1.75 system, such an order is essentially retained in the G-P sample also, although with an increased density of fibres (compare Fig. 5(b) and (d)). As expected, the I-P samples of both concentrations, do not exhibit any network formation (see Fig. 4(g–i) and 5(e, f)), albeit showing the presence of randomly oriented short strands, as highlighted in the inset in Fig. 5(f). According to a few studies38,39 on the gel phase exhibited by polymers, the development of the network begins with the formation of domains, which in turn act as nucleation centres. These discrete nucleation centres intersect as they grow and tend to form a network of self-assembled polymers strands.38 Obviously, the higher the value of XRM, the more would be the number of nucleation centres increasing the density of the network, a feature that is reflected in Fig. 4 and 5. Besides, the magnitude of nucleation centres also decides the extent of heterogeneity of the structure: the higher the concentration of RM, the more heterogeneity of the structure.
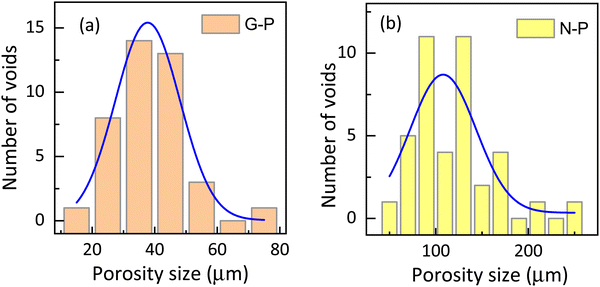 | ||
| Fig. 6 Histogram showing the porosity size distribution in (a) gel-polymerized and (b) nematic polymerized samples (calculated from the SEM) images shown in Fig. 4(a) and (e). It should be noted that the horizontal scale is significantly different. | ||
Let us recall that when the polymerization takes place, the environment is completely fluid in the case of N-P samples, but is interspersed with a gel network in the G-P case. It is tempting to consider that the already-formed gel network serves as a template over which the polymerization takes place. It may be mentioned that whether there is a chemical favour between the gelated HSA molecules and the RM82 monomers, is not evident. However, from the images, it is seen that the G-P case has thicker fibres compared to the N-P case. In fact, the width of the fibres averaged over the measurements at several points yields values of 0.26 μm and 0.12 μm for G-P and N-P cases. This 2-fold increase in the width perhaps is suggestive of the feature that the gel network, being a more solid platform than the fluid LC regions, favours the RM82 monomers to settle down during polymerization making the fibres thicker. Alternatively, the gel network could also be reducing the thermal fluctuation in the medium causing the formation of thicker fibres. In addition, during polymerization, the gel network reduces the volume available for the liquid crystal sample leading to a much narrower distribution of the void sizes for the G-P sample.
Although the dimensionality can be calculated by various methods, we have used the standard box-counting method, implemented through the open-source software, ImageJ. The method is based on splitting the image into boxes of increasingly smaller size (d), and applying the counting protocol at each box size. Then, the relation connecting N, the number of boxes at each scale, the box size d, and the fractal dimension Df is given by
 | (2) |
A representation of N vs. d in a double logarithmic scale should yield a straight line, the slope of which gives the fractal dimension Df (for example, see Fig. S3, ESI†). To allow unambiguous determination of the box size and subsequent calculation of the fractal dimension, the images were binarized by converting the grey image into a representation consisting of only black (pixel value = 0) and white (pixel value = 255) pixels by fixing the threshold at the half-way mark of 127. Further details, including confirmation of the analysis protocol with automatic and manual threshold values, and comparison with a literature example, are provided in ESI† under the section Fractal dimension analysis, and Fig. S4 and S5 (ESI†). As shown in Fig. 7 and 8, the binarization appears to be quite faithful for both N-P and G-P samples at coarse as well as fine scales.
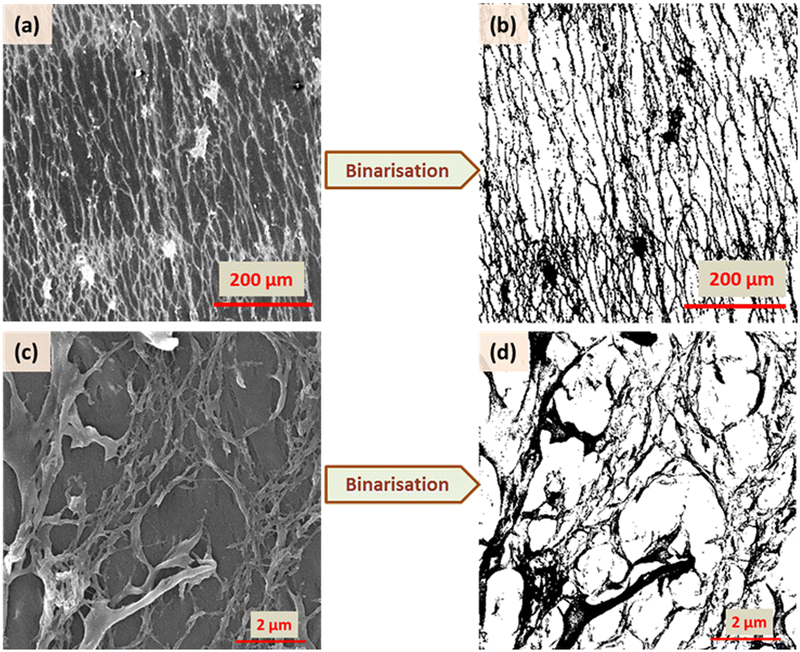 | ||
| Fig. 7 Binarisation of the SEM images for XRM = 3 in two different magnifications (125 and 15 × 103) for the N-P case. | ||
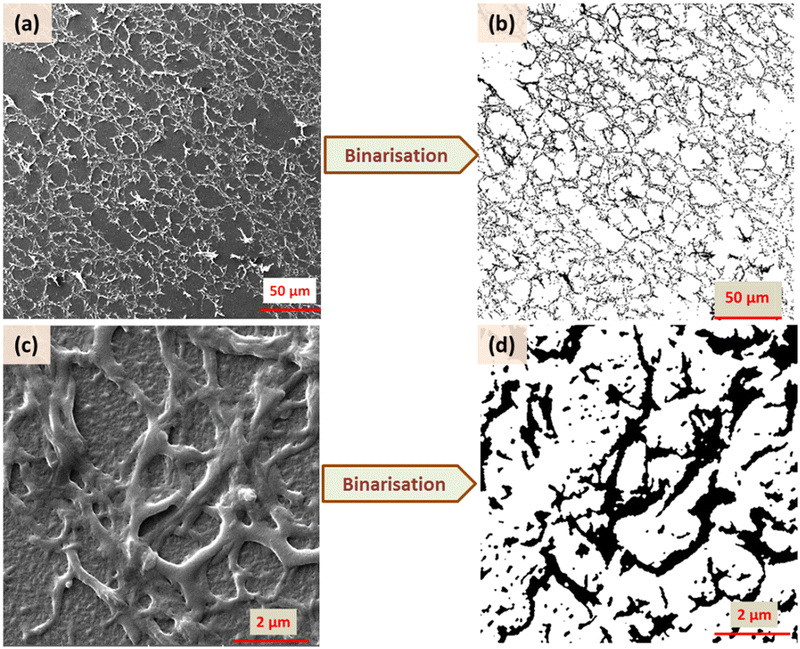 | ||
| Fig. 8 Binarisation of the SEM images for XRM = 3 in two different magnifications (500 and 20 × 103) for the G-P case. | ||
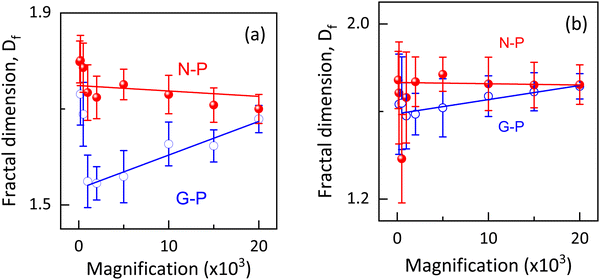
Following standard practices,40,45–47 we calculated the fractal dimension for different magnifications ranging from 100 to 20 × 103, and the results are shown in Fig. 9(a). The measured range of Df values (1.55 to 1.8) are in agreement with others for the PSLC systems.4,43,48 Besides, these values are also in the range seen when the mechanism is diffusion-limited cluster aggregation rather than reaction-limited cluster aggregation.49 As expected for the former mechanism, the morphology is more open. It is interesting to note that for all the magnifications used, Df turned out to be higher for the N-P sample than for the G-P sample. The fact that Df is expected to be a measure of the complexity of the structure, the above result should suggest that the structure is more complex for the N-P sample than for the G-P case, contrary to the visual appearance as seen in Fig. 7 and 8. Furthermore, Dierking43 showed that the polymer curing performed at higher temperatures resulted in reduced Df values for the formed networks. Considering that the gelation occurs at a temperature much below the isotropic-nematic point, the presently studied system has the opposite behaviour with the G-P sample having a lower Df value.
A trivial difference that could be the reason for the opposite behaviour is that the case in ref. 43 discusses a single network system, unlike hierarchical networks in our case. More importantly, branching of the network has been proposed as a control parameter for Df, with lower branching leading to higher fractal dimensionality.38 As evidently observed in the SEM images, the N-P case has straighter and oriented polymer fibres resulting in lower branching, causing Df to be higher. It is possible that in the case studied here, the branching mechanism is more dominant than the thermal effect. This viewpoint is further confirmed by the fact that as shown in Fig. 9(a), the Df values for the G-P and N-P situations approach each other as the magnification is increased, or in other words the probing was performed on much smaller length scales, which should reduce the branching effect. In fact, it is interesting to note that in the G-P sample, the rate at which Df increases towards the saturated value at higher magnifications, unlike the N-P case, which seems to be independent of the magnification.
As stated earlier, if the fractal dimension is indeed a robust measure of the complexity of the structure,47 then, as the magnification increases, the complexity decreases for the G-P case but increases for the N-P sample, although the effect is much less for the latter. The voids or the porous network becoming more lucid at higher magnifications could also be the reason for this. We should hasten to add that the values for the two samples asymptotically reach a single value, which is indicative of their similar morphology at highly local (very small length scale) levels. We could interpret that on such a small scale, complexity in the structures/formation of the polymer networks occurs more or less in a similar fashion regardless of the polymerizing temperature. The weak magnification-dependence of Df for the N-P case reveals better homogeneity of the networks formed.43 Owing to the complexity and the ability to characterize an image, there are reports suggesting that the Df values could sometimes be quite different depending on the software employed for the analyses.50 In order to confirm the analyses performed using ImageJ, we utilised another open-source tool- ‘Fractalyse’ for extracting the fractal dimensionality. Not only are the Df values from both the software agree well, but features like the trend of N-P showing higher dimensionality than G-P, and values for both N-P and G-P becoming similar at high magnifications, are also confirmed, as indeed seen in Fig. 9(b). A point to be noted is that the software generated error bar for Df is quite high in Fractalyse as against that from ImageJ, obtained from the straight line fit (see Fig. 9); the protocol used for error calculation by Fractalyse is not known. A more detailed and controlled investigation towards these aspects with regards to the number of nucleation centres available and temperature of polymerisation is to be carried out in order to obtain better clarity about the morphological changes and the pattern formation. Further studies are also required to establish the fact that the branching is the more important parameter than the temperature in fixing the Df values in such hierarchical networks. Apart from the regular box counting method, we have also carried out fractal dimension dependency on the grid rotation/rotation angle of the image through a process termed as ‘modified box counting method’. This procedure for asymmetric images is known to exhibit an initial decrease in the value of Df and an increase further on.51 Similar behaviour is showcased by the G-P sample, as shown in Fig. S6 (ESI†). It is interesting to note that the variation with rotation angle is quite small and the minimum value agrees (within errors) with that from the regular box counting method as shown in Fig. 9.
3.2 Effect on gelation temperature
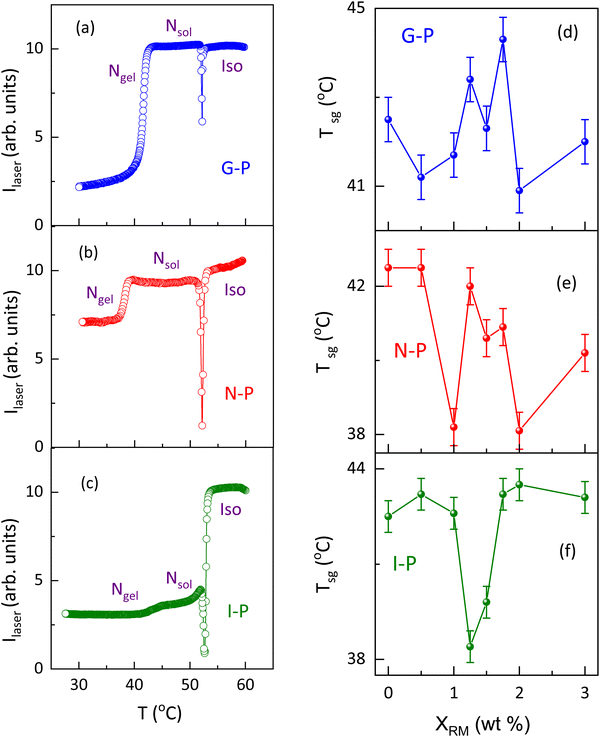
As stated in the introduction section, for samples thinner than a critical value, the sol–gel temperature (Tsg) has been seen to be strongly dependent on the sample thickness.15 Presuming that such a feature could be arising owing to confined geometry features, we looked at the effect on Tsg caused by the presence of the polymer strands. The thermal variation of the transmitted laser intensity, employed to determine Tsg is shown in Fig. 10(a–c) for a representative concentration, XRM = 1. The nematic to isotropic transition is marked by a strong change in the transmitted laser intensity (Ilaser), the midpoint of which is taken as TNI, the N–I transition temperature.The TNI values are seen to be marginally affected (<1 K) by the temperature at which the polymerization is performed or by the concentration of the polymer, XRM (see Fig. S7, ESI†). In contrast, gelation is marked by a step-like reduction in Ilaser, the step height being maximum for the G-P sample and least for the I-P sample. To avoid problems with the weak variations in the latter case, the gelation temperature was obtained as the peak point of the first differential of the data (Ilaservs. T). Even at a qualitative level, it is clear from Fig. 10(a–c) that Tsg is significantly dependent on the temperature at which the polymerization was performed. Similar experiments were performed by varying the polymer content, and the Tsg values obtained as a function of XRM for the G-P, N-P, and I-P samples are shown in Fig. 10(d), (e), (f), respectively. While for all the situations Tsg is non-monotonic with XRM, its behaviour is simpler for the I-P case. On the other hand, the N-P and G-P cases show more complicated behaviour, as evident from Fig. 10(d) and (e). Since the transition temperature exhibiting a non-monotonic change with the concentration of the dopant has been observed earlier, for example, in aerosil/LC composites, a case wherein restricted geometry effects are argued to play a significant influence, we discuss it as follows. Aerosil particles are siloyl spheres of 7 nm diameter and have a surface decoration of OH groups. When dispersed in a suitable liquid medium, including liquid crystals, the particles form a hydrogen-bonded network amongst themselves. The created 3D cage-like thixotropic structure imposes a finite-size confinement effect as well as the random-field effect on the involved phase transitions of the liquid (or LC) medium. Such an influence has been studied on the N–I, smectic, and reentrant nematic phase transitions, and even rotator phases.52–58 For example, with octyl/octyloxy cyanobiphenyl as the LC, Roshi et al.59 found that a high degree of non-monotonicity existed in the transition temperatures as the aerosil concentration was increased, with the maximum downward deviation of 1–2 °C for a concentration of ∼10% aerosil particles. In light of these observations, it may be noted that the deviations observed for the sol–gel transition in the present case of polymer confinement are much larger, despite the concentrations of the dopant (XRM) being much smaller.
A point that must be borne in mind, however, is that a direct comparison between the type of network formation in the present scenario and the LC + aerosil mixture may not be appropriate. Although, in both cases, networking is due to weak hydrogen bonding, the key difference is in the nature of the gel formation. In the aerosil case, it is the silica spheres that hydrogen bond together to form a random irreversible gel, whereas in the present case, HSA molecules undergo a completely reversible sol–gel process. Additionally, when present, the polymerized network acts as a template for creating further confinement of the HSA molecules. The existence of the orientational order in both the N-P and G-P cases adds further dimensionality. In fact, Sharma60 reported that in LC + aerosil mixtures the calorimetric parameters differ between the (LC) oriented and un-oriented cases. It was also noted that in aligned LC hosts, aerosil gels are stiffer due to increased surface interaction between the aerosil and LC molecules, resulting in changes associated with enthalpy and transition temperatures. On similar lines, for the present case, when polymer strands are existing (N-P and G-P case), the hydrogen bonding of the HSA molecules will be assisted by the cage of RM82 networks. The non-monotonic variations in Tsg could be a combined result of the number of HSA molecules available to form hydrogen bonds and the alignment of polymer strands. In contrast, for the I-P case, the development of gel fibres is least affected as the polymer network formed is disconnected to the maximum extent, a fact supported by POM and SEM images.
The higher complexity of the networks involved and their mutual interactions could also be the reasons for the non-trivial behaviour of the Tsg on the polymerization temperature as well as with the variation of XRM. In a study of coexisting physical networks of self-assembled fibrillar networks (SAFINs) and self-assembled micellar networks (SAMINs), it has been comprehended that the mutual influence of the network rules the mechanical properties and thereby the network integrity and various other parameters in these organogels.39 It has also been stated that the presence of one network and the temperature at which it is forming either trigger or hinder the formation of a second network.39 Although, at present, we are not able to explain the non-monotonicity in Tsg, we can contemplate that the changes in gelation temperatures could be a combination of factors such as the monomer concentration and the temperature of polymerization, which in turn decides the hierarchy of the network to be formed. For instance, in the I-P case, the gel fibres could be formed without much challenge posed by the polymerized environment and hence Tsg is least affected (see Fig. 10(f)). On the other hand, in the N-P case, polymer strands are formed in correlation with the LC orientations. Hence, as XRM increases, dense, well-oriented, stronger strands are formed, which pose a more significant challenge for the weak gel fibers to form hydrogen bonding and gelate, resulting in complex behaviour of the gelation temperature shown in Fig. 10(e). Similarly, for the G-P case, the polymerization occurs in the presence of the gel fibre network yielding random polymer networks. Also, it should be noted that for all XRM, the deviation in Tsg is with respect to the XRM = 0 system. A point to be noted, especially in the N-P case, is that, once the polymerization is performed it can be expected that several HSA molecules get trapped inside the polymer fibre and thus in the subsequent thermal cycles, lack the freedom to participate in the gelation process. This should effectively diminish the concentration of the gelator.
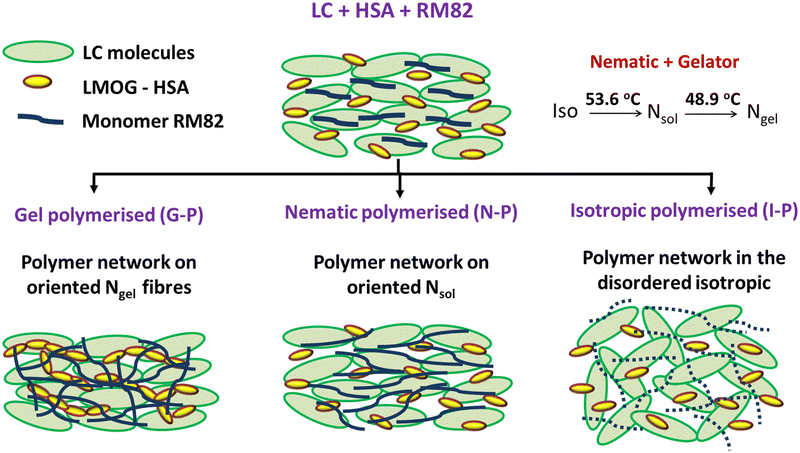
Another competing feature that can result due to the oriented polymer fibres formed in the N-P case is that a few HSA molecules present near the polymer fibre walls will have reduced thermal fluctuations and thus have a favour for better hydrogen bonding amongst themselves. This will in turn increase the sol–gel temperature. In all three cases, a feature that is invariably present is the reduced space available for the gel fibres to form, the reduction monotonically increasing with XRM. Thus, Tsg was determined by a combination of several of these factors. An overview of the impact of gelation temperature and its influence on polymerization due to temperature is tabulated in Table 1. Fig. 11 is a schematic overview of polymerization under the three conditions.
| Type of polymerisation parameters | Gel polymerised (G-P) (30 °C) | Nematic polymerised (N-P) (50 °C) | Isotropic polymerised (I-P) (60 °C) |
|---|---|---|---|
| Environment | Nematic oriented gel fibres | Oriented NLC without gel fibres | No orientation either for NLC or gel fibres |
| Influence on polymerisation | Influenced by the network of existing gel fibres leading to not so oriented polymer networks | Solely influenced by NLC orientation leading to well aligned polymer strands | Random polymerisation leading to weak/short polymer strands |
| Impact on gelation temperature (Tsg) | Complex | Complex | Simple |
| Already gel fibres were present during polymerisation | Existing well aligned polymer strands challenge the growth of gel fibres in the nematic environment | As weak/short polymer strands are formed, it reduces the restrictions for gel formation |
3.3 Smart window application
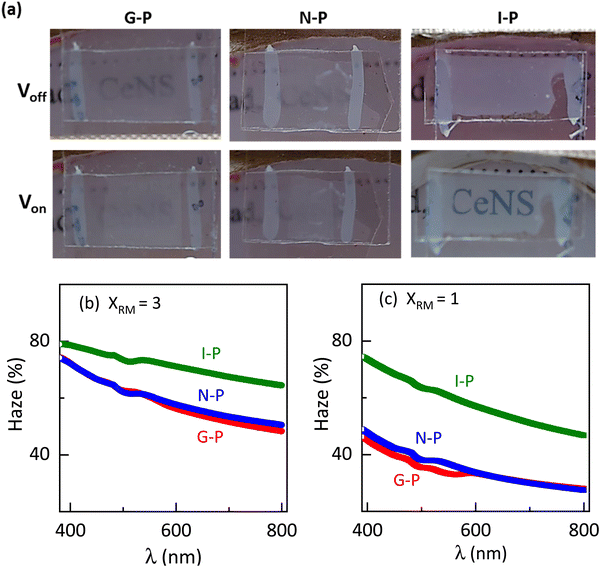
Encouraged by the visual appearance of the sample cells formed under the three conditions, we contemplated fabricating a smart window application that worked on the following principle. Normally, a nematic polymerised PSLC device operates from a transparent to a scattering state on the application of voltage. But we can reverse this behaviour when polymerised in the isotropic phase. The I-P samples operated in a scattering state, which when sufficient voltage was applied became transparent as can be visualised from Fig. 12(a). Such devices have been proposed to be the next-generation solution for low-energy consuming dwellings, privacy windows, etc.23,61 An essential parameter considered for fabrication of such a window in the equilibrium (no-voltage) state is the haze, defined as the amount of light scattered by the sample. The required spectroscopic measurements were performed over the entire visible region employing the methodology summarized in Fig. S2 (ESI†), and the haze factor was calculated using eqn (1). The spectra determined for samples XRM = 1 and 3 under the three polymerization conditions are presented in Fig. 12(b) and (c). Apart from the overall haze factor being higher for XRM = 3 than for XRM = 1 mixture, surprisingly, the I-P samples have higher haze values than their N-P or G-P counterparts. Increased scattering for XRM = 3 can be explained based on the density of the polymer fibres present: the denser the network, the higher the scattering ability. Meanwhile, increased haze for I-P is the consequence of the larger population of short fibres having no orientational order in the isotropic environment. This randomness in the network, associated with the mismatch in the refractive indices of the LC and RM82 regions is the key reason for the increased scattering. Hence, from a device fabrication point of view, it may be said that it is ideal to polymerize in the isotropic phase, although we agree that there is much room for improving its scattering ability. We believe that a careful interplay of monomer and gelator concentrations can bring out this aspect in a more refined way. Visual evidence of these features is well brought out in the images of the devices with the I-P sample having the highest scattering (Fig. 12(a)).3.4 Electric behaviour
 | (3) |
4. Summary
We have carried out investigations by employing two networks formed through polymer and gelator in an anisotropic nematic host. Temperature (or mesophase) dependent polymerization is involved, which helped us in realizing the impact of liquid crystal orientation on the networks being formed and their mutual influences as well. Increased arbitrariness was observed for the gel polymerized samples compared to nematic and isotropic polymerized samples, which are corroborated by detailed morphological investigations using POM and SEM characterizations. The SEM image analysis reveals that the N-P sample exhibited 3 times larger porosity compared to the G-P sample, indicating the amount of LC trapped between the polymer networks. Fractal dimension, Df indicates more complexity shown by N-P samples in comparison with the G-P case. The gelation temperature varies in a non-monotonic fashion with the concentration of the monomer. It is observed that the impact on the gelation temperature is more for N-P samples, intermediate for G-P, and least for I-P samples directing towards the formation of hierarchical networks. Haze measurement indicated that the I-P sample demonstrates better scattering ability compared to G-P and N-P samples. The observed features were explained based on the hierarchy of the two physical networks-polymer and gel networks formed and their mutual interaction. We believe that these experiments comprise double networks in liquid crystals and have paved a distinct approach in the field of LC research.Conflicts of interest
There are no conflicts of interest to declare.Acknowledgements
Dr D. S. Shankar Rao and Dr S. Krishna Prasad acknowledge the funding support from a SERB project numbered CRG/2019/001671.References
- S. Dutta and S. Krishna Prasad, Phys. Chem. Chem. Phys., 2018, 20, 24345–24352 RSC.
- M. Vijay Kumar, S. Krishna Prasad, D. S. Shankar Rao and E. P. Pozhidaev, Phase Trans., 2013, 86, 323–338 CrossRef.
- M. Mizukami, N. Ohta, K. Tomita, T. Yanagimachi, Y. Shibuya, N. Yagi and K. Kurihara, Phys. Chem. Chem. Phys., 2021, 23, 131–138 RSC.
- I. Dierking, Polymer-modified Liquid Crystals, Royal Society of Chemistry, UK, 2019 Search PubMed.
- Y. K. Fung, D. K. Yang, S. Ying, L. C. Chien, S. Zumer and J. W. Doane, Liq. Cryst., 1995, 19, 797–801 CrossRef CAS.
- T. Kato, Y. Hirai, S. Nakaso and M. Moriyama, Chem. Soc. Rev., 2007, 36, 1857–1867 RSC.
- Y. G. Marinov, G. B. Hadjichristov, A. G. Petrov and S. K. Prasad, Composites, Part B, 2016, 90, 471–477 CrossRef CAS.
- J. Leys, C. Glorieux and J. Thoen, J. Non. Cryst. Solids, 2010, 356, 597–601 CrossRef CAS.
- T. Kato, J. Uchida, T. Ichikawa and T. Sakamoto, Angew. Chem., Int. Ed., 2018, 57, 4355–4371 CrossRef CAS PubMed.
- Z. Wei, Y. Deng, M. Yu and H. Yu, Liq. Cryst., 2020, 47, 1170–1179 CrossRef CAS.
- Y. Ni, X. Li, J. Hu, S. Huang and H. Yu, Chem. Mater., 2019, 31, 3388–3394 CrossRef CAS.
- V. V. Mohanan, B. Pradhan, V. Sridurai, C. V. Yelamaggad, A. S. Achalkumar and G. G. Nair, Nanoscale, 2018, 10, 15686–15695 RSC.
- S. Vimala, S. M. Sathya, G. G. Nair, S. K. Prasad and C. V. Yelamaggad, J. Mater. Chem. C, 2016, 4, 11313–11320 RSC.
- H. Shahsavan, A. Aghakhani, H. Zeng, Y. Guo, Z. S. Davidson, A. Priimagi and M. Sitti, Proc. Natl. Acad. Sci. U. S. A., 2020, 117, 5125–5133 CrossRef CAS PubMed.
- G. V. Varshini, S. Parthasarathi, D. S. Shankar Rao and S. Krishna Prasad, Soft Matter, 2022, 18, 8792–8803 RSC.
- I. Dierking, Polym. Chem., 2010, 1, 1153–1159 RSC.
- D. S. Hou, L. Zheng, D. P. Sun, X. Zhou, J. L. Zhu and W. M. Han, Liq. Cryst., 2021, 49, 201–208 CrossRef.
- A. V. Kaznacheev, E. P. Pozhidaev, S. I. Torgova, V. A. Barbashov and V. V. Kesaev, Opt. Mater. Express, 2020, 10, 3030–3040 CrossRef.
- M. H. Saeed, S. Zhang, Y. Cao, L. Zhou, J. Hu, I. Muhammad, J. Xiao, L. Zhang and H. Yang, Molecules, 2020, 25, 5510 CrossRef CAS PubMed.
- Y. Zhang, C. Wang, W. Zhao, M. Li, X. Wang, X. Yang, X. Hu, D. Yuan, W. Yang, P. Lv, J. He and G. Zhou, Polymer, 2019, 11, 1869 CAS.
- N. Nasir, H. Hong, M. A. Rehman, S. Kumar and Y. Seo, RSC Adv., 2020, 10, 32225–32231 RSC.
- B. Kamaliya, M. Vijay Kumar, C. V. Yelamaggad and S. Krishna Prasad, Appl. Phys. Lett., 2015, 106, 083110 CrossRef.
- S. Krishna Prasad, M. Baral, A. Murali and S. N. Jaisankar, ACS Appl. Mater. Interfaces, 2017, 9, 26622–26629 CrossRef CAS PubMed.
- P. L. Madhuri, S. K. Prasad and G. G. Nair, RSC Adv., 2014, 4, 3121–3130 RSC.
- J. P. Gong, Y. Katsuyama, T. Kurokawa and Y. Osada, Adv. Mater., 2003, 15, 1155–1158 CrossRef CAS.
- E. S. Dragan, Pure Appl. Chem., 2014, 86, 1707–1721 CAS.
- S. Ishikawa, K. Iijima, D. Matsukuma, Y. Asawa, K. Hoshi, S. Osawa and H. Otsuka, Chem. Mater., 2020, 32, 2353–2364 CrossRef CAS.
- A. A. Aldana, S. Houben, L. Moroni, M. B. Baker and L. M. Pitet, ACS Biomater. Sci. Eng., 2021, 7, 4077–4101 CrossRef CAS PubMed.
- N. Raina, R. Rani, A. Khan, K. Nagpal and M. Gupta, Polym. Bull., 2020, 77, 5027–5050 CrossRef CAS.
- K. H. Yun, J.-C. Lee and J.-M. Seo, J. Korean Ophthalmic. Opt. Soc., 2019, 24, 109–115 CrossRef.
- R. Badugu, B. H. Jeng, E. A. Reece and J. R. Lakowicz, Anal. Biochem., 2018, 542, 94 CrossRef PubMed.
- S. Zhong and C. H. Jang, Biosens. Bioelectron., 2014, 59, 293–299 CrossRef CAS PubMed.
- K. G. Noh and S. Y. Park, Adv. Funct. Mater., 2018, 28, 170756 CrossRef.
- Y. Hirai, N. Mizoshita, M. Moriyama and T. Kato, Langmuir, 2009, 25, 8423–8427 CrossRef CAS PubMed.
- D. Yang, in Progress in liquid crystal science and technology, ed. H.-S. Kwok, S. Naemura and H. L. Ong, World Scientific, 2013, pp. 597–628 Search PubMed.
- M. Trudicova, J. Smilek, M. Kalina, M. Smilkova, K. Adamkova, K. Hrubanova, V. Krzyzanek and P. Sedlacek, Polymer, 2020, 12, 2561 CAS.
- V. Lotito and T. Zambelli, Adv. Colloid Interface Sci., 2020, 284, 102252 CrossRef CAS PubMed.
- G. M. Newbloom, P. De La Iglesia and L. D. Pozzo, Soft Matter, 2014, 10, 8945–8954 RSC.
- A. S. Krishnan, P. H. Vargantwar and R. J. Spontak, Soft Matter, 2012, 8, 12025–12033 RSC.
- A. K. Bisoi and J. Mishra, Pattern Recognit. Lett., 2001, 22, 631–637 CrossRef.
- K. M. Iftekharuddin and F. Ahmed, in Encyclopedia of Modern Optics, ed. D. G. Steel and R. D. Guenther, Elsevier, 2005, pp. 206–218 Search PubMed.
- Fractals in Science, ed. A. Bunde and S. Havlin, Springer, Berlin, 1994 Search PubMed.
- I. Dierking, J. Phys. D: Appl. Phys., 2002, 35, 2520–2525 CrossRef CAS.
- Y. Xia, J. Cai and W. Wei, in Modelling of Flow and Transport in Fractal Porous Media, ed. J. Cai, L. Zhang and W. Wei, Elsevier, 2021, pp. 11–24 Search PubMed.
- I. Dierking, Adv. Mater., 2003, 15, 152–156 CrossRef CAS.
- W. Zhao, J. Yan, G. Hou, P. Diwu, T. Liu, J. Hou and R. Li, Front. Chem., 2021, 9, 732797 CrossRef CAS PubMed.
- H. P. Tang, J. Z. Wang, J. L. Zhu, Q. B. Ao, J. Y. Wang, B. J. Yang and Y. N. Li, Powder Technol., 2012, 217, 383–387 CrossRef CAS.
- P. Satapathy, S. Parthasarathi, D. S. S. Rao, S. Bano, Y. S. Negi and S. K. Prasad, Appl. Phys. Lett., 2020, 117, 103702 CrossRef CAS.
- L. Turetta and M. Lattuada, Soft Matter, 2022, 18, 1715–1730 RSC.
- E. Hadzieva, D. C. Bogatinoska, L. Gjergjeska, M. Shumi-Noska and R. Petroski, ICT Innov. 2015 Web Proc., pp. 201–211.
- D. Ristanović, B. D. Stefanović and N. Puškaš, Theor. Biol. Forum, 2014, 107, 109–121 Search PubMed.
- M. V. Kumar and S. K. Prasad, RSC Adv., 2012, 2, 8531–8538 RSC.
- T. Jin and D. Finotello, Phys. Rev. Lett., 2001, 86, 818 CrossRef CAS PubMed.
- C. C. Retsch, I. McNulty and G. S. Iannacchione, Phys. Rev. E, 2002, 65, 032701 CrossRef PubMed.
- S. Park, R. L. Leheny, R. J. Birgeneau, J. L. Gallani, C. W. Garland and G. S. Iannacchione, Phys. Rev. E, 2002, 65, 050703 CrossRef CAS PubMed.
- M. Marinelli, A. K. Ghosh and F. Mercuri, Phys. Rev. E, 2001, 63, 061713 CrossRef CAS PubMed.
- B. Zhou, G. S. Iannacchione, C. W. Garland and T. Bellini, Phys. Rev. E, 1997, 55, 2962 CrossRef CAS.
- G. S. Iannacchione, C. W. Garland, J. T. Mang and T. P. Rieker, Phys. Rev. E, 1998, 58, 5966 CrossRef CAS.
- A. Roshi, G. S. Iannacchione, P. S. Clegg and R. J. Birgeneau, Phys. Rev. E, 2004, 69, 1–11 CrossRef PubMed.
- D. Sharma, Liq. Cryst., 2008, 35, 1215–1224 CrossRef CAS.
- M. Baral, K. Bramhaiah, N. S. John and S. Krishna Prasad, ACS Omega, 2019, 4, 403–411 CrossRef CAS PubMed.
Footnote |
| † Electronic supplementary information (ESI) available. See DOI: https://doi.org/10.1039/d3tc00991b |
| This journal is © The Royal Society of Chemistry 2023 |

