
 Open Access Article
 This Open Access Article is licensed under a
 Creative Commons Attribution 3.0 Unported Licence
Surface-enhanced Raman scattering detection of thiram and ciprofloxacin using chitosan–silver coated paper substrates†
Natércia C. T.
Martins
 *,
Sara
Fateixa
,
Helena I. S.
Nogueira
and
Tito
Trindade
*,
Sara
Fateixa
,
Helena I. S.
Nogueira
and
Tito
Trindade
CICECO-Aveiro Institute of Materials, Department of Chemistry, University of Aveiro, Campus Universitário de Santiago, 3810-193 Aveiro, Portugal. E-mail: natercia@ua.pt; Tel: +351 234 401 405
First published on 13th November 2023
Abstract
Fast detection of contaminants of emerging concern (CECs) in water resources is of great environmental interest. Ideally, sustainable materials should be used in water quality monitoring technologies implemented for such purposes. In this regard, the application of bio-based materials aimed at the fabrication of analytical platforms has become of great importance. This research merges both endeavors by exploring the application of chitosan-coated paper, decorated with silver nanoparticles (AgNPs), on surface-enhanced Raman scattering (SERS) spectroscopy studies of two distinct types of CECs dissolved in aqueous samples: an antibiotic (ciprofloxacin) and a pesticide (thiram). Our results indicate the superior SERS performance of biocoated substrates compared to their non-coated paper counterparts. The detection limits achieved for thiram and ciprofloxacin using the biocoated substrates were 0.024 ppm and 7.7 ppm, respectively. The efficient detection of both analytes is interpreted in terms of the role of the biopolymer in promoting AgNPs assemblies that result in local regions of enhanced SERS activity. Taking advantage of these observations, we use confocal Raman microscopy to obtain Raman images of the substrates using ciprofloxacin and thiram as molecular probes. We also demonstrate that these biobased substrates can be promising for on-site analysis when used in conjunction with portable Raman instruments.
1. Introduction
Water pollution due to increasing levels of contaminants of emerging concern (CECs) has become a serious worldwide problem due to its implications for animal life and human health. Pharmaceuticals and pesticides are some of the most common CECs found in water sources.1 They can enter water bodies through several pathways. In the case of pesticides, runoff from agricultural fields is a primary source of water contamination.2 When pesticides are applied to fields, they can be carried away by rainwater or irrigation, resulting in runoff that contaminates nearby rivers, lakes, and groundwater. Pharmaceuticals, such as antibiotics, antidepressants or beta-blockers, find their way into water mainly through human excretion.3 Other sources include pharmaceutical manufacturing waste and veterinary drug use in livestock. Then, these pharmaceutical compounds can enter the environment when wastewater is inadequately treated or discharged directly into water bodies. The presence of pesticides and pharmaceuticals in water, even in low concentrations, poses a severe risk to human health.4,5 Human exposure to pesticides has been linked with several diseases such as cancer, hormone disruption, asthma and allergies.4 On the other hand, the contamination of water with antibiotics can lead to the development of antibiotic-resistant bacteria, making infections more difficult to treat.3,5 Thus, monitoring the levels of CECs in water sources is crucial for assessing risks to the environment and human health, implementing effective management strategies, and ensuring regulatory compliance.In the past few years, surface-enhanced Raman scattering (SERS) spectroscopy has been explored as a powerful tool in water quality monitoring due to its ability to detect trace levels of several contaminants, including pesticides and pharmaceuticals.6–11 The SERS technique relies on the interaction of analyte molecules with metal surfaces, particularly those of gold and silver colloids, which greatly amplify the Raman signal, enabling the detection of low analyte concentrations.12,13 The SERS effect is the result of the contribution of two mechanisms: the electric field enhancement due to the metal surface (electromagnetic mechanism) and the chemical interaction, namely charge transfers, of the analyte molecules with the metal surface (chemical mechanism).12,13 SERS offers several advantages over conventional techniques for the detection of water pollutants. SERS is a non-destructive technique that requires minimal sample preparation. The analysis of water samples can frequently be conducted without extensive pre-concentration or purification procedures, thereby minimizing the time and effort necessary for analysis. Moreover, SERS permits fast on-site detection of pollutants if portable Raman instruments are available, thus reducing the time required for sample transportation and laboratory analysis.14–16
The substrates used in SERS analysis greatly impact the performance and reliability of the technique. The choice of substrate materials, morphology, and fabrication techniques can significantly influence the enhancement of Raman signals, reproducibility of results, and overall sensitivity of the SERS analysis.13,17 Therefore, great efforts have been devoted to developing SERS substrates with optimized sensitivity and reproducibility. Hydrophobic SERS substrates are attracting significant attention because, under certain conditions, they allow the analyte molecules to concentrate in a smaller area of the sensor, thereby increasing its sensitivity. Several hydrophobic SERS substrates with high sensitivity for detecting pesticides and antibiotics can be found in recent literature reports.18–21 However, many of these substrates have been fabricated using non-biodegradable materials or hazardous chemicals. By opting for sustainable materials, such as biodegradable polymers, the production and disposal of SERS substrates can be made more environmentally friendly.
Recently, our group reported the fabrication of hydrophobic, low-cost and sustainable SERS substrates by the deposition of AgNPs on office paper coated with chitosan (CH).22 The substrates showed high sensitivity and reproducibility for crystal violet (CV) detection. A considerable increase in the SERS intensity was observed for the biocoated substrates when compared with the substrates prepared with non-coated paper. In particular, the detection limit for CV in water was a hundred times lower using the Ag/CH substrate. It is known that the chemical nature of the analyte has a marked influence on the SERS substrate efficiency. Therefore, this research has focused on challenging issues that are relevant to the use of such SERS substrates for analytical applications, such as the detection of CECs and on-site chemical detection. Thus, SERS analysis and Raman imaging have been successfully applied to the detection of thiram and ciprofloxacin dissolved in water. Furthermore, we demonstrate the usefulness of the biocoated paper substrates for on-site SERS analysis using a portable Raman instrument. These new findings put into perspective the applications of these materials in other practical analytical contexts.
2. Experimental section
2.1 Materials
The following chemicals were used as received: silver nitrate (AgNO3, >99.0%, Sigma-Aldrich), sodium citrate tribasic dihydrate (Na3C6H5O7·2H2O, 99%, Sigma-Aldrich), glycerol (C3H8O3, 99%, Sigma-Aldrich), chitosan (from shrimp shells, with a deacetylation degree of ≥75% and an average molecular weight of 146![[thin space (1/6-em)]](https://www.rsc.org/images/entities/char_2009.gif) 000 g mol−1, Sigma-Aldrich), ciprofloxacin hydrochloride (C17H18FN3O3·HCl·H2O, 99%, Sigma-Aldrich), thiram (C6H12N2S4, ≥98.0%, Sigma-Aldrich), and ethanol absolute anhydrous (CH2CH3OH, VWR). Ultrapure water (18.2 MΩ cm, 25 °C, MilliQ, Millipore) was used to prepare Ag colloids and aqueous solutions of the analytes. A4 office paper sheets with a grammage of 80 g m−2 (Xerox, business grade) were used as platforms for printing SERS substrates.
000 g mol−1, Sigma-Aldrich), ciprofloxacin hydrochloride (C17H18FN3O3·HCl·H2O, 99%, Sigma-Aldrich), thiram (C6H12N2S4, ≥98.0%, Sigma-Aldrich), and ethanol absolute anhydrous (CH2CH3OH, VWR). Ultrapure water (18.2 MΩ cm, 25 °C, MilliQ, Millipore) was used to prepare Ag colloids and aqueous solutions of the analytes. A4 office paper sheets with a grammage of 80 g m−2 (Xerox, business grade) were used as platforms for printing SERS substrates.
2.2 Preparation of chitosan coated papers
Office paper was modified with chitosan (CH) by coating it with a gel of this polymer using the procedure described in our previous work.22 Briefly, 0.43 g of CH was mixed with 12 mL of 1% acetic acid solution. The mixture was vigorously hand-stirred using a spatula until a clear colorless gel was formed. The gel was allowed to rest for 16 hours to eliminate air bubbles created during the gel formation process. After that, office paper was coated with the gel using a rod-coating technique.22 Two layers of CH gel were deposited on paper, and between each layer, the paper was allowed to dry for 30 minutes at room temperature. At the end of the procedure, the papers were dried in an oven at 80 °C for 3 minutes. Five replicates of CH coated paper were prepared. Before their characterization, all coated papers were conditioned at 23 ± 1 °C and 50 ± 5% RH for 3 days. Papers with an average coating weight of 3.1 ± 0.2 g m−2 were obtained. The coating weights were calculated by subtracting the weight of the paper sheets before and after the coating procedure.2.3 Inkjet printing of Ag paper-based SERS substrates
Silver colloids were prepared by reducing AgNO3 with sodium citrate.23 Typically, an aqueous solution of AgNO3 (120 mL, 1 mM) was boiled under reflux and vigorously stirred for 10 min. Then, a sodium citrate solution (2.4 mL, 1% w/v) was added dropwise to the boiling silver nitrate solution. After 45 min of reflux, the resulting sand-colored colloid was cooled to room temperature. Prior to inkjet printing, the properties of the Ag colloids were evaluated. The STEM analysis of the Ag colloids showed a polydisperse sample with particles with an average size ranging from 47 to 132 nm (Fig. S1†). Most of the particles have a spheroidal shape; however, as expected for the method used, a small percentage of particles with different shapes (rods, triangles, and squares) was also found.24,25 The colloidal AgNPs exhibited a negative surface charge (−37.6 ± 10.1 mV at pH 6.7), as determined by zeta potential measurements, which accounts for the presence of citrate as a capping agent.The synthesized colloid was centrifuged at 6000 rpm for 20 min and 94% of the supernatant was removed to achieve a final concentration factor of 17×. Ag ink was prepared by mixing the concentrated Ag colloid (7.2 mL) with glycerol (1.8 mL). Here, glycerol had two functions: adjusting the viscosity of the ink for optimal printing and preventing the ink from drying on the printheads.25 The Ag concentration on the final ink was determined by inductively coupled plasma-optical emission spectrometry (ICP-OES), and a value of 0.140% (w/v) was obtained.
The Ag ink was injected into a refillable ink cartridge and was used to print SERS substrates (0.5 cm × 0.5 cm) on paper (bare office paper or CH modified office paper) using a piezoelectric printer (Epson Expression Home XP-255). To increase the local concentration of AgNPs on paper, the substrates prepared in this work were obtained after 10 printing cycles. The substrates were identified as Ag/CH substrates.
2.4 SERS measurements and Raman imaging
The sensitivity and homogeneity of paper-based substrates for the detection of thiram and ciprofloxacin were evaluated by SERS analysis coupled with Raman imaging. Stock solutions of ciprofloxacin (2 mM) and thiram (1 mM) were prepared in water and ethanol, respectively, and then successive dilutions were prepared in water. An aliquot (10 μL) of the analyte solution was dropped on substrates, taped on a glass slide, and allowed to dry in air. High-resolution Raman imaging was performed by recording 150 × 150 Raman spectra (in total 22500 spectra) in an area of 30 × 30 μm with an acquisition time of 0.1 s. The laser wavelength and power were 633 nm and 2.5 mW for thiram and 532 nm and 11 μW for ciprofloxacin, respectively. Raman maps were constructed by integrating the absolute area underneath specific Raman bands of thiram (1376 cm−1) and ciprofloxacin (1391 cm−1). A total of 50 spectra were extracted from the brighter yellow areas of the Raman map (areas where the analyte is adsorbed onto the metal resulting in the strongest SERS signal of the chosen band) of each substrate, and an average Raman spectrum was obtained using WITec software project 5.3+. Background subtraction was performed for all Raman spectra and images using the shape function (shape size: 300; noise factor: 2) of the Graph Background subtraction (WITec project 5.3+).
The detection limit for all analytes was considered the lowest concentration for which a Raman signal of the analyte was distinct from the background noise. The signal-to-noise ratio was calculated using the average peak height of the Raman band  obtained from 4 spectra divided by the square root of the standard deviation of the peak height (σy).26
2.5 Instrumentation and material characterization
Scanning transmission electron microscopy (STEM) micrographs of the Ag colloid were acquired using a Hitachi HD2700 instrument operated at 200 kV. An aliquot of the diluted colloid was deposited on the surface of an Agar Scientific carbon-coated copper grid and then left to dry in air. Scanning electron microscopy (SEM) micrographs of the paper samples were obtained with a Hitachi SU-70 instrument fitted with an energy dispersive spectroscopy (EDS) accessory (EDS detector: Bruker AXS; software: Quantax), operated at 4 kV. The samples were placed on carbon tape and coated with carbon before SEM analysis. The inductively coupled plasma-optical emission spectroscopy (ICP-OES) analysis was carried out using Jobin Yvon Activa M equipment. Zeta potential measurements of the Ag colloid were performed using Malvern Zetasizer Nano ZS equipment. The wettability of the paper substrates was evaluated by static water contact angle (WCA) measurements using an OCA 20 goniometer (DataPhysics Instruments GmbH). The measurements were performed after 20 seconds, 5 minutes and 10 minutes of the deposition of water droplets of 3 μL on the substrates. The values of WCA presented in this work are the average of at least 4 measurements. Raman spectra and images were acquired using a Raman-AFM-SNOM WITec alpha300RAS+ confocal spectrometer. A Nd:YAG laser operating at 532 nm or a He:Ne laser operating at 633 nm were used as excitation sources. The portable Raman SERS experiments were performed using the portable Raman spectroscopic module C13560 from Hamamatsu Photon Business with the sample excitation source operating at 785 nm (1 mW). Each Raman spectrum was acquired with ten acquisitions, 2 s each acquisition.
3. Results and discussion
3.1 SERS detection of water pollutants using Ag/CH paper substrates
In this research, the applicability of Ag/CH paper substrates to detect pesticides and antibiotics in water samples was evaluated using thiram and ciprofloxacin (molecular structures are shown in Fig. S2†) as molecular models. Thiram is a dimethyldithiocarbamate pesticide used to prevent crop damage in the field and to protect harvested crops.27 On the other hand, ciprofloxacin is an antibiotic of the fluoroquinolone group widely used to treat bacterial infections in humans and animals.28 The intensive use of both chemicals poses a potential threat to the aquatic biota and human health because, ultimately, there are vestiges discarded into the water. Therefore, exposure to these chemicals through the consumption of contaminated water can lead to severe health problems.29,30 Thus, monitoring the levels of these contaminants in the water is very important as a preventive measure to protect public health and the environment.First, the Ag/CH substrates were tested to detect thiram dissolved in water. A drop of an aqueous solution (100 μM, 10 μL) of thiram was placed on the paper substrate, and after drying, the SERS analysis was performed. Fig. 1A shows the Raman image obtained by monitoring the band of thiram at 1376 cm−1 after sample deposition on an Ag/CH substrate. In the Raman image, the brighter yellow areas correspond to the regions where a stronger SERS signal was detected for the thiram molecules adsorbed onto Ag particles. Fig. 1A shows the brighter yellow areas homogeneously distributed on the substrate surface, indicating that the AgNPs are evenly dispersed over the surface of the Ag/CH substrate. In fact, SEM images of the substrate (Fig. 1B) show that the AgNPs are homogeneously distributed over the coated paper forming a layer with a high density of metal nanoparticles. A few agglomerates of small dimensions were also observed by SEM analysis. In principle, this type of surface texture, with a high density of plasmonic nanoparticles, is beneficial for obtaining high SERS sensitivity because it favors the formation of hotspots.13,31
 | ||
| Fig. 1 (A) Raman image obtained by integrating the area of the band at 1376 cm−1 of thiram (100 μM) adsorbed on the Ag/CH paper substrate; (B) SEM images of the Ag/CH paper substrate at different magnifications; (C) SERS spectrum of thiram (100 μM) obtained by the average of 50 Raman spectra, collected from the brighter areas of the Raman image (a) and the conventional Raman spectrum of thiram powder (b). | ||
Fig. 1C shows the SERS spectrum of thiram (100 μM) deposited on the Ag/CH substrate. For comparative purposes, the conventional Raman spectrum of thiram powder is also shown. The vibrational bands in the SERS spectrum of thiram were assigned according to the literature as follows: 341 cm−1ν(Ag–S); 440 cm−1, δ(CSS) and δ(CNC); 561 cm−1, νsym(CSS) coupled to ν(S–S); 931 cm−1ν(C–S); 1142 cm−1, ρ(CH3) + ν(N–CH3); 1376 cm−1ν(C–N) coupled to δsym(CH3); 1500 cm−1ν(CN).32–34Table 1 presents in more detail the typical Raman bands of thiram powder and the corresponding SERS bands of the analyte molecules adsorbed onto the AgNPs present in the Ag/CH substrates.
| Raman (cm−1) | SERS (cm−1) | Assignments |
|---|---|---|
| 341 | ν(Ag–S) | |
| 359 | ν(CH3-NC) | |
| 392 | ν(S–S) | |
| 438 | 440 | δ(CSS) and δ(CNC) |
| 558 | 561 | ν sym(CSS) coupled to ν(S–S) |
| 850 | –CH3 groups (several vibrational modes) | |
| 973 | 931 | ν(C–S) |
| 1138 | 1142 | ρ(CH3) and ν(N–CH3) |
| 1372 | 1376 | ν(C–N) coupled to δsym(CH3) |
| 1396 | ν(C–N) | |
| 1452 | 1448 | δ asym(CH3) |
| 1500 | ν(CN) |
In comparison with the conventional Raman spectrum of the thiram powder, the SERS spectrum shows changes in the relative intensities of the bands, namely the Raman band at 1376 cm−1, which is enhanced in relation to the band at 561 cm−1. According to the literature, the preferential enhancement of the band at 1376 cm−1 is due to the proximity of the CH3 and CN groups to the surface of metal particles.35 On the other hand, the decrease in the intensity of the band at 561 cm−1 has been attributed to the cleavage of the S–S bond in the presence of the metal NPs.34 This cleavage produces two molecular residues that adsorb onto the metal by the two sulfur atoms (bidentate bonding). The absence of the band at 392 cm−1 in the SERS spectra of thiram, which is assigned to the S–S stretching vibration, also indicates the cleavage of the disulfide bond. Also, the appearance of a new band in the SERS spectra of thiram at 1500 cm−1 suggests the bidentate coordination of the thioureide form of thiram to the metal surface. Finally, the new band at 341 cm−1 in the SERS spectra, assigned to the Ag–S stretching mode, indicates the interaction between thiram molecules and the silver surface.
It should be noted that paper coated with CH without printing AgNPs was also tested under similar experimental conditions but did not result in any Raman signal of thiram (Fig. S3a†). These results confirm that the Raman spectrum of thiram adsorbed on Ag/CH papers is due to the SERS effect owing to the presence of the metal nanoparticles.
The Ag/CH substrates were further evaluated for the detection of lower traces of thiram. Fig. 2 shows the SERS spectra and Raman images of thiram deposited on the Ag/CH substrates from solutions with variable concentrations (10 μM to 0.01 μM). The SERS images show the spatial distribution of thiram molecules on the Ag/CH substrate. At low thiram concentrations (0.1 μM), the Raman image (Fig. 2C) shows discrete regions for the presence of the pesticide molecules, with only a few active Raman scattering sites present in the Ag/CH substrate (brighter colored areas). In the SERS spectra (Fig. 2D), all the characteristic Raman bands of thiram were clearly observed, even at lower concentrations. The detection limit of thiram using Ag/CH paper substrates was 0.1 μM (0.024 ppm). This value is well below the allowed maximum residue limit (MRL) for thiram in certain agricultural products of the supply chain (e.g. fruits: 2–10 ppm), as established by the Commission Regulation (EU) 2016/1.36
 | ||
| Fig. 2 (A–C) Raman images obtained by integrating the area of the band at 1376 cm−1 in the SERS spectra of the Ag/CH substrate treated with thiram solutions with variable concentrations (10 μM, 1 μM and 0.1 μM); (D) average SERS spectra of thiram at variable concentrations on the Ag/CH substrate. | ||
As shown in Fig. S4,† a good linear response of the peak intensities at 1376 cm−1 and the concentrations of thiram solutions ranging from 0.1 to 10 μM (R2 = 0.9901) was obtained, revealing that quantitative detection can be achieved in this concentration range.
The enhancement factor (EF) for detecting thiram (0.1 μM) using the Ag/CH substrate was calculated using the equation:29,32,37
| EF = (ISERS × Nbulk)/(Ibulk × NSERS) | (1) |
It must be highlighted that non-biocoated office papers printed with AgNP ink led to SERS detection limits of thiram ten times higher (0.24 ppm) than the value observed for the biocoated Ag/CH substrate, hence showing the importance of the paper treatment with CH gel for SERS detection (Fig. 3).
 | ||
| Fig. 3 SERS spectra of thiram at variable concentrations using office paper printed with AgNP ink as the substrate. | ||
The improved SERS performance of the Ag/CH substrates when compared with that of substrates prepared with bare office paper is interpreted as a consequence of the uniform deposition of the AgNPs on the paper surface (Fig. 1B and Fig. S5†) due to the low porosity and roughness of the biocoating.22 Moreover, the hydrophobic nature of the Ag/CH substrate causes an increase in the local concentration of the analyte at the substrate surface after dropping and drying an aliquot of the analyte (Fig. S6†). We hypothesized that the hydrophobic nature of the Ag/CH substrate is a result of molecular reorientations that occurred in chitosan during the drying process.22,38 Thus, the CH macromolecules tend to direct the polar groups toward the aqueous regions within cellulose, while positioning hydrophobic segments outwardly, as a means of minimizing overall surface energy.22 On the other hand, when a drop of analyte solution is deposited on paper non-coated with CH and printed with AgNPs, it rapidly spreads over a large area, thus reducing the sensitivity of the substrate (Fig. S6†). In this regard, it should be emphasized that no Raman signal was observed under similar setup conditions using biocoated papers without inkjet-printed Ag NPs.
The Ag/CH paper substrates were also tested for detecting ciprofloxacin. Fig. 4A shows the SERS spectra of ciprofloxacin at variable concentrations (2000 μM to 20 μM) using Ag/CH as the substrate. For comparative purposes, the conventional Raman spectrum of ciprofloxacin powder is also shown in Fig. 4B. The Raman bands observed in the SERS spectra of ciprofloxacin are in accordance with those reported in the literature and are assigned to the following vibration modes: 753 cm−1ρ(CH2); 1358 cm−1 mixed vibration (pyrazine ring); 1391 cm−1νsym(O–C–O); 1488 cm−1νasym(O–C–O); 1632 cm−1νasym(C![[double bond, length as m-dash]](https://www.rsc.org/images/entities/char_e001.gif) C, aromatic ring).28,39Table 2 presents in more detail the typical Raman bands of ciprofloxacin powder and the corresponding SERS bands of ciprofloxacin after adsorption onto the AgNPs present in the Ag/CH substrates. The bands observed in the SERS spectra match well with the Raman bands recorded in the spectra of the solid sample; however, there is a small shift and broadening of some of the bands due to the interaction of the analyte molecules with the AgNPs.
C, aromatic ring).28,39Table 2 presents in more detail the typical Raman bands of ciprofloxacin powder and the corresponding SERS bands of ciprofloxacin after adsorption onto the AgNPs present in the Ag/CH substrates. The bands observed in the SERS spectra match well with the Raman bands recorded in the spectra of the solid sample; however, there is a small shift and broadening of some of the bands due to the interaction of the analyte molecules with the AgNPs.
 | ||
| Fig. 4 (A) Average SERS spectra of ciprofloxacin at variable concentrations on the Ag/CH substrate; (B) Raman spectrum of (a) ciprofloxacin powder, (b) 2000 μM ciprofloxacin solution and (c) 4000 μM ciprofloxacin solution; (C and D) Raman images obtained by integrating the area of the band at 1391 cm−1 in the SERS spectra of the Ag/CH substrate treated with ciprofloxacin solutions. | ||
| Raman (cm−1) | SERS (cm−1) | Assignments |
|---|---|---|
| 639 | Ring breathing | |
| 670 | γ(C–N)ring + γ(C–F)ring | |
| 753 | 753 | ρ(CH2) |
| 1028 | δ(C–N)ring + δ(C–C)ring | |
| 1273 | Ring breathing | |
| 1348 | 1358 | Mixed vibration (pyrazine ring) |
| 1385 | 1391 | ν sym(O–C–O) |
| 1471 | 1488 | ν asym(O–C–O) |
| 1548 | ν ring (quinolone ring) | |
| 1625 | 1632 |
ν
asym(CC, aromatic ring) |
Raman spectra of ciprofloxacin solutions with concentrations of 4000 μM and 2000 μM were also recorded, as shown in Fig. 4B(b and c). For the concentration of 4000 μM, the Raman spectrum shows pronounced bands at 753, 1358, 1391 and 1639 cm−1, but these bands are not observed in more diluted solutions (2000 μM) used in the SERS experiments. Moreover, we must highlight that when paper coated with CH without printing AgNPs was used as the substrate, the Raman bands of ciprofloxacin were not detected (Fig. S3b†). This result confirms that the Raman spectrum of ciprofloxacin adsorbed on Ag/CH paper is due to the SERS effect owing to the presence of the metal nanoparticles.
The detection limit achieved for ciprofloxacin using Ag/CH paper substrates was 20 μM (7.7 ppm) (Fig. 4A). As shown in Fig. S7,† a good linear response of the peak intensities at 1391 cm−1 and the concentrations of ciprofloxacin solutions ranging from 20 to 2000 μM (R2 = 0.9848) was obtained. The EF for ciprofloxacin (20 μM) was calculated using eqn (1) and a value of 2.88 × 10² was obtained (see the ESI† for more details).
Fig. 4C and D show the Raman images of ciprofloxacin deposited on the Ag/CH substrates from solutions of different concentrations (2000 μM and 20 μM). The Raman images show the spatial distribution of ciprofloxacin molecules on the Ag/CH substrate. At a low concentration (20 μM), it is possible to observe only a few spots where the presence of ciprofloxacin molecules is detected (yellow spots).
When office paper non-coated with CH and printed with AgNPs was used as the substrate for the detection of ciprofloxacin, the Raman bands of the analyte were not observed (Fig. S3c†). This could be due to the lower density of AgNPs on the non-coated paper (Fig. S5†) and the hydrophilic nature of this type of paper.
Table 3 provides a tentative comparison between the performance of the Ag/CH substrates investigated in this work and other materials reported in the literature for detecting thiram and ciprofloxacin. The data in Table 3 indicate that the Ag/CH substrates reported here are in fact a viable alternative for the SERS detection of thiram and ciprofloxacin in water. It should be noted that the paper-based substrates reported in the literature that show a lower detection limit for thiram are made of filter paper and underwent hydrophobic treatments using hazardous reagents or non-biodegradable polymers. For the preparation of the substrates tested in this work, we have used office paper, which is much cheaper than filter paper, and a hydrophobic coating of a biodegradable polymer, which are clearly advantageous namely for comparable SERS performance in the analysis of CECs.
| SERS substrate | Analyte | The lowest quantified concentration | Ref. |
|---|---|---|---|
| AgNPs/office paper | Thiram | 10−5 M | 42 |
| AgNPs/nanocellulose fibers | Thiram | 2.0 × 10⁻⁷ M | 43 |
| Au:Ag:PAMAM/office paper |
Thiram | 10−7 M | 44 |
| AgNPs/CH/office paper | Thiram | 10−7 M | This work |
| AuNPs/filter paper | Thiram | 10−9 M | 45 |
| AuNPs/chromatographic paper | Thiram | 10−11 M | 46 |
| AgNPs/filter paper | Ciprofloxacin | 5.2 × 10⁻⁴ M | 47 |
| AgNPs/CH/office paper | Ciprofloxacin | 2.0 × 10⁻⁵ M | This work |
| AgNPs colloid | Ciprofloxacin | 1.3 × 10⁻⁵ M | 48 |
| Ag nanogratings | Ciprofloxacin | 2.6 × 10⁻⁶ M | 39 |
| Ag/TiO2 NPs | Ciprofloxacin | 10−9 M | 49 |
| AgNPs/PDA/MS sponge | Ciprofloxacin | 10−9 M | 9 |
The detection limit of ciprofloxacin using the Ag/CH paper substrate was 2.0 × 10⁻⁵ M. This value is higher than those reported by others9,39,48,49 when using the SERS technique; however, in neither case, paper was used as the substrate. To the best of our knowledge, only one report was found in the literature concerning the use of paper substrates for the detection of ciprofloxacin and a higher detection limit was achieved (5.2 × 10⁻⁴ M).47 Moreover, in this research, the substrates were fabricated using filter paper. Here, we have used common office paper which is considerably cheaper than filter paper.
The SERS performance of the Ag/CH substrates used in this work can be related to the high density of metal nanoparticles found on the surface of Ag/CH substrates, which favors the formation of hotspots causing better SERS signals for the analytes (electromagnetic mechanism). The Ag–S vibrational mode was detected in the SERS spectra of thiram, which can promote charge transfer between the metal and the analyte with a consequent increase of the Raman signal (chemical mechanism).50 In the case of ciprofloxacin, an electrostatic interaction with metal NPs can be considered. Ciprofloxacin solutions prepared in this work present a pH value of about 5. It is known that at pH < 6, ciprofloxacin is mainly in the cationic form due to the protonation of amine groups.51 We suggest that the cationic groups of the analyte interact electrostatically with the negatively charged carboxylate groups of citrate-coated AgNPs, contributing to an increase in the analyte's signal.52 On the other hand, chitosan coating of the paper substrates presents cationic groups and can possibly repel cationic ciprofloxacin molecules and guide them towards the AgNPs.
3.2 Detection of water pollutants using a portable Raman system
On-site analysis of water pollutants is of paramount importance since it ensures that contaminated water sources are identified promptly, reducing the risk of exposure to harmful substances. By detecting pollutants on-site, preventive measures such as issuing alerts, implementing water treatment processes or temporarily closing affected areas can be immediately taken in order to protect public health and avoid the consumption of contaminated water. The use of sustainable SERS substrates, like the ones described in this work, in conjunction with portable Raman instruments is a good choice for the on-site analysis of water pollutants, particularly in remote regions of the globe. Therefore, as a proof-of-concept, the performance of the Ag/CH paper-based substrates was tested using a portable Raman device.Fig. 5A shows the SERS spectra of thiram solutions with variable concentrations deposited on Ag/CH substrates but now using a portable instrument. All the characteristic Raman bands of thiram were clearly observed, and a detection limit of 1 μM was achieved. Although this value is ten times higher than the one obtained using the confocal Raman instrument, which is expected due to the differences in capabilities and sensitivity, it stands out because it is still a value below the MRL. The substrates were also tested for detecting ciprofloxacin at variable concentrations (Fig. 5B). The detection limit achieved for this antibiotic was 200 μM. It must be pointed out that when paper coated with CH and non-printed with AgNPs was used as the substrate, the Raman bands of thiram and ciprofloxacin were not observed (Fig. 5, blank sample). However, in the blank samples, two bands were observed at 1090 and 1126 cm−1, which were assigned to the ring and C–O stretching modes in cellulose and chitosan present on the paper.14,53 The band at 1090 cm−1 is still visible in the SERS spectra of the analytes using the Ag/CH paper-based substrate.
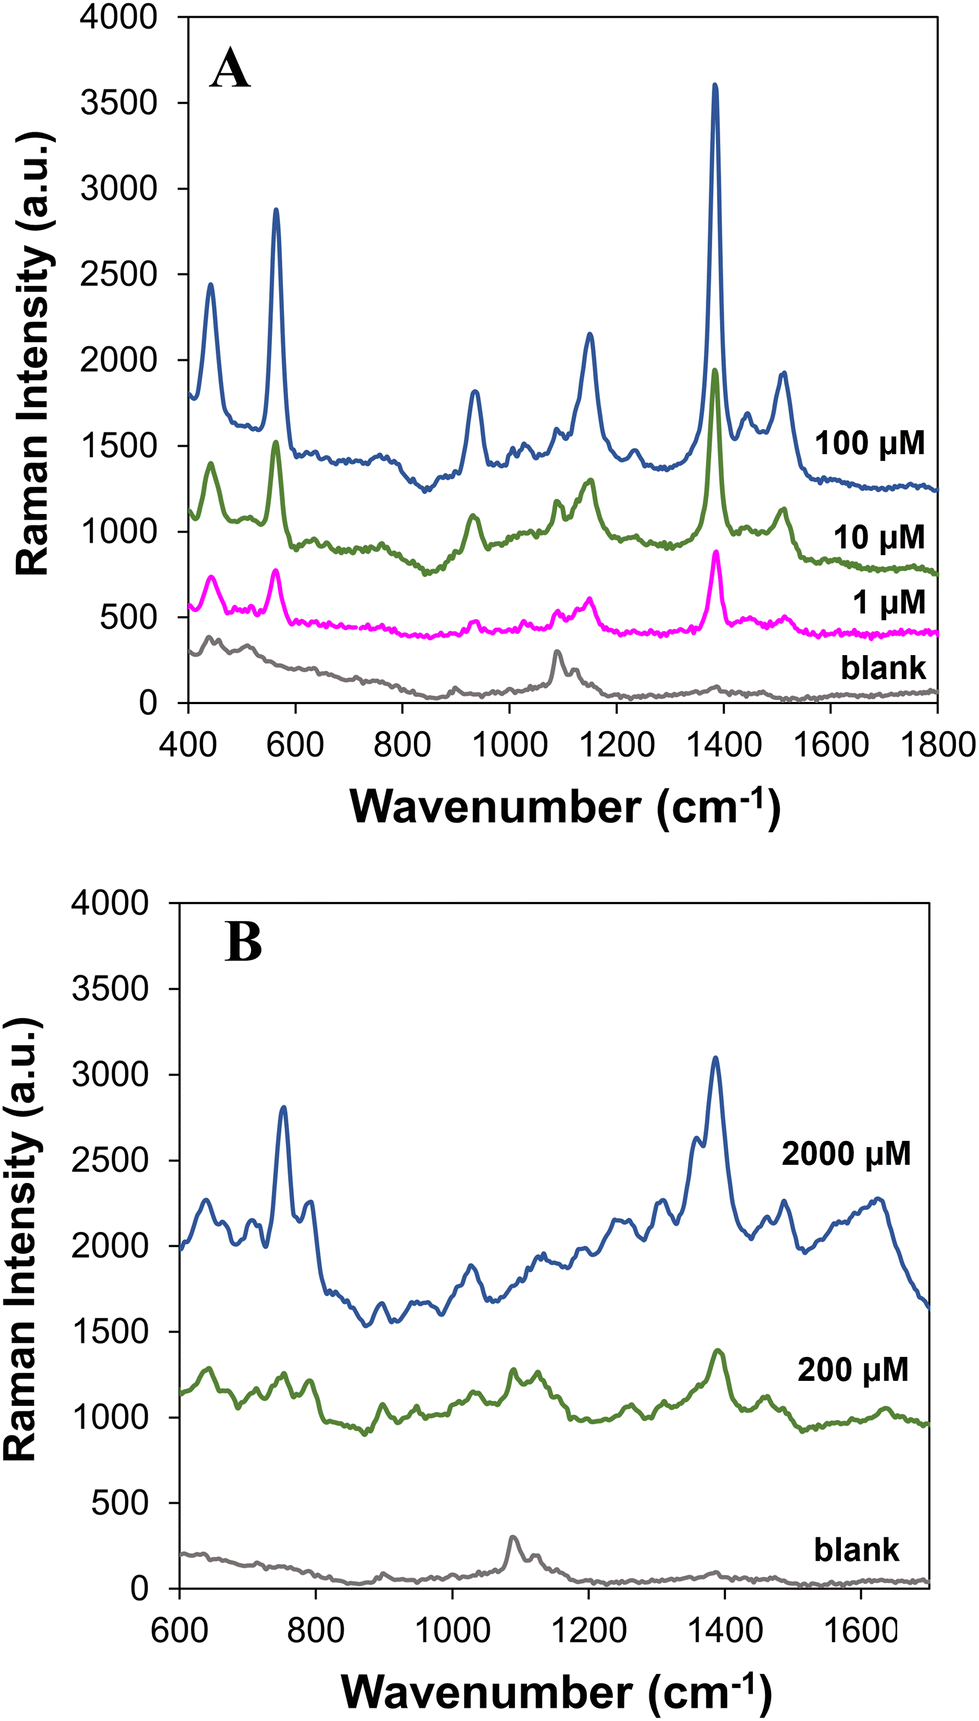 | ||
| Fig. 5 SERS spectra of thiram (A) and ciprofloxacin (B) at variable concentrations using the Ag/CH paper-based substrate in conjunction with a portable Raman device. Blank samples correspond to paper coated with CH, without Ag printing, with the addition of 100 μM thiram solution (A) or 2000 μM ciprofloxacin solution (B). | ||
4. Conclusions
In this work, we demonstrate that sustainable platforms based on paper biocoated with CH and AgNPs can be employed as efficient SERS substrates for the detection of contaminants of emerging concern (CECs) present in water.Using the Ag/CH substrate, the detection limit of thiram was ten times lower than that of the substrate fabricated with unmodified paper. Moreover, it was possible to detect ciprofloxacin in water with a detection limit of 20 μM. To the best of our knowledge, this is the lowest SERS detection limit reported for aqueous ciprofloxacin using a paper substrate. Furthermore, this research demonstrated that the SERS detection of the analytes under study using the biocoated paper substrates is not limited by the use of portable equipment.
Author contributions
Natércia Martins: conceptualization, methodology, validation, formal analysis, investigation, writing – original draft, and writing – review & editing. Sara Fateixa: methodology, validation, and writing – review & editing. Helena I. S. Nogueira: formal analysis, resources, and writing – review & editing. Tito Trindade: conceptualization, general scientific guidance, resources, writing – review & editing, and funding acquisition.Conflicts of interest
The authors declare that they have no known competing interests or personal relationships that could have appeared to influence the work reported in this paper.Acknowledgements
This work was developed within the scope of the project CICECO-Aveiro Institute of Materials, UIDB/50011/2020, UIDP/50011/2020 and LA/P/0006/2020, financed by national funds through the FCT/MCTES (PIDDAC). Natércia C. T. Martins and Sara Fateixa are funded by national funds (OE), through FCT – Fundação para a Ciência e Tecnologia, I.P., in the scope of the framework contract foreseen in the numbers 4, 5 and 6 of article 23, of the Decree-Law 57/2016, of August 29, changed by the law 57/2017, of July 19.References
- R. Tröger, H. Ren, D. Yin, C. Postigo, P. D. Nguyen, C. Baduel, O. Golovko, F. Been, H. Joerss, M. R. Boleda, S. Polesello, M. Roncoroni, S. Taniyasu, F. Menger, L. Ahrens, F. Y. Lai and K. Wiberg, Water Res., 2021, 198, 117099 CrossRef PubMed
.
- R. Bereswill, M. Streloke and R. Schulz, Environ. Toxicol. Chem., 2013, 32, 1254–1263 CrossRef CAS PubMed
- M.-C. Danner, A. Robertson, V. Behrends and J. Reiss, Sci. Total Environ., 2019, 664, 793–804 CrossRef CAS PubMed
- K.-H. Kim, E. Kabir and S. A. Jahan, Sci. Total Environ., 2017, 575, 525–535 CrossRef CAS PubMed
- E. Sanganyado and W. Gwenzi, Sci. Total Environ., 2019, 669, 785–797 CrossRef CAS PubMed
- N. Albarghouthi, P. MacMillan and C. L. Brosseau, Analyst, 2021, 146, 2037–2047 RSC
- A. C. Estrada, A. L. Daniel-da-Silva, C. Leal, C. Monteiro, C. B. Lopes, H. I. S. Nogueira, I. Lopes, M. J. Martins, N. C. T. Martins, N. P. F. Gonçalves, S. Fateixa and T. Trindade, Front. Chem, 2022, 10, 1011186 CrossRef CAS
- T. Fernandes, N. C. T. Martins, A. L. Daniel-da-Silva and T. Trindade, Spectrochim. Acta, Part A, 2022, 283, 121730 CrossRef CAS PubMed
- K. Wang, Y. Meng, X. Jiao, W. Huang, D. Fan and T. C. Liu, Food Anal. Methods, 2020, 13, 1947–1955 CrossRef
- R. Botta, P. Eiamchai, M. Horprathum, S. Limwichean, C. Chananonnawathorn, V. Patthanasettakul, R. Maezono, A. Jomphoak and N. Nuntawong, Sens. Actuators, B, 2020, 304, 127327 CrossRef CAS
- G. Bodelón and I. Pastoriza-Santos, Front. Chem, 2020, 8, 478 CrossRef
- J. F. Betz, W. W. Yu, Y. Cheng, I. M. White and G. W. Rubloff, Phys. Chem. Chem. Phys., 2014, 16, 2224–2239 RSC
- S. Fateixa, H. I. S. Nogueira and T. Trindade, Phys. Chem. Chem. Phys., 2015, 17, 21046–21071 RSC
- M. Sun, B. Li, X. Liu, J. Chen, T. Mu, L. Zhu, J. Guo and X. Ma, J. Mater. Sci. Technol., 2019, 35, 2207–2212 CrossRef CAS
- L. B. Berganza, L. Litti, M. Meneghetti, S. Lanceros-Méndez and J. Reguera, ACS Omega, 2022, 7, 45493–45503 CrossRef CAS PubMed
- A. Y. F. Mahmoud, C. J. Rusin and M. T. McDermott, Analyst, 2020, 145, 1396–1407 RSC
- M. Fan, G. F. S. Andrade and A. G. Brolo, Anal. Chim. Acta, 2020, 1097, 1–29 CrossRef CAS
- F. Shao, J. Cao, Y. Ying, Y. Liu, D. Wang, X. Guo, Y. Wu, Y. Wen and H. Yang, Sensors, 2020, 20, 4120 CrossRef CAS
- L. Xian, R. You, D. Lu, C. Wu, S. Feng and Y. Lu, Cellulose, 2020, 27, 1483–1495 CrossRef CAS
- S. Lu, T. You, N. Yang, Y. Gao and P. Yin, Anal. Bioanal. Chem., 2020, 412, 1159–1167 CrossRef CAS PubMed
- M. Lee, K. Oh, H.-K. Choi, S. G. Lee, H. J. Youn, H. L. Lee and D. H. Jeong, ACS Sens., 2018, 3, 151–159 CrossRef CAS PubMed
- N. C. T. Martins, S. Fateixa and T. Trindade, J. Mol. Liq., 2023, 375, 121388 CrossRef CAS
- P. C. Lee and D. Meisel, J. Phys. Chem., 1982, 86, 3391–3395 CrossRef CAS
- D. Steinigeweg and S. Schlücker, Chem. Commun., 2012, 48, 8682 RSC
- N. C. T. Martins, S. Fateixa, T. Fernandes, H. I. S. Nogueira and T. Trindade, ACS Appl. Nano Mater., 2021, 4, 4484–4495 CrossRef CAS
-
R. L. McCreery, in Raman Spectroscopy for Chemical Analysis, John Wiley & Sons. Inc, 2000, pp. 49–71 Search PubMed
- H. Zhang, P. Zeng, Q. Guan, X. Yan, L. Yu, G. Wu, Y. Hong and C. Wang, Spectrochim. Acta, Part A, 2023, 287, 122073 CrossRef CAS
- L. Yang, X. Qin, X. Jiang, M. Gong, D. Yin, Y. Zhang and B. Zhao, Phys. Chem. Chem. Phys., 2015, 17, 17809–17815 RSC
- W. Zhai, M. Cao, Z. Xiao, D. Li and M. Wang, Foods, 2022, 11, 3597 CrossRef CAS
- M. S. U. Rehman, N. Rashid, M. Ashfaq, A. Saif, N. Ahmad and J.-I. Han, Chemosphere, 2015, 138, 1045–1055 CrossRef CAS
- J. Langer, D. Jimenez de Aberasturi, J. Aizpurua, R. A. Alvarez-Puebla, B. Auguié, J. J. Baumberg, G. C. Bazan, S. E. J. Bell, A. Boisen, A. G. Brolo, J. Choo, D. Cialla-May, V. Deckert, L. Fabris, K. Faulds, F. J. García de Abajo, R. Goodacre, D. Graham, A. J. Haes, C. L. Haynes, C. Huck, T. Itoh, M. Käll, J. Kneipp, N. A. Kotov, H. Kuang, E. C. Le Ru, H. K. Lee, J.-F. Li, X. Y. Ling, S. A. Maier, T. Mayerhöfer, M. Moskovits, K. Murakoshi, J.-M. Nam, S. Nie, Y. Ozaki, I. Pastoriza-Santos, J. Perez-Juste, J. Popp, A. Pucci, S. Reich, B. Ren, G. C. Schatz, T. Shegai, S. Schlücker, L.-L. Tay, K. G. Thomas, Z.-Q. Tian, R. P. Van Duyne, T. Vo-Dinh, Y. Wang, K. A. Willets, C. Xu, H. Xu, Y. Xu, Y. S. Yamamoto, B. Zhao and L. M. Liz-Marzán, ACS Nano, 2020, 14, 28–117 CrossRef CAS
- S. Fateixa, M. Raposo, H. I. S. Nogueira and T. Trindade, Talanta, 2018, 182, 558–566 CrossRef CAS PubMed
- C. Zhu, X. Wang, X. Shi, F. Yang, G. Meng, Q. Xiong, Y. Ke, H. Wang, Y. Lu and N. Wu, ACS Appl. Mater. Interfaces, 2017, 9, 39618–39625 CrossRef CAS PubMed
- M. Pastorello, F. A. Sigoli, D. P. dos Santos and I. O. Mazali, Spectrochim. Acta, Part A, 2020, 231, 118113 CrossRef CAS PubMed
- F. Silva De Almeida, L. Bussler, S. M. Lima, A. R. Fiorucci and L. H. Da Cunha Andrade, Appl. Spectrosc., 2016, 70, 1157–1164 CrossRef
- Official Journal of the European Union Commission Regulation (EU) 2016/1 of 3 December 2015, https://eur-lex.europa.eu/legal-content/EN/TXT/?uri=CELEX%3A32016R0001, (accessed 29 May 2023).
- C. H. Lee, L. Tian and S. Singamaneni, ACS Appl. Mater. Interfaces, 2010, 2, 3429–3435 CrossRef CAS
- M. A. Hubbe, BioResources, 2019, 14, 7630–7631 CAS
- K. Y. Hong, C. D. L. de Albuquerque, R. J. Poppi and A. G. Brolo, Anal. Chim. Acta, 2017, 982, 148–155 CrossRef CAS
- M. Usman, X. Guo, Q. Wu, J. Barman, S. Su, B. Huang, T. Biao, Z. Zhang and Q. Zhan, RSC Adv., 2019, 9, 14109–14115 RSC
- Y. Zhang, Y. Teng, Y. Qin, Z. Ren and Z. Wang, Anal. Lett., 2020, 53, 660–670 CrossRef CAS
- J. Duan, Z. Qiu, L. Li, L. Feng, L. Huang and G. Xiao, Spectrochim. Acta, Part A, 2020, 243, 118811 CrossRef CAS
- J. Chen, M. Huang and L. Kong, Appl. Surf. Sci., 2020, 533, 147454 CrossRef CAS
- T. Fernandes, N. C. T. Martins, S. Fateixa, H. I. S. Nogueira, A. L. Daniel-da-Silva and T. Trindade, J. Colloid Interface Sci., 2022, 612, 342–354 CrossRef CAS
- G. Weng, Y. Yang, J. Zhao, J. Zhu, J. Li and J. Zhao, Solid State Commun., 2018, 272, 67–73 CrossRef CAS
- N. V. Godoy, D. García-Lojo, F. A. Sigoli, J. Pérez-Juste, I. Pastoriza-Santos and I. O. Mazali, Sens. Actuators, B, 2020, 320, 128412 CrossRef CAS
-
S. M. Restaino, A. Berger and I. M. White, in Biosensors and Biodetection: Methods and Protocols, 2017, vol. 2, pp. 525–540 Search PubMed
- X. Wang, J. Zeng, Q. Sun, J. Yang, Y. Xiao, Z. Zhu, B. Yan and Y. Li, Sens. Actuators, B, 2021, 343, 130084 CrossRef CAS
- L. Yang, Q. Sang, J. Du, M. Yang, X. Li, Y. Shen, X. Han, X. Jiang and B. Zhao, Phys. Chem. Chem. Phys., 2018, 20, 15149–15157 RSC
- D. Q. Dao, D. H. Truong, T. L. A. Nguyen, T. C. Ngo, N. T. T. An and B. T. Huy, J. Cluster Sci., 2022, 33, 1–15 CrossRef CAS
- S. F. Soares, M. J. Rocha, M. Ferro, C. O. Amorim, J. S. Amaral, T. Trindade and A. L. Daniel-da-Silva, Int. J. Biol. Macromol., 2019, 139, 827–841 CrossRef CAS PubMed
- H. Wei and P. J. Vikesland, Sci. Rep., 2015, 5, 18131 CrossRef CAS PubMed
- A. Zając, J. Hanuza, M. Wandas and L. Dymińska, Spectrochim. Acta, Part A, 2015, 134, 114–120 CrossRef PubMed
Footnote |
| † Electronic supplementary information (ESI) available. See DOI: https://doi.org/10.1039/d3an01449e |
| This journal is © The Royal Society of Chemistry 2024 |