 Open Access Article
Creative Commons Attribution 3.0 Unported Licence
Combinatorial effect of calcium chloride and polyethylene glycol on efficient isolation of small extracellular vesicles†
Rahmat
Asfiya
a,
Grace
McCully
a,
Anjugam
Paramanantham
a,
Siddharth
Das
a and
Akhil
Srivastava
 *ab
*ab
aDepartment of Pathology and Anatomical Sciences, University of Missouri School of Medicine, Columbia, MO 65212, USA. E-mail: akhil.srivastava@health.missouri.edu
bEllis Fischel Cancer Centre, University of Missouri School of Medicine, Columbia, MO 65212, USA
First published on 9th February 2024
Abstract
Small extracellular vesicles (sEVs) are cargo-carrying cellular nano-vesicles that have been explored for developing organic drug delivery modalities (DVM), an alternative to synthetic liposomes. However, scaled-up production of sEVs is a notable challenge in bringing sEV-based DVMs from the bench to the clinic. Ultracentrifugation is the most accepted isolation approach, but the cumbersome logistical issues and aftereffects of intense ‘g’ force hinder their applicability. In this study, we developed a new amenable isolation strategy for sEVs using a combinatorial treatment of calcium chloride and polyethylene glycol (PEG). An equivalent volume of cell culture medium from growing lung cancer A549 and H1299 cells was incubated overnight at 4 °C with different formulations (0.1 M CaCl2, 8% PEG, 12% PEG, 0.1 M CaCl2 + 8% PEG, and 0.1 M CaCl2 + 12% PEG) and centrifuged at 4000g to purify the precipitated sEVs as a pellet. Next, the extra CaCl2 was chelated out and the buffer was exchanged with PBS. The sEV number and protein content were assessed using the NTA (nanoparticle tracking analysis) and the BCA assay, respectively. Finally, transmission electron microscopy (TEM) was used to visualize the sEVs. The data from the present study demonstrated that the combination of 8% PEG and 0.1 M CaCl2 produced comparable numbers of sEVs with the ultracentrifugation technique. The sEV characteristics and structural integrity also remained intact, as evident from the TEM images and western blot assay. Thus, here we report an efficient technique for sEV isolation that can be easily scaled up.
Introduction
Small vesicles released from cells have recently emerged as important mediators of intercellular communication.1 These membrane vesicles are called extracellular vesicles (EVs) and originate from either endosomal cell membranes (small EVs or exosomes) or plasma membranes (microvesicles or ectosomes).2 Small extracellular vesicles (sEVs) are 30–150 nm diameter lipid bilayer structures responsible for carrying proteins, lipids, and nucleic acids trans-cellularly. The content of sEVs forms the molecular signature of the cell of origin, and thus it varies according to the physiological and pathological conditions of parent cells. sEVs perform intercellular communication via transportation through bodily fluids. Therefore, they are present in all bodily fluids and have been purified from serum, urine, breast milk, cerebrospinal fluid (CSF), and saliva.3 Since the sEV content reflects the pathophysiological conditions of the cell/tissue of origin, it is a source of potential non-invasive or minimally invasive biomarkers for diagnosing disease, especially cancer and autoimmune disease. In addition, owing to their very close similarity to lipid nanoparticles (liposomes) and their ability to carry therapeutic cargo, sEVs have been extensively explored as a potential candidate to replace synthetic liposomes with a safe organic therapeutic delivery system.4Despite the widespread use of sEVs in diagnosing and treating various diseases, isolating them efficiently is a significant obstacle. So far, ultracentrifugation is considered a gold standard method among the reported isolation techniques. But its high cost, high speed (g force) of isolation, large sample volume, etc. limit its use. The other alternative method widely used is the precipitation method. There are multiple precipitation kits that companies develop for sEV isolation. The precipitation kits are mainly based on polyethylene glycol (PEG). These kits are easy to use but expensive in cost, and they pull down everything, which often contaminates sEV purification. However, PEG has been used extensively for virus isolation and protein purification.5 Atha and Ingham extensively discuss the mechanism of PEG-based precipitation. They hypothesized that PEG functions as an “inert solvent sponge” that sterically excludes proteins from its solvent, raising their concentration until solubility reaches a limit and precipitation occurs.6 The protein size, concentration, and charge, and the solute's initial ionic strength are the variables that influence precipitate formation in this process. Keeping this in mind, many researchers have reported sEV isolation by PEG.5,7–9 Precipitation methods in combination with PEG and NaCl and PEG combined with a low pH are also reported.10,11 The isolation technique with PEG is easy and reproducible but poor yield and heterogenous population of isolated sEV is a challenge. There is also a report of the isolation of sEVs based on the membrane charge. The cationic peptide protamine has been used for the isolation of sEVs.12 It is also reported that divalent metal ions highly influence the pattern of protein precipitation using PEG.13 The presence of a divalent metal ion may induce a shift in the pH of the solvent near the isoelectric point of a protein, resulting in its precipitation. Considering pH-responsive and PEG-based sEV isolation, we have modified the method with divalent metal ions, especially calcium chloride (CaCl2), and tested for their isolation efficiency and feasibility. Here, we propose a slightly modified method combining PEG with CaCl2 to isolate sEVs. sEVs are isolated from the supernatant of the lung cancer cell culture. The combined PEG and calcium chloride treatment in the cell culture supernatant increases the precipitation of sEVs compared to PEG alone treatment. Also, the number of isolated sEVs was more homogeneous compared to only PEG treatment. The isolated sEVs are also comparable in number with the sEVs isolated from ultracentrifugation. The structural integrity and function of sEVs are maintained, as evidenced from the TEM images and the cell uptake study. Furthermore, we also established that this standardized protocol is effective for small-volume samples like patient blood serum. Overall, we propose an efficient and straightforward low-speed isolation method of sEVs, which produces comparable results to UC in much less time and with a smaller sample requirement. This assay is suitable for producing sEVs in large quantities in any laboratory setting and can replace the need for a cumbersome ultracentrifugation method.
Experimental
Materials
Polyethylene glycol 6000 (Cat. No. 528877, Sigma), calcium chloride (Cat. No. 10228358, Alfa Aesar), EDTA (Cat No. 798681, Sigma), CuCl2 (Cat. No. C1297, Sigma), ZnCl2 (Cat. No. 208086, Sigma), MgCl2 (Cat. No. M8266, Sigma), doxorubicin (Cat. No. D1515, Sigma), DAPI (Cat. No. R37606, Invitrogen, Thermo Scientific), and 4% paraformaldehyde (Cat. No. J62478.AK, Thermo Scientific) were purchased from the respective providers. Primary antibodies of sEV markers, rabbit anti-CD63 (Cat. No. ab134045), rabbit anti-GPR94 (Cat. No. ab210960), and rabbit anti-TSG101 (Cat. No. ab125011) were purchased from Abcam, Cambridge, UK and mouse anti-CD81 (Cat. No. sc-166029) was purchased from Santa Cruz Biotechnology, TX, USA. Secondary antibodies conjugated with horseradish peroxidase were purchased from Jackson Immuno Research, CA, USA.Cell culture for sEV isolation
NCI-H1299 and A549 lung cancer cells were acquired from the American Type Culture Collection (ATCC). A549 cells were maintained in DMEM supplemented with 10% exosome-free fetal bovine serum (FBS) (System Biosciences, Palo Alto, CA) and antibiotics (penicillin and streptomycin) (Thermo Fisher Scientific, MA, USA), while H1299 cells were maintained in a conditioned Roswell Park Memorial Institute (RPMI1640) medium (Gibco, NY, USA). Every cell culture was kept in an incubator with 5% CO2 at 37 °C. After the cells had reached 80% confluency, the media was removed to isolate the sEVs. Each cell's collected medium was kept at −20 °C before further processing.Isolation of sEVs by differential ultracentrifugation methods
The sEV isolation process was carried out using 10 ml of separated grown media from A549 and H1299 cell lines. Initially, a low speed of 2000g was applied to the samples to eliminate cell debris. After that, the supernatant was moved to a fresh tube and centrifuged at 10![[thin space (1/6-em)]](https://www.rsc.org/images/entities/char_2009.gif) 000g for 30 minutes at 4 °C. Finally, the samples were filtered through a 0.22 μm filter before being ultracentrifuged at 100
000g for 30 minutes at 4 °C. Finally, the samples were filtered through a 0.22 μm filter before being ultracentrifuged at 100![[thin space (1/6-em)]](https://www.rsc.org/images/entities/char_2009.gif) 000g for 1 hour and 30 minutes. After discarding the supernatant, the pellet was again suspended in PBS buffer. The sEV sample was kept at −20 °C for further analysis.
000g for 1 hour and 30 minutes. After discarding the supernatant, the pellet was again suspended in PBS buffer. The sEV sample was kept at −20 °C for further analysis.
Isolation of sEVs by calcium chloride and PEG combination
10 ml of culture media was taken for each treatment after following the UC isolation step of low-speed sample preparation, as discussed in the last section. 0.1 M CaCl2, 0.1 M CaCl2 + 2% PEG, 0.1 M CaCl2 + 4% PEG, 0.1 M CaCl2 + 8% PEG, and 0.1 M CaCl2 + 12% PEG were added and the volume of the sample was adjusted to 20 ml using PBS. For the control PEG sample, 8%/12% PEG was added in 10 ml of the media and the volume was adjusted to 20 ml using PBS. Each sample was thoroughly mixed to make a homogeneous solution. All samples were kept at 4 °C overnight. The next day, the samples were centrifuged at 4000g for 30 minutes at 4 °C. Visible pellets were formed in the CaCl2 and CaCl2 + PEG samples and only in the PEG-treated samples. The supernatant was discarded and a pellet of CaCl2 and PEG/CaCl2 samples was mixed with 1 ml of 0.5 M EDTA solution to chelate out the excess calcium chloride. Finally, 4 ml of PBS was added to each sample and concentrated using a 10 kDa membrane filter (Amicon Ultra-4, Cat. No. 2022-10-01, Millipore, Sigma) to wash out the excess calcium chloride. In the PEG-treated sample, 0.5 ml of PBS was directly added. Each sample was kept at −20 °C for further step.Particle size analysis using a nanoparticle tracking analysis (NTA) system
The size distribution and the number of sEVs isolated by the UC and PEG/CaCl2 method were characterized using a NanoSight NS300 NTA system (NanoSight, Malvern, Worcestershire, UK). 1 ml of 20× diluted purified sEVs was fed into the system at a constant flow rate of 100 utilizing an automated syringe pump system (Harvard apparatus, Cat. No. 98-4730). A 530 nm laser was used to illuminate the moving samples in a flow cell and a sCMOS camera was used to capture the scattering path created by each particle in a 60-second frame. NTA 3.2 software was used to evaluate the collected data and estimate the particle size and number of sEVs. For each sEV characterization run, the NTA capture and analysis parameters remained unchanged.Western blot assay
A Pierce BCA Protein Assay Kit (Thermo Fisher Scientific, MA, USA) was used to analyze protein quantities in the cell lysate and sEV samples. Bovine serum albumin standards with values ranging from 0.125 to 2.0 mg ml−1 were utilized to create an appropriate standard curve. The samples of sEVs and cell lysate were heated with a dye (4× Laemmli Sample Buffer, BioRad, CA, USA, Cat. No. 1610747) for 10 minutes at 95 °C. Following SDS-PAGE protein separation, the proteins were transferred to polyvinylidene fluoride (PVDF, Sigma-Aldrich, MO, USA, Cat. No. IPVH00010) membranes. After blocking the membranes in 3% non-fat powdered milk diluted in TBST (Tris-buffered saline containing 0.1% Tween-20), the membranes were probed with the following primary antibodies: rabbit anti-CD63 (1![[thin space (1/6-em)]](https://www.rsc.org/images/entities/char_2009.gif) :
:![[thin space (1/6-em)]](https://www.rsc.org/images/entities/char_2009.gif) 1000), mouse anti-CD81 (1
1000), mouse anti-CD81 (1![[thin space (1/6-em)]](https://www.rsc.org/images/entities/char_2009.gif) :
:![[thin space (1/6-em)]](https://www.rsc.org/images/entities/char_2009.gif) 1000), rabbit anti-GPR94 (1
1000), rabbit anti-GPR94 (1![[thin space (1/6-em)]](https://www.rsc.org/images/entities/char_2009.gif) :
:![[thin space (1/6-em)]](https://www.rsc.org/images/entities/char_2009.gif) 1000), and rabbit anti-TSG101 (1
1000), and rabbit anti-TSG101 (1![[thin space (1/6-em)]](https://www.rsc.org/images/entities/char_2009.gif) :
:![[thin space (1/6-em)]](https://www.rsc.org/images/entities/char_2009.gif) 1000). A horseradish peroxidase (HRP; Jackson ImmunoResearch, CA, USA) conjugated secondary antibody source was employed. The blots were imaged with an iBright (Invitrogen, CA, USA) system after being produced using a chemiluminescence kit (BioRad, Irvine, CA, USA).
1000). A horseradish peroxidase (HRP; Jackson ImmunoResearch, CA, USA) conjugated secondary antibody source was employed. The blots were imaged with an iBright (Invitrogen, CA, USA) system after being produced using a chemiluminescence kit (BioRad, Irvine, CA, USA).
Surface charge analysis by zeta potential measurement
A Malvern Zetasizer Nano ZS apparatus (Malvern Instruments Inc.) was used for the measurement of 8% PEG/CaCl2- and UC-isolated sEVs of H1299 and A549 cells. 20 μl of each sample was diluted to 1 ml using MQ. Each sample was run 3 times to obtain triplicate values. The obtained data were plotted as a bar graph with the help of MS Excel.TEM imaging
A single drop of sEVs (10 μl) was put onto a 300 hex mesh with formvar-coated glow-discharged copper grids. The sample was allowed to settle on the grid for 5 minutes. The unsettled sample was removed by wicking it with filter paper. Next, 10 μL of 2% uranyl acetate was added to the grid and kept for 20 seconds of incubation. The grid was washed with water to remove the excess uranyl acetate and allowed to air dry for 5 minutes. Finally, it was placed in a grid storage box for viewing. Grids were viewed on a Hitachi H7600 transmission electron microscope at 80 kV equipped with a 2k × 2k AMT digital camera (JEOL JEM-1400, “JEOL”, Tokyo, Japan).Uptake assay
200 μg of doxorubicin (Dox) was incubated with 200 μg of sEVs isolated from UC and 8% PEG CaCl2 at 37 °C for 2 hours. The unbound Dox was removed by washing on a 10 kDa membrane filter. The number of sEVs of each formulation was measured using NTA. 108 sEVs of each isolated method were treated with H1299 and A549 Cells. After 4 hours of treatment, the cells were washed with PBS and fixed with 4% paraformaldehyde. The uptake of Dox was visualized using fluorescence microscopy (Keyence, All-in-One Fluorescence Microscope BZ-X810).Dot blot assay
The membrane filter was activated with methanol and washed with 1× TBST. The wet membrane was kept on a flat glass plate. The protein amount equivalent to 30 μg for each sEV samples either isolated from H1299 or A549 cells were taken in 1.5 ml tube. The volume was adjusted to 50 μl using PBS. The sample was added to the membrane blot in droplet form and the droplet was allowed to adsorb in the membrane by keeping it at 4 °C for 30 minutes. Once the sample was adsorbed, it was blocked with 3% BSA for 15 minutes at room temperature. Next, the primary antibody of CD63 was added in a 1![[thin space (1/6-em)]](https://www.rsc.org/images/entities/char_2009.gif) :
:![[thin space (1/6-em)]](https://www.rsc.org/images/entities/char_2009.gif) 1000 ratio in BSA. After overnight incubation of the blot at 4 °C, it was washed 3 times with TBST. 1
1000 ratio in BSA. After overnight incubation of the blot at 4 °C, it was washed 3 times with TBST. 1![[thin space (1/6-em)]](https://www.rsc.org/images/entities/char_2009.gif) :
:![[thin space (1/6-em)]](https://www.rsc.org/images/entities/char_2009.gif) 1000 mouse secondary antibody was added in 3% BSA (in TBST buffer) and the blot was incubated with it for 1 hour at room temperature. Next, it was washed three times using TBST and visualized using a chemiluminescence kit with an iBright (Invitrogen, CA, USA) system.
1000 mouse secondary antibody was added in 3% BSA (in TBST buffer) and the blot was incubated with it for 1 hour at room temperature. Next, it was washed three times using TBST and visualized using a chemiluminescence kit with an iBright (Invitrogen, CA, USA) system.
Isolation of serum sEVs
Blood samples from cancer patients were collected from the University of Missouri Hospital. All experiments were performed in accordance with the guidelines of the institutional review board (IRB no. 2010166) and the Institutional Biosafety Committee (IBC 16860) approved by the University of Missouri School of Medicine, Columbia, Missouri, USA. Informed consent was obtained from the human participants of this study. 8% PEG and 0.1 M CaCl2 were added to 100 μl of the patient blood serum sample. The volume was adjusted to 5 ml. The sample was kept at 4 °C overnight for precipitation. The next day, the sEVs were isolated by centrifuging the sample at 4000g for 30 minutes. The pellet was resuspended in 1 ml of 0.5 M EDTA and diluted to 5 ml using PBS. The sample was concentrated to 500 μl using a 10 kDa membrane filter. 100 μl of serum of PBS was diluted to 5 ml and ultracentrifuged at 100![[thin space (1/6-em)]](https://www.rsc.org/images/entities/char_2009.gif) 000g for 1 hour and 30 minutes to isolate the UC-based sEVs. Both samples were analyzed by NTA and western blot assay.
000g for 1 hour and 30 minutes to isolate the UC-based sEVs. Both samples were analyzed by NTA and western blot assay.
Results and discussion
Calcium chloride and polyethylene glycol combination treatment in cell culture media enriches the sEVs
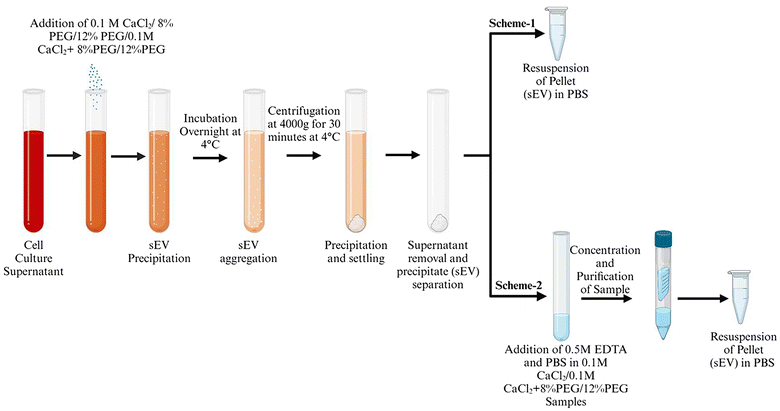
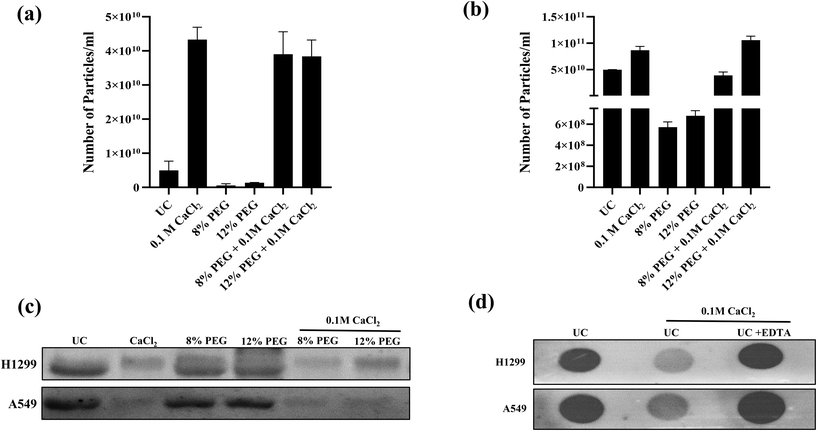
Polyethylene glycol, Mn: 6000 Da, (PEG 6000) based enrichment is a simple and easy to scale up technique for exosome purification. 5–12% of PEG has been used for the effective isolation of sEVs from cell culture media. CaCl2 precipitates high molecular proteins with a molecular weight above 200 kDa and DNA.13 It is also known to interact with phosphatidylserine which is also present in the sEV membrane.14 The effective isolation of proteins in combination with PEG and divalent ions is also reported.13,15 As a result, we wanted to see if PEG 6000/CaCl2 might be utilized to selective enrichment of sEVs. The initial concentrations of PEG were fixed to 8 and 12% for standardization as these concentrations were effective in most exosome isolation techniques. The concentration of CaCl2 0.1 M was used according to the established method for DNA and protein precipitation.16 Scheme 1 in Fig. 1 depicts the experimental flow chart used in this investigation. A549 and H1299 cell culture media were used for the isolation of sEVs. The sEVs were isolated from the ultracentrifugation technique and only PEG was used to compare the quality of isolated sEVs with that of sEVs isolated from the PEG/CaCl2 method. NTA was used to measure the number of particles isolated from different techniques. The confirmation experiment of sEVs was performed using an exosomal surface marker CD63.The result revealed that PEG combined with calcium chloride enhanced the number of particles compared to UC and PEG in both cell lines (Fig. 2a and b) (A549 and H1299) but failed to show the CD63 marker (Fig. 2c). The CD63 marker was selectively absent in the calcium chloride treatment with or without PEG (Fig. 2c). Thus, we thought that the presence of excess calcium chloride in the sample might hinder the interaction of the antibody with the CD63 protein. To confirm this, we have performed dot-blot analysis of CD63 using the sEVs isolated from ultracentrifugation (Fig. 2d). The dot-blot analysis of sEVs using calcium chloride failed to show the CD63 marker. When we added the calcium chloride chelator EDTA, the CD63 marker reappeared. For confirmation, we performed western blot analysis for the samples of 12% PEG CaCl2 from H1299 and A549 with and without EDTA and compared the results with those of UC sEVs (ESI Fig. S1†). The CD63 marker reappeared when the samples were treated with EDTA. This confirmation led to us slightly modifying our protocol as depicted in Scheme 2 of Fig. 1.
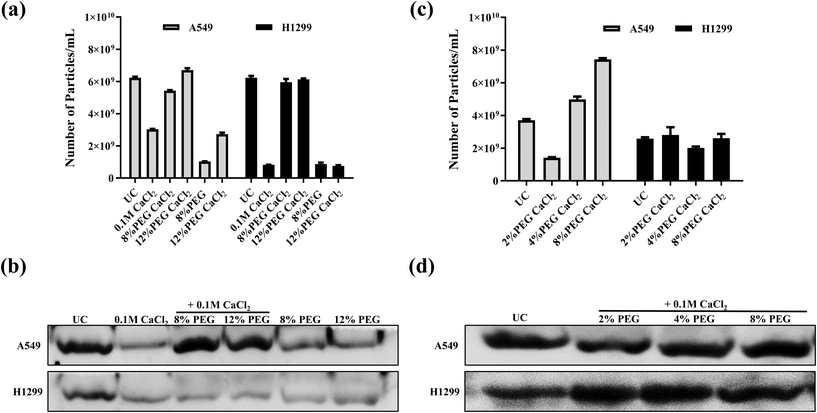
The sEVs isolated from modified PEG/CaCl2 (Scheme 2 of Fig. 1) enrich the sEVs comparable to the number of UC sEVs (Fig. 3a). The western blot data revealed the presence of the CD63 marker in all CaCl2 treatments (Fig. 3b). The 8% PEG- and 12% PEG-isolated sEVs have a low number of particles compared to UC and its respective CaCl2 combination. The CaCl2 alone treatment also isolated the sEVs but they were less in number compared to UC and its combination with PEG. Thus, these data confirm that CaCl2 combined with PEG can enhance sEV isolation. 12% PEG/CaCl2 has a higher number of sEVs than 8% PEG CaCl2 in the sEV sample of A549 cells. The NTA data plot also suggests that the PEG/CaCl2 combination has a homogeneous population like UC (ESI Fig S2 and S3†). Total protein staining with Ponceau S also suggests no additional protein in PEG/CaCl2 treatment compared to UC sEVs in both cell lines (ESI Fig S4†).
CaCl2 interacts with the phosphate group and causes precipitation by forming insoluble calcium phosphate. This concept has been used for the purification of DNA.16 In the present study, we exploited the interaction of calcium with the phosphatidylserine (PS) group of sEVs, which is a phospholipid present in the sEV membrane. Calcium ions are known to bind specifically with the phospholipid head group zone, resulting in membrane swelling and charging in the case of PS lipids.17 The inclusion of PEG along with calcium chloride helps to gather small extracellular vesicles (sEVs) by forming an insoluble complex of PEG–Ca2+–sEV. Later, the chelating agent EDTA, which binds to calcium chloride, breaks down the assembly of PEG, calcium ions, and sEVs, resulting in the release of free sEVs as the precipitate dissolves. However, we are expecting little contamination of PEG even after purification. However, the low concentration of PEG in the sample is not a deterrent. The PS-based isolation technique has been reported with calcium and PS interacting with the Tim4 protein.18 The chelating agent, ethylenediaminetetraacetic acid (EDTA), dissociates the Tim4 complexes from the sEVs. The sEV isolation efficiency of the Tim4-based method was compared with that of the standard ultracentrifugation and a commercial kit.
Standardization of the PEG/CaCl2 concentration
Since the PEG/CaCl2 method was found to be effective at 8 and 12% PEG with CaCl2, we checked the sEV quantities in H1299 and A549 with a lower concentration of PEG (2%, 4%) with 0.1 M CaCl2 and compared them with that of the UC and 8% PEG/CaCl2 combination (Fig. 3c and d). The data revealed that there was not much change in the number of sEVs in the case of H1299 but the number of sEVs was decreased in the case of A549 compared to the 8% PEG/CaCl2 combination. All formulations showed the presence of the sEV marker CD63. We have considered 8% PEG/CaCl2 as an optimum concentration that gives efficient isolations with both tested cell lines. We did not check it at a higher percentage of PEG because it precipitates protein contamination. Furthermore, we also optimised the concentration of CaCl2 in A549-isolated sEVs with the 8% PEG combination. We checked the results at lower concentrations of CaCl2 (10 mM and 50 mM) with 8% PEG and compared them with those for 8% PEG/0.1 M CaCl2 and ultracentrifugation method. The NTA data revealed that the number of sEV particles increased on increasing the CaCl2 concentration with 8% PEG (ESI Fig S5†).Influence of other divalent metal ions with polyethylene glycol for sEV enrichment
8% PEG was added in combination with 0.1 M solutions of other divalent metal ions (MgCl2, CuCl2, and ZnCl2) to confirm the selectivity of calcium chloride with PEG (Fig. S6†) in A549 cell culture media. The data showed that PEG/MgCl2 has sEVs, as evident from the NTA and western blot analysis, but the isolation efficiency of sEVs is low compared to calcium. The samples of PEG/ZnCl2 and PEG/CuCl2 have no protein, as evidenced by the BSA assay. However, they showed a significant number of particles but did not show the CD63 marker. So, sEV isolation is ineffective if PEG is combined with other divalent metals (Cu, Zn, and Mg). We speculate that the reason for the precipitation of sEVs in different efficiencies could be its different interactions with the phosphatidylserine (PS) group of sEVs. The literature suggests that calcium and magnesium interact with PS differently.19Specifically, Ca2+ forms a bond with PS by interacting with its phosphate group and carboxyl group, while magnesium (Mg) interacts with either the phosphate group or the carboxyl group of PS. Cu2+ interacts with the phosphate and amine groups of PS, whereas Zn2+ interacts in a similar manner to Ca2+.20,21 These varying degrees of interaction between divalent metal ions with the PS group of sEVs are potentially responsible for the variations in sEV purification. However, we have yet to determine the precise cause of Zn2+ exhibiting lower efficiency than Ca2+, despite both ions engaging in similar interactions with PS.
PEG/CaCl2-isolated sEVs maintained the characteristic markers and the structure of sEVs
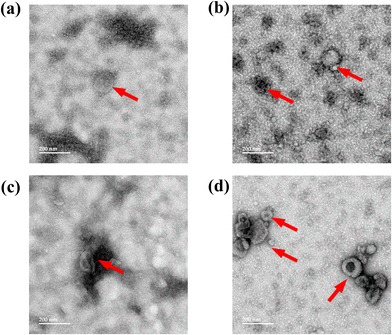
As discussed earlier, 8% PEG/CaCl2 is effective in sEV isolation. The sEVs isolated from 8% PEG/CaCl2 were compared with those isolated from UC with respect to their number, size, surface potential, characteristic sEV marker, and morphology. The NTA data revealed the similarity in the number and size in both cell lines of sEVs (A549 and H1299) compared to their respective UC-based isolation (Fig. S2 and Fig. S3†). The surface potential of UC was −7.8 ± 1.0 mV and that of 8% PEG CaCl2 was −7.9 ± 1.6 mV for H1299 (Fig. 4c). The surface potential of UC was −12 ± 2 mV and that of 8% PEG CaCl2 was −9.38 ± 1.4 mV for A549 sEV. A slight change in the zeta potential could be due to the presence of calcium on the surface of sEVs. In Fig. 4b, UC sEVs and 8% PEG/CaCl2 are compared with cell lysate markers to prove that the sample has no contamination of cytosolic proteins. The CD63 marker is present in both isolation methods, less in the cells and more in the sEVs. GRP94 is only present in the cells and absent in the sEVs for both isolation methods. Finally, both isolation methods are used to check the presence of the other sEV markers CD81 and TSG 101 (Fig. 4a). The western blot data confirm the presence of both markers in the 8% PEG CaCl2 method. Calcium chloride-based transfection in the sEVs is reported for loading miRNA by destabilizing its membrane.22 The structural integrity and morphology of sEVs were assessed by transmission microscopy. The 8% PEG CaCl2 method has maintained the structure of sEVs in both cell lines (Fig. 5). The data were similar in the morphology of UC for both cell lines. Thus, the morphology of sEVs, in particular the membrane integrity, is ineffective due to the combined treatment of CaCl2 with PEG. We conducted a thorough study of our standardized method of PEG/CaCl2 and compared it with the commercial sEV isolation kit Exoquick (System Biosciences, CA, USA) and the PEG/NaCl method, which is commonly used to isolate virus particles.23 This method has also been utilized for sEV isolation due to the compositional similarity between sEVs and viruses.24 PEG, when combined with NaCl salt, reduces the solubility of the surface protein of sEVs in water, facilitating its precipitation. Divalent metal ions can also contribute to the precipitation of the protein, but their effectiveness is less than that of NaCl.25 However, sEVs contain an additional membrane lipid (PS) that interacts with divalent metal ions.26 Therefore, the precipitation of sEVs was effectively triggered by their dual interaction with divalent metal ions. Our results showed that the number of sEVs isolated using the PEG/CaCl2 method was not significantly different from that with the other methods, as determined from the NTA data (Fig. S8a†). However, the BCA data (Fig. S7†) indicated that the total protein yield was higher in the PEG/CaCl2 and UC methods compared to the Exoquick and PEG/NaCl methods. In addition, the western blot analysis (Fig. S8b†) showed that the sEV specific proteins viz. CD63 and TSG 101 were enriched in the PEG/CaCl2 and UC samples compared to the Exoquick and PEG/NaCl samples. This suggests that the Exoquick and PEG/NaCl methods may not isolate all sEVs, as they yielded less total protein and narrower bands for CD63 and TSG101.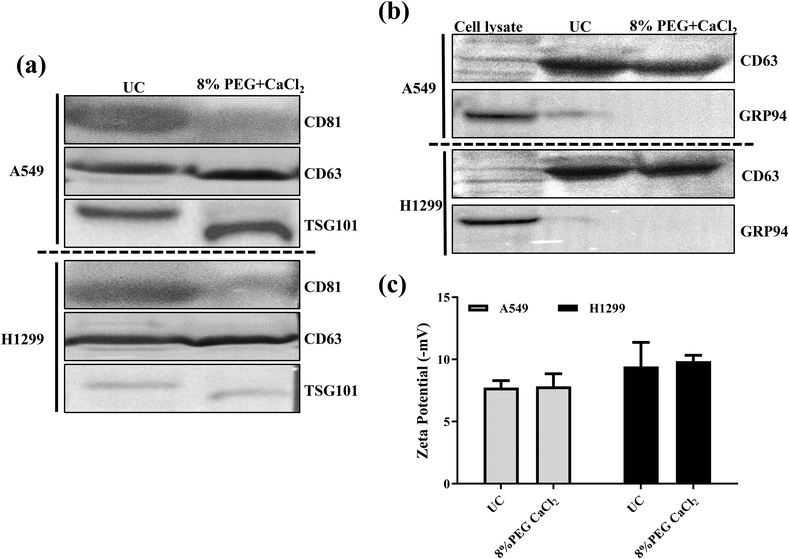 | ||
| Fig. 4 (a) Western blot for the sEV markers of A549 and H1299 sEVs. (b) Western blot of cell lysate. (c) Surface zeta potentials of sEVs from different methods. | ||
Intracellular delivery of DOX via PEG/CaCl2 sEVs and UC sEVs is equally efficient
sEVs can load the hydrophilic drug Dox inside its lumen and deliver it inside the cells. The uptake of sEV depends on the parent cells. Thus, sEV-isolated H1299 will go more into H1299 cells than A549 and vice versa. The Dox-loaded sEVs from UC and 8% PEG/CaCl2 were tested in A549 and H1299 cells (Fig. 6 and 7). The function of sEVs isolated from 8% PEG/CaCl2 was retained and their uptake efficiency was comparable with that of sEVs isolated from UC. The uptake of sEVs was observed through the fluorescence of Dox. Fig. 6 shows that more A549 sEVs are isolated from both methods in A549 cells compared to H1299 cells. This result suggested that organotropism,27 which is a function of sEVs, was retained even in isolation from the PEG/CaCl2 method. So, DOX-loaded sEVs isolated from either UC or 8% PEG/CaCl2 enter more efficiently into their parent cells than nonparental cells.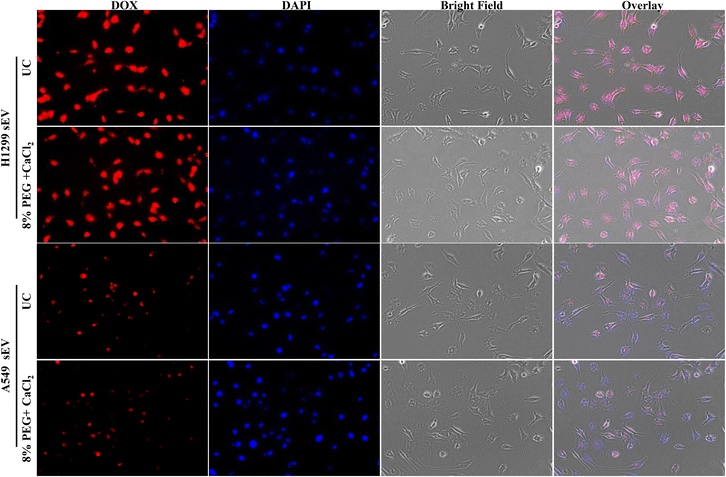 | ||
| Fig. 6 Fluorescence microscopy images of Dox-loaded H1299 sEVs and A549 sEVs isolated from the ultracentrifugation (UC) method and the 8% PEG + 0.1 M CaCl2 method in H1299 cells. | ||
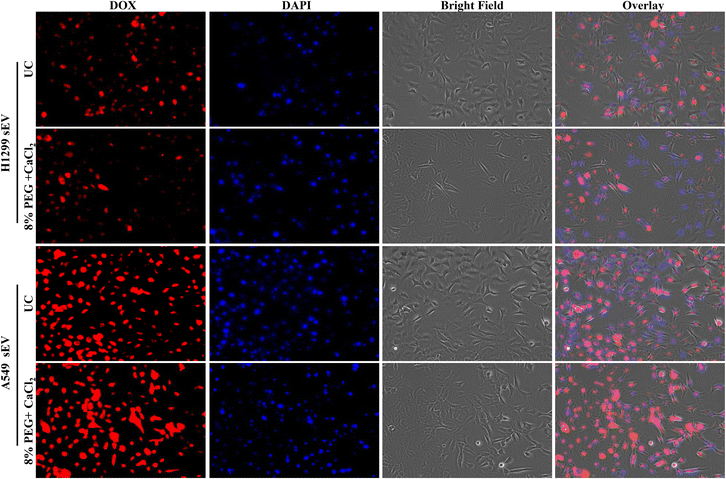 | ||
| Fig. 7 Fluorescence microscopy images of Dox-loaded H1299 sEVs and A549 sEVs isolated from the ultracentrifugation (UC) method and 8% PEG + 0.1 M CaCl2 method in A549 cells. | ||
PEG-CaCl2 method is effective for small-volume samples
Small-volume samples like bodily fluids are limited in volume, and are often very complicated due to the presence of proteins. We tested the 8% PEG/CaCl2 method for the isolation of sEVs from patient blood serum and compared the results with the yield efficiency of the UC method. 100 μl of blood serum was used to isolate the sEVs. The number and size of particles were similar in both methods of isolation. The CD63 and TSG101 marker detection also confirms the presence of sEVs in both isolations (Fig. 8).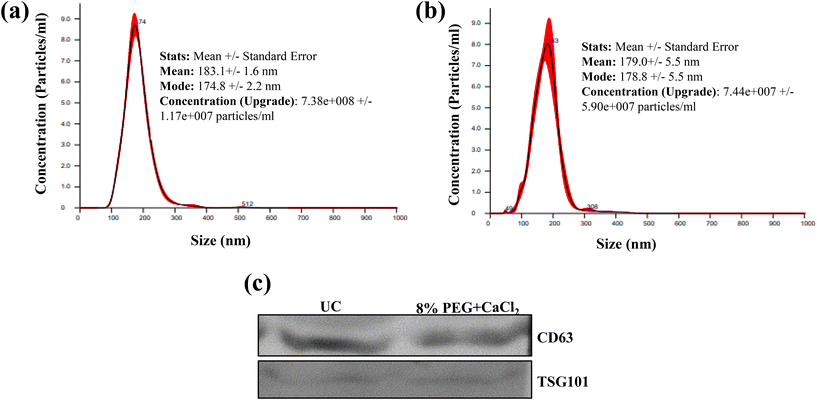 | ||
| Fig. 8 (a) NTA plots of blood serum EVs isolated from (a) the ultracentrifugation method and (b) the 8% PEG + 0.1 M CaCl2 method and (c) western blot of serum isolated from different methods. | ||
Conclusions
In conclusion, this study proves that 8% PEG 6000 + CaCl2 could be a viable alternative to UC for sEV isolation. Through this method, sEVs could be purified from the cell culture supernatant without expensive equipment and a complicated procedure. The sEV characterization provided by NTA, zeta, and TEM and the verification by western blotting suggest a high purity of the isolated sEVs. Given the similar outcomes with sEVs to biofluids, this technique has been expanded to other biofluids such as blood. So, additional biofluid samples, like saliva and urine, can also be treated with this technique. In general, PEG/CaCl2 offers a straightforward and reasonably priced method for isolating sEVs from clinical samples and biological fluids and it is simply applicable in any laboratory.Author contributions
RA and AS conceived the project and designed the experiments. RA, GM, AP, SD, and AS performed the experiments and analysed and compiled the data. RA, GM and AS wrote the original manuscript draft. RA, GM, and AP edited and proofread the manuscript. AS supervised the project.Notes
The content presented is solely the responsibility of the authors. The opinions, interpretations, conclusions, and recommendations are those of the author and not necessarily endorsed by or representative of the official views of the DoD or UM-SoM.Conflicts of interest
There are no conflicts to declare.Acknowledgements
The authors thank the Electron Microscopy Core Facility (EMC) for TEM imaging and Dr Pawan K. Singh and Dr Raghuraman Kannan for generously sharing their lab equipment.This study was supported, in part, by the University of Missouri School of Medicine (UM-SoM) startup funds (A. S.) and the Department of Defense (DoD) through the Lung Cancer Research Program (LCRP) award W81XWH-22-1-0016 (A.S.).
References
- R. M. Johnstone, M. Adam, J. R. Hammond, L. Orr and C. Turbide, J. Biol. Chem., 1987, 262(19), 9412–9420 CrossRef CAS PubMed.
- C. Théry, L. Zitvogel and S. Amigorena, Nat. Rev. Immunol., 2002, 2 Search PubMed.
- M. L. Alvarez, M. Khosroheidari, R. Kanchi Ravi and J. K. Distefano, Kidney Int., 2012, 82(9), 1024–1032 CrossRef CAS.
- R. Tenchov, J. M. Sasso, X. Wang, W. S. Liaw, C. A. Chen and Q. A. Zhou, ACS Nano, 2022, 16 Search PubMed.
- M. A. Rider, S. N. Hurwitz and D. G. Meckes, Sci. Rep., 2016, 6, 23978 CrossRef CAS PubMed.
- D. H. Atha and K. C. Ingham, J. Biol. Chem., 1981, 256, 12108–12117 CrossRef CAS PubMed.
- Y. Weng, Z. Sui, Y. Shan, Y. Hu, Y. Chen, L. Zhang and Y. Zhang, Analyst, 2016, 141, 4640–4646 RSC.
- N. García-Romero, R. Madurga, G. Rackov, I. Palacín-Aliana, R. Núñez-Torres, A. Asensi-Puig, J. Carrión-Navarro, S. Esteban-Rubio, H. Peinado, A. González-Neira, V. González-Rumayor, C. Belda-Iniesta and A. Ayuso-Sacido, J. Transl. Med., 2019, 17, 75 CrossRef PubMed.
- A. D. Singh, S. Patnam, A. Manocha, L. Bashyam, A. K. Rengan and M. V. Sasidhar, MethodsX, 2023, 11, 102310 CrossRef CAS PubMed.
- M. Tangwattanachuleeporn, P. Muanwien, Y. Teethaisong and P. Somparn, Medicina, 2022, 58(11), 1600 CrossRef PubMed.
- A. P. Suresh, S. P. Kalarikkal, B. Pullareddy and G. M. Sundaram, ACS Omega, 2021, 6, 17635–17641 CrossRef CAS PubMed.
- M. C. Deregibus, F. Figliolini, S. D’Antico, P. M. Manzini, C. Pasquino, M. De Lena, C. Tetta, M. F. Brizzi and G. Camussi, Int. J. Mol. Med., 2016, 38(5), 1359–1366 CrossRef CAS PubMed.
- R. Sommer, P. Satzer, A. Tscheliessnig, H. Schulz, B. Helk and A. Jungbauer, Process Biochem., 2014, 49(11), 2001–2009 CrossRef CAS.
- G. W. Feigenson, Biochemistry, 1989, 28, 1270–1278 CrossRef CAS PubMed.
- S. L. Thrash, J. C. Otto and T. L. Deits, Protein Expression Purif., 1991, 2(1), 83–89 CrossRef CAS PubMed.
- S. P. Wilson, F. Liu, R. E. Wilson and P. R. Housley, Anal. Biochem., 1995, 226(2), 212–220 CrossRef CAS PubMed.
- X. Wu, S. Shi, Y. Wang, B. Tang, L. Guo, Y. Gao, T. Jiang, K. Yang, K. Sun, Y. Zhao, W. Li and J. Yu, ACS Omega, 2021, 6(48), 33033–33045 CrossRef CAS PubMed.
- W. Nakai, T. Yoshida, D. Diez, Y. Miyatake, T. Nishibu, N. Imawaka, K. Naruse, Y. Sadamura and R. Hanayama, Sci. Rep., 2016, 6, 33935 CrossRef CAS PubMed.
- A. Martín-Molina, C. Rodríguez-Beas and J. Faraudo, Biophys. J., 2012, 102(9), 2095–2103 CrossRef PubMed.
- C. F. Monson, X. Cong, A. D. Robison, H. P. Pace, C. Liu, M. F. Poyton and P. S. Cremer, J. Am. Chem. Soc., 2012, 134, 7773–7779 CrossRef CAS PubMed.
- X. Cong, M. F. Poyton, A. J. Baxter, S. Pullanchery and P. S. Cremer, J. Am. Chem. Soc., 2015, 137, 7785–7792 CrossRef CAS PubMed.
- D. Zhang, H. Lee, X. Wang, A. Rai, M. Groot and Y. Jin, Mol. Ther., 2018, 26(9), 2119–2130 CrossRef CAS PubMed.
- F. Fouladvand, P. Bemani, M. Mohammadi, R. Amini and F. A. Jalilian, J. Appl. Biotechnol. Rep., 2020, 7 CAS.
- E. N. Hoen, T. Cremer, R. C. Gallo and L. B. Margolis, Proc. Natl. Acad. Sci. U. S. A., 2016, 113 Search PubMed.
- T. Arakawa and S. N. Timasheff, Biochemistry, 1984, 23, 5912–5923 CrossRef CAS PubMed.
- H. Hauser and G. G. Shipley, Biochemistry, 1984, 23, 34–41 CrossRef CAS PubMed.
- Y. Liu and X. Cao, Cell Res., 2016, 26, 149–150 CrossRef CAS PubMed.
Footnote |
| † Electronic supplementary information (ESI) available. See DOI: https://doi.org/10.1039/d3an01955a |
| This journal is © The Royal Society of Chemistry 2024 |

