 Open Access Article
Red stains on heritage marbles: application of micro-scale analyses to assess the presence and distribution of lead compounds†
Elisa
Villani
ab,
Amelia
Suzuki
ac,
Marilena
Ricci
d,
Barbara
Salvadori
 a,
Silvia
Vettori
a and
Emma
Cantisani
 *a
*a
aInstitute of Heritage Science, National Research Council (CNR-ISPC), Via Madonna del Piano 10, 50019 Sesto Fiorentino (Florence), Italy. E-mail: emma.cantisani@cnr.it
bDepartment of Earth Sciences, Sapienza University of Rome, Piazzale Aldo Moro 5, 00185 Rome, Italy
cImaging and Sensing for Archaeology, Art History and Conservation (ISAAC) Lab, School of Science and Technology, Nottingham Trent University, Nottingham NG11 8NS, UK
dDepartment of Chemistry “Ugo Schiff”, University of Florence, Via della Lastruccia 13, 50019 Sesto Fiorentino (Florence), Italy
First published on 12th August 2024
Abstract
Stone cultural heritage buildings are frequently affected by different alteration phenomena and in particular, on heritage marbles the presence of chromatic discolouration, as the red stains, is one of the most widespread. In this paper, small fragments of red stains originated on marble exposed to different environmental contexts were analysed to reveal the presence and distribution of lead compounds at the micro-scale level. The samples come from slabs of historical religious buildings in Florence (Santa Maria del Fiore Cathedral and the San Giovanni Baptistery) and from the monumental fountains conserved in the Medicean Villa La Petraia (Florence). The presence and distribution of lead compounds: minium (Pb3O4), carbonates such as cerussite (PbCO3) and hydrocerussite (Pb3(CO3)2(OH)2) and plattnerite (PbO2), was revealed using 2D high lateral resolution micro-X-Ray Powder Diffraction (μ-XRPD) and μ-Raman spectroscopy. Additional information were provided by Scanning Electron Microscopy, the elemental distribution performed with micro-X-Ray Fluorescence mapping enable to verify the possible presence of light elements and the use of FTIR chemical imaging confirmed the absence of organic compounds.
Introduction
Among the various alterations that occur to stone, the red stains observed on different cultural heritage assets, mainly those of carbonate composition, such as marbles, are of significant relevance. Many cases of their presence have been reported both in Europe and the United States since the first study on the façade of the Certosa of Pavia where red stains have been documented in 1844.1 At first, researchers focused on the possible biological origin of this alteration and red-pigmented heterotrophic bacteria were identified,2 giving rise to the hypothesis that the red coloration could be attributed to carotenoids formed as a result of microbiological activity. Later studies, thanks to the use of spectroscopic analyses, highlighted the presence of lead (Pb) with XRF and identified Raman bands corresponding to the ones of pure minium, the mixed valence state lead oxide Pb3O4.3 The inorganic origin of red stains was also confirmed by the studies conducted on the Carrara marble samples of the Orvieto Cathedral façade4 and the Candoglia marble samples from the statues of Galatea fountain in Villa Litta near Milan,5 where lead presence was related not only to atmospheric agents but also to its use in roofing or in the fountain-basin liners. Therefore, according to the various case studies on the red-coloured alterations of marble, it can be inferred that red stains may have either an organic or inorganic origin. All the studies where lead was detected focused on explaining its origin but were not able to clarify its oxidoreductive mechanism. In fact, since inorganic oxidation of lead seemed improbable, a correlation with the microbial activity was searched.6,7Previous works, conducted on marble slabs of historical religious buildings in the city centre of Florence,8 showed that the diffusion of red stains of inorganic origin is apparently random, both the extension and the shape are not homogeneous and there is a strong variability in the perceived colour. Microscopical observations of different samples allowed to reveal that red coloration is present on both the inner and superficial layers mostly distributed between calcite grains in the intergranular micro fissures caused by decohesion processes.
From all those studies,2,4,5,8,9 it seems that the combination of alkaline environmental conditions, water and its pH, along with the presence of microorganisms and/or a source of lead, significantly contributes to the formation of such stains that affect the aesthetics of the marble surface.
To further investigate already studied samples from Santa Maria del Fiore Cathedral and the San Giovanni Baptistery in Florence,8,10 Synchrotron Radiation (SR) micro-X-ray Powder Diffraction (μ-XRPD) and micro-Raman spectroscopy (μ-Raman) have been applied to obtain micro-scale distribution of minium and other lead compounds. Additionally, SEM observations with Energy Dispersive X-ray Spectroscopy (EDS), micro-X-Ray Fluorescence mapping (μ-XRF) and chemical imaging with Fourier Transform Infrared Spectroscopy equipped with Focal Plane Array (FTIR-FPA) have been used to investigate the possible presence of light elements and organic compounds that could suggest the presence of biodeteriogens.
Since red stains appear not only on the marble heritage building located in the city centre, the same analyses were also performed on new samples collected from the monumental fountains of Venere-Fiorenza and Ercole and Anteo conserved in the Medicean Villa La Petraia (Florence). The obtained results added further information on the presence and distribution of different lead compounds, enabling us to propose hypotheses concerning the origin of lead and staining phenomenon.
Materials and methods
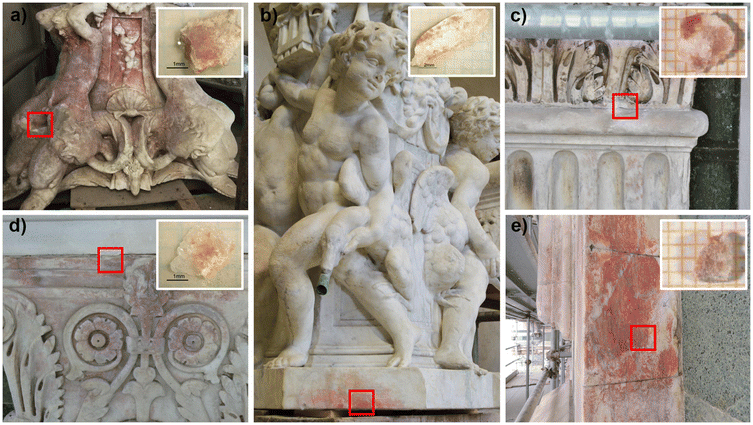
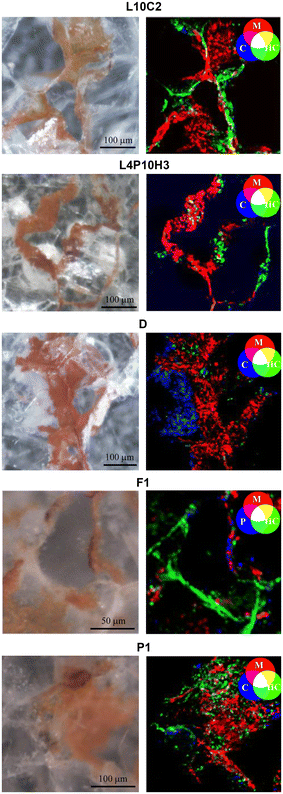
A multi-analytical approach combining 2D high lateral resolution μ-XRPD, μ-Raman, SEM-EDS, μ-XRF mapping and FTIR chemical imaging with FPA was applied on marble thin sections. These were obtained perpendicular to the stained surface, embedded in resin, prepared with a polycarbonate substrate and reduced to 50 μm thickness, for the specific requirements of μ-XRPD measurements. The micro-fragments of stained marbles were collected using a scalpel from the cladding façades of San Giovanni Baptistery (samples L10-C2, L4P10H3) and Santa Maria del Fiore Cathedral (Duomo sample, named D) together with the ornamental elements (cherubs and caryatids) from the fountains in Villa La Petraia (samples P1, F1).The extent of the phenomenon, the varying chromaticity, and the heterogeneous superficial distribution of the red stains covering the examined marbles are observable in Fig. 1.
Micro-Raman spectroscopy
Micro-Raman analyses of the surface of all fragments were performed by means of a Renishaw RM2000 with 785 nm diode laser as excitation source. The laser power on the analyzed samples was kept low to avoid possible laser-induced modifications of laser-sensitive compounds like the lead oxides11 within the range 0.04–0.4 mW. Microscope objectives of different magnification (20×, 50×) were used to preliminarily observe the morphology of the samples by white light, while spectra were acquired using a 50× (N.A. = 0.75) magnification objective, providing a spot size of ca. 2 μm. The spectral range investigated was between 200 and 2000 cm−1 with a spectral resolution of 4 cm−1 and the acquisition time between 20 s and 40 s.2D high-spatial resolution X-ray powder diffraction
SR-based μ-XRPD mapping was performed on thin sections of 30–50 μm thickness at the μ-XRD branch of ID13 beamline of the European Synchrotron Radiation Facility (ESRF, Grenoble) thanks to the Historical Materials BAG (proposal HG-172).12 To perform raster scan maps, a beam size of ca. 2.5 × 2.5 μm2 was used with a step size of 1 μm in x and y directions, with an acquisition time per point of 10 ms at 12.92 keV and a flux of 1.9 × 10¹¹ ph s−1 (at I = 34 mA electron beam current). The two-dimensional diffraction patterns collected in transmission have been azimuthally integrated using dedicated Jupyter notebooks, based on the PyFAI software package13 and were then analysed with PyMCA software to perform ROI imaging.14 The identification of the crystalline compounds was performed with the software Match! using COD inorganics database.15Elemental mapping: SEM-EDS analysis & μ-XRF-mapping
Morphological and semi-quantitative microchemical analyses were obtained by means of a SEM EDS electronic microscope (ZEISS EVO MA 15) with W filament equipped with analytical system in dispersion of energy EDS/SDD, Oxford Ultimax 40 (40 mm2 with resolution 127 eV @5.9 keV) with Aztec 5.0 SP1 software. The measurements were performed with the following operative conditions: an acceleration potential of 15 kV, 500 pA beam current, working distance comprised between 9–8.5 mm; 20 s live time as acquisition rate useful to archive at least 600.000 cts, on Co standard, process time 4 for point analyses; 500 μs pixel dwell time for maps acquisition with 1024 × 768 pixel resolution.μ-XRF mapping was performed at ID21 beamline at ESRF (proposal HG-172)12,16 with a beam spot size of 1.3 (hor) × 1 (ver) μm2 with 1.8 × 10¹⁰ ph s−1. The fluorescence maps were acquired with a 2-energy set-up (fundamental at 3.6 keV + third harmonic at 10.8 keV) with a dwell time of 0.05 s with a step size of 2.5 μm in both horizontal and vertical directions. PyMCA was used to fit the XRF spectra and to separate the contribution of different elements with RGB correlation.14
FTIR chemical imaging
Chemical imaging was performed with a Bruker LUMOS II FTIR microscope (Bruker Optics GmbH, Ettlingen, Germany), equipped with a liquid-N2 cooled 32 × 32 element Focal Plane Array (FPA) detector.FTIR-FPA images were acquired in reflection mode within a 4000–750 cm−1 spectral region, each as a single FTIR image (1024 spectra) covering a sampling area of ca. 150 × 150 μm2, with resolution 4 cm−1 and 128 scans. In reflection mode, a single spectrum in each FTIR image represents molecular information acquired from ca. 5 × 5 μm2 area on the sample plane. Background measurements were taken prior to sample spectral images, on a gold mirror. The collected FTIR spectra were processed using OPUS 8.2 software.
Results
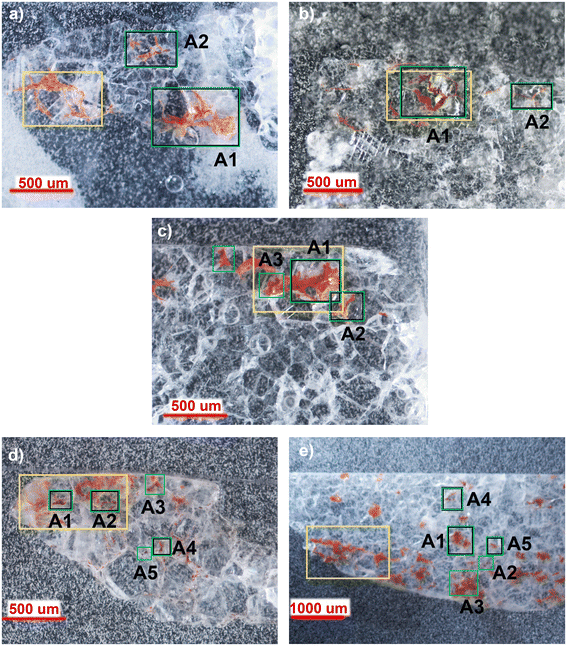
As the distribution of red stains is not homogeneous within the thin sections, different areas were investigated for each sample and the Optical Microscope images (4–10× magnification) are reported in Fig. 2.Micro-Raman spectroscopy
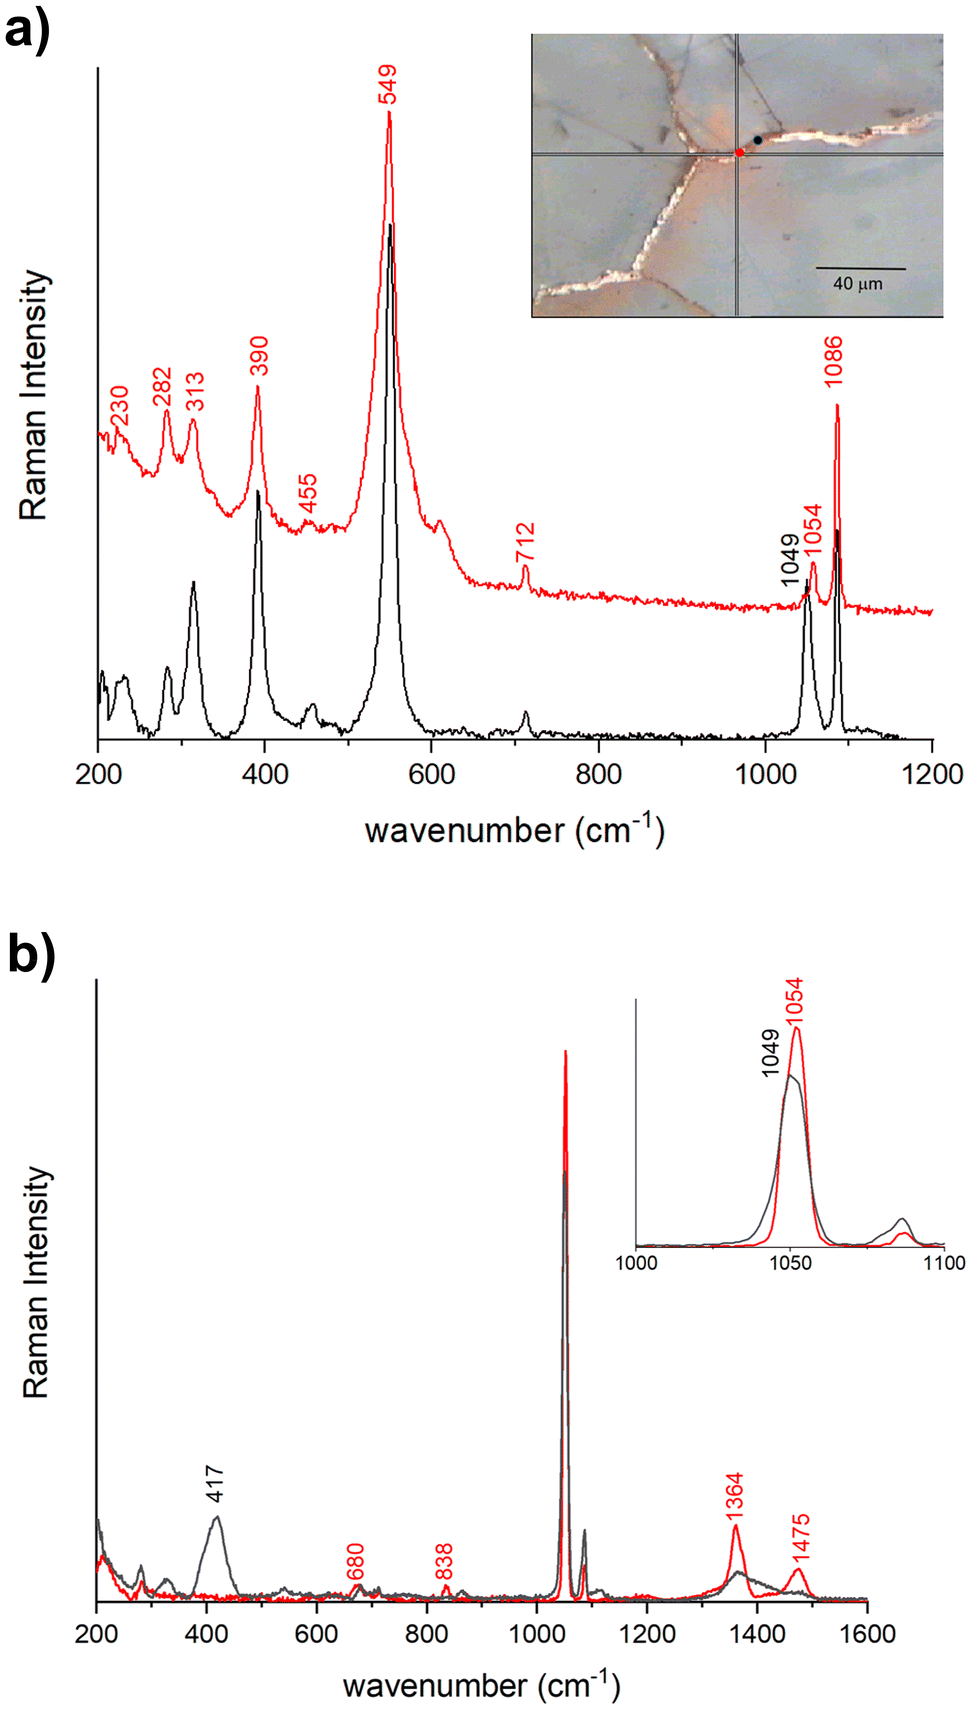
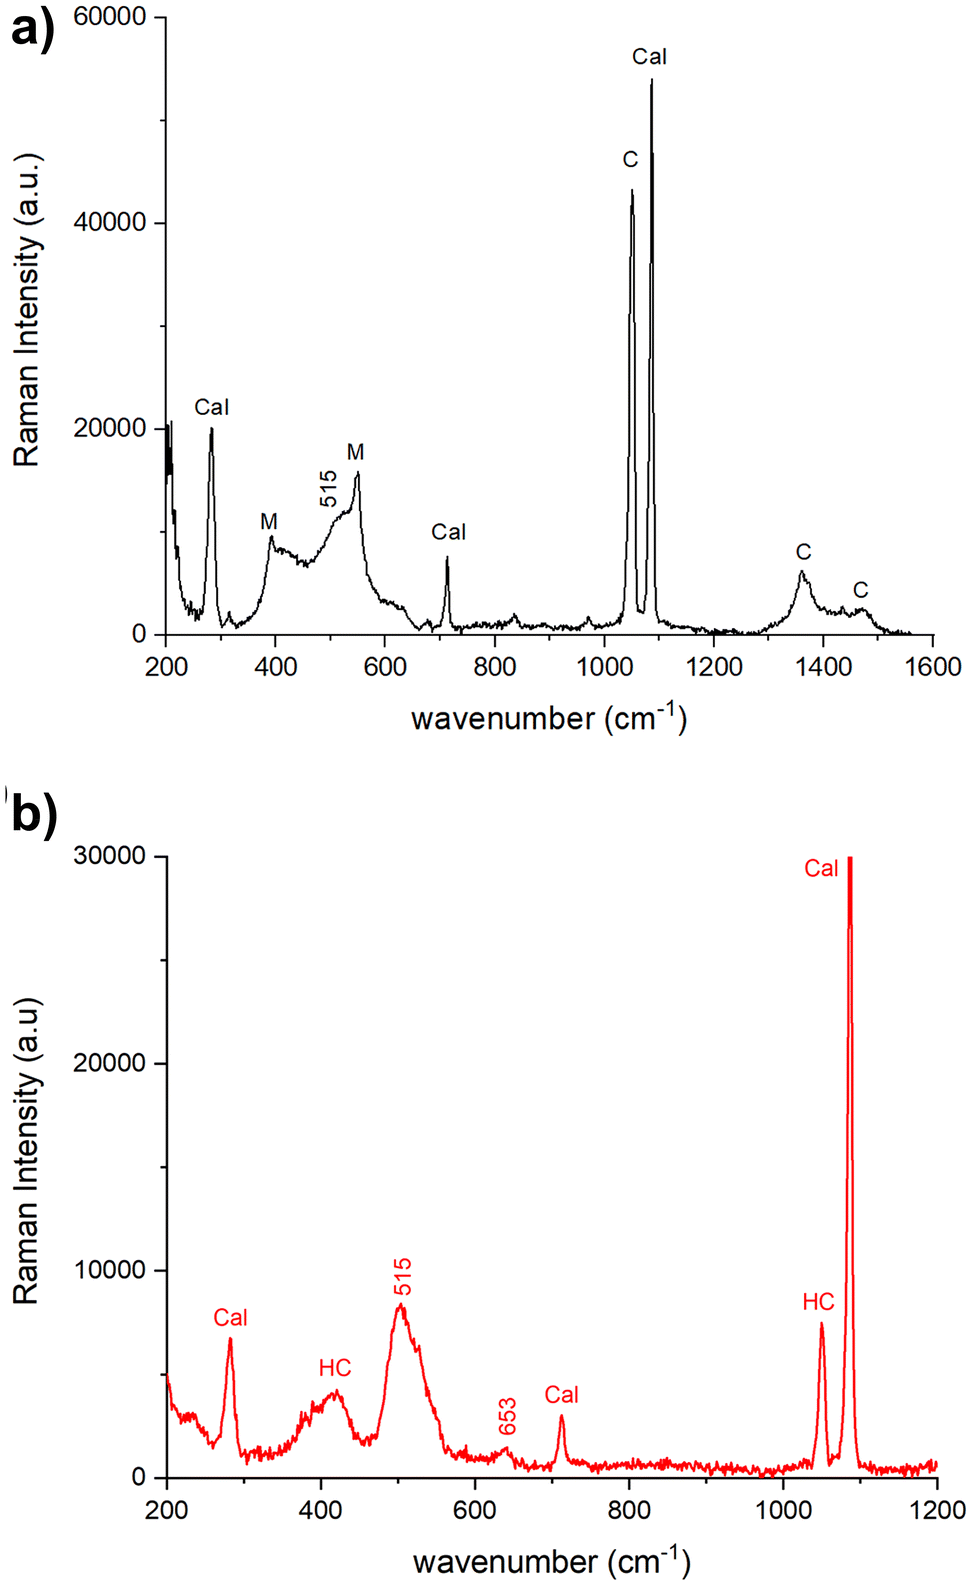
The Raman spectra acquired from various areas of all the analyzed samples exhibit distinct bands corresponding to minium (M), calcite (Cal), hydrocerussite (HC) and/or cerussite (C). The relative proportions of these compounds vary based on the coloration of the respective areas. In the regions that appear in vivid orange-red colour from OM images, the intense bands at 549 (vs), 477 (w), 455 (w), 390 (s) and 313 (m), 230 (w) cm−1 are attributed to lead tetroxide (minium), Pb3O4, featuring a tetragonal structure wherein lead exists in two different oxidation states, Pb(II) and Pb(IV). The latter occupy distinct structural sites.17,18 Calcite is also observed, characterized by the 282, 712 cm−1 peaks and the most intense one at 1086 cm−1. Additionally, Raman signals at 1049 and 1054 cm−1 arise from lead carbonates, hydrocerussite and cerussite, respectively (Fig. 3a). In certain spectra, the intense peak at 549 cm−1 of minium exhibits a broadening of the full-width at half maximum compared to crystalline materials, indicating a potential structural irregularity or a lack of order in the material's structural arrangement. Furthermore, the spectra recorded in the surrounding white areas not only reveal calcite bands, but also the characteristic features of lead carbonates, such as cerussite (1475 (s), 1375 (sh), 1364 (s), 1054 (vs), 838 (m), 680 (m) cm−1) and hydrocerussite (1364 (s), 1053 (vs), 1049 (vvs), 417 (m) cm−1), as shown by the spectra reported for the Baptistery and Duomo samples in Fig. 3b.In dark-red areas of the Baptistery sample, complex spectra are obtained at low laser intensity conditions, demonstrating consistency even with an increase in power up to 0.4 mW (Fig. 4a).
Notably, alongside the bands of calcite and cerussite, a broad band is observable between 400–600 cm−1. This band shows two narrow peaks at 549 cm−1 and 390 cm−1 characteristics of the minium with a well-defined shoulder at approximately 515 cm−1 and a broad feature beyond 600 cm−1, which can be related to lead dioxide β-PbO2, plattnerite (Fig. 4a). The analysis of sample F1 from Venere-Fiorenza fountain reveals spectra at various points that distinctly highlight the bands of plattnerite at 515 cm−1 and 653 cm−1, with a shoulder at 540 cm−1. These spectra also feature bands from calcite (1086, 712, 282 cm−1) and hydrocerussite (1050 cm−1), conspicuously lacking contributions from lead tetraoxide (Fig. 4b).
2D high-spatial resolution X-ray powder diffraction
The SR-based μ-XRPD maps allowed the identification of the mineralogical phases and enabled to highlight their distribution at the micro scale. The most relevant results are observable in Fig. 5 and in Fig. S1.† Based on the relative distribution of the lead compounds in the RGB correlation maps, it appears that minium is always the most abundant phase and well correlated to the red hue in the OM correspondent images. At the edges of the red stains often a mixture of hydrocerussite and cerussite is detected, with a clear more abundance of cerussite over the hydrocerussite in sample D, while for the rest of the samples the HC results relatively more abundant. In sample F1 collected from the Venere-Fiorenza fountain, minium and hydrocerussite are the most abundant phases but also plattnerite (PbO2) is clearly detected in the darker parts of the stain Fig. 5. In almost all samples very few grains of gypsum are identified randomly distributed within the calcite crystal boundaries and within the first 100 μm in depth in the Baptistery and Duomo samples (Fig. S1a†), while it is clearly present only as a thin layer on the surface of the sample F1 from the fountain (Fig. S1b†).Elemental mapping: SEM-EDS analysis & μ-XRF mapping
Elemental analysis was performed both with μ-XRF mapping and SEM-EDS to map the distribution and reveal the possible presence of light elements (such as P and S) that could suggest biological activity.19,20The SR based μ-XRF mapping was performed directly on the same thin sections analysed at ID13 for μ-XRPD mapping while SEM-EDS was performed after graphitization. Both μ-XRF mapping (Fig. S2†) and the semi-quantitative microchemical analysis (Fig. S3†) with SEM-EDS revealed that the lead is usually concentrated in the spaces between the calcite grains, but it can also be present within the calcite crystals (as already observed by Cantisani et al.8 for the Baptistery) and the non-correlation of stains with light elements suggest the absence of biological activity. Back scattered electrons (BSE) were useful to highlight differences in appearance between various lead compounds, with the minium looking more compact than the carbonates (Fig. 6c–f).
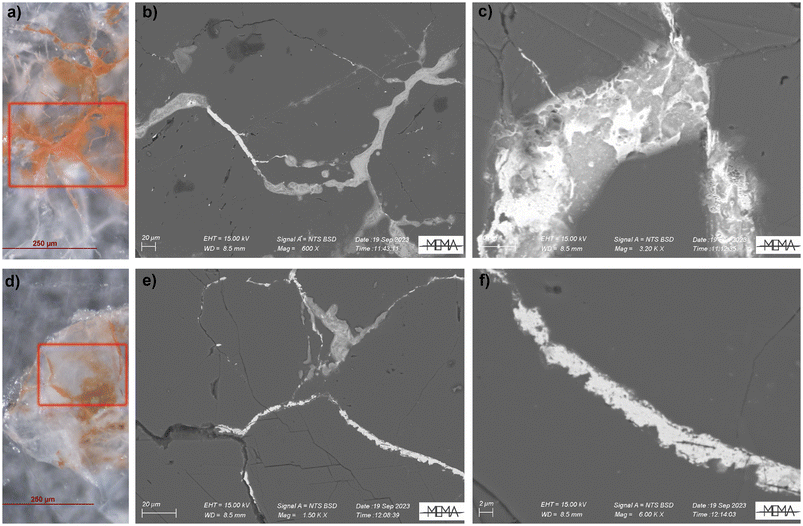 | ||
| Fig. 6 OM and Back Scattered Electron (BSE) images (see red squares) of the analysed areas of the fountain samples, respectively P1 (a–c) and F1 (d–f). | ||
FTIR chemical imaging
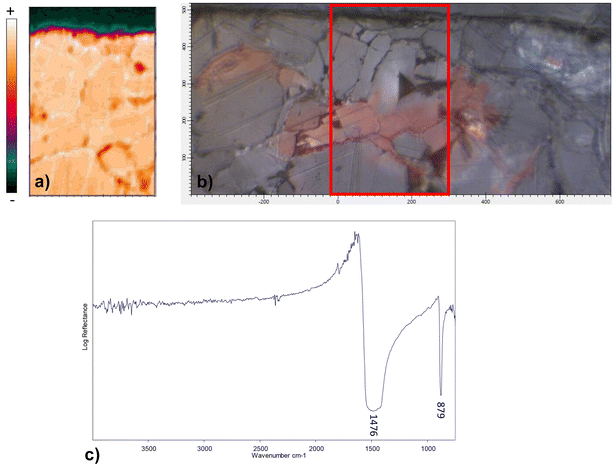
FTIR chemical imaging in reflectance mode was performed on all the samples to check the possible presence of biological growths which has been correlated to red stains formation.2,6 However, only the typical ν3 asymmetric stretching (1476 cm−1) and ν2 out-of-plane bending (874 cm−1) vibrations of carbonate ions,21,22 corresponding to marble, were clearly visible, suggesting the absence of any compound ascribable to the metabolic activity of microorganisms. No compounds other than calcium carbonate were detected in red-stained areas of samples, not even the oxides detected with other techniques (plattnerite, minium), which are inactive in the MIR.23Fig. 7 shows the spatial distribution map for D sample and the same observations can be extended to all the analysed samples.Discussion
To better discuss our hypotheses on the processes, we distinguish between the lead sources involved in the red stains formation on urban-exposed marbles (samples: D, L10-C2, L4P10H3) and those preserved in a historical garden (fountains samples: P1, F1). As already observed for Baptistery, the contribution of lead from air pollution has been excluded by isotopic analysis.8 During a previous restoration campaign minium, mixed with linseed oil, was applied for the treatment of the iron brackets that sustain the marble slabs and this seemed the most probable lead source.8 Since between 1938 and 1944 and from 1952 to 1958 large restoration campaigns were executed on the Opera of S. Maria del Fiore complex, we hypothesize that the same brackets were used also in the restoration of the Cathedral. Instead, in 1983–1984 the restoration intervention by Opificio delle Pietre Dure (OPD) institution on the Venere-Fiorenza fountain highlighted that lead was used to fix the bronze brackets of the fixing system of the marble elements and employed as a covering plate of the basin.24Despite the very different environmental conditions and lead sources, similar mineralogical phases were found in all the samples. SR-based μ-XRPD maps and μ-Raman pointed out that, in all the analysed samples, red colour is mainly given by minium Pb3O4 which is always the most abundant compound. Apart from minium, cerussite PbCO3 and hydrocerussite Pb3(CO3)2(OH)2 were found in its proximity as can be clearly seen from the μ-XRPD maps which also identified small amounts of gypsum. The presence of very few grains of it, just towards the surface of some samples, may suggest the occurrence of sulfation reaction, commonly encountered as alteration on carbonate rocks.25 From the semi-quantitative microchemical analyses conducted with SEM-EDS, the μ-XRF mapping and the FTIR chemical imaging, the absence of organic compounds or light elements weakens the assumption of the role of microorganisms in the oxidation process of lead. These results have prompted us not to further investigate this aspect, also considering that in the cases reported in the literature where microbiological activity has been confirmed, the appearance of marble discoloration is strongly different: pink homogeneous colour well distributed in the affected area accompanied by extensive salt efflorescence.26
Nevertheless, the current approach may not be exhaustive in completely ruling out the biological origin of the red stains. To better investigate this aspect, future studies could be conducted using proteomic methods.27 It was also possible to observe that where μ-XRPD maps showed the prevalence of minium, EDS images clearly reveal lead enrichment and BSE images show a very compact appearance compared to the carbonate enriched areas of the sample.
On the slabs of historical religious buildings, plattnerite was not clearly detected and in the case of sample D higher abundance of cerussite over hydrocerussite was observed, suggesting lower acidic pH. The presence of these compounds and the evidence of the use of minium in combination with linseed oil for the metal brackets suggest that red stains formation could have started from the dissolution of minium followed by the release and transport of Pb2+ ions via rainwater infiltration.28,29
Then, bicarbonate ions (HCO3−), which also enhance the photo-reactivity of minium,30 probably resulting from the interaction between the marble carbonate matrix and rainwater, may have promoted the formation of hydrocerussite and/or cerussite.28,30
In the case of the monumental fountains, SR-based μ-XRPD maps and μ-Raman show clear evidence of crystalline plattnerite in localized areas of F1 sample. The lead source, in this case, most likely originates from the lead pipes and covers that have been extensively subjected to the passage of drinking water.
Several studies dealing with the leaching of lead from plumbing materials used in drinking water transport system underline that lead passivation occurs, over time, by the formation of corrosion products such as cerussite, hydrocerussite and lead oxide in the presence of free chlorine, which was often used in the past for tap water treatment.31–33 Changes in water characteristics (e.g. pH, carbonate and chlorine content) may cause the dissolution of such compounds, with increasing lead release; from our knowledge, frequent maintenance interventions of the fountain were needed throughout time, suggesting a consistently high hardness of the transported water34,35
Experiments on corrosion scale samples from lead pipes revealed, in addition to lead carbonates and lead dioxide, the presence of small amounts of Pb3O4, which has been proposed as an intermediate solid phase of the redox transformation between Pb(II) and Pb(IV) phases.36,37
The staining process on the fountain could have been triggered by the strongly oxidizing conditions of chlorine-based water treatments, which caused the formation of lead corrosion scales in pipes, made of Pb(II) mineral phases (cerussite and hydrocerussite), their further oxidisation32 to minium and, at a lesser extent, to plattnerite.31,33 The precipitation of lead carbonates or oxides is dependent upon changes occurring in different variables such as water pH, the concentration of inorganic ions and of natural organic matter (NOM) and the type of disinfectant used.38–41 As already mentioned, chlorine could have had a significant role in the oxidation of Pb(II) to Pb(IV) also considering that plattnerite precipitation did not occur without the presence of a strong oxidant agent.33,40
The presence of gypsum and the comparable abundance of cerussite and hydrocerussite, except for D sample, conduct us to hypothesise that no extreme alkaline conditions were present during red stains formation in both considered cases. Slight fluctuation in pH could have favoured the alternative formation of these lead carbonates.
Conclusions
The red stains observed on slabs of Florentine historical religious buildings (S. Giovanni Baptistery, S. Maria del Fiore Cathedral) and on the ornamental elements of the monumental fountains (Venere-Fiorenza, Ercole and Anteo) are not exclusively made of minium, also lead carbonate (cerussite, hydrocerussite) and lead dioxide (plattnerite) have been detected. The current approach allowed us to highlight the distribution of lead compounds, while the results obtained did not suggest any contributions from biological activity to the formation of the red stains, at least within the sensitivity limits of the techniques used. It seems that the conservation environment of marble can affect the lead carbonate – lead tetroxide – lead dioxide mineralogical association since those compounds have been found in different abundance.In the case of our samples, water and its pH, the concentration of inorganic ions together with disinfectants in solution and the presence of carbonic acid in the atmosphere seemed the principal factors that contributed to the stains. What is the contribution of each factor to the formation of red stains is still unclear. Moreover, the compact state exhibited by the marble samples prompts us to consider conducting more detailed investigations to determine whether the carbonate matrix contributes to the occurrence and the extent of such phenomenon.
Currently, the term “red stains” in literature refers both to the organic and inorganic origin of such chromatic alterations and this may cause misunderstandings. We believe that the use of a distinct terminology could positively contribute to manage more efficiently these phenomena.
Author contributions
Villani E.: micro-Raman and SEM-EDS analysis, writing, review and editing. Suzuki A.: 2D high resolution X-ray powder diffraction and micro-XRF mapping analyses, writing and review. Ricci M.: micro-Raman data analysis, writing and review. Salvadori B.: FTIR chemical imaging analysis, writing and review. Vettori S.: SEM-EDS analysis, writing, review. Cantisani E.: conceptualization, methodology, project planning, writing, review and editing.Data availlability
All data are available in the main text or the ESI.† Raw data can be made available upon reasonable request. The μ-XRD and μ-XRF data are available in the ESRF repository.Conflicts of interest
There are no conflicts to declare.Acknowledgements
The authors thank prof. Carlo Alberto Garzonio and dott. Fabio Fratini for the micro-samples of Baptistery and Cathedral of Florence (Italy). Dott. Marco Mozzo is acknowledged for micro-samples of monumental fountains. The authors also thank the Centro di Servizi di Microscopia Elettronica e Microanalisi (MEMA), University of Florence for kindly assistance in the use of a Scanning Electron Microscope. We acknowledge the European Synchrotron Radiation Facility for provision of synchrotron radiation facilities and we would like to thank Manfred Burghammer, Alexey Melnikov and Liu Jiliang for assistance in using beamline ID13 (The Historical materials BAG has been implemented with support from the European Union's Horizon 2020 research and innovation programme under grant agreement No 870313, Streamline) and Marine Cotte for the valuable support during the beamtime at ID21.References
- C. Grissom, C. Gervais, N. Little, G. Bieniosek and R. Speakman, APT Bul.: J. Preserv. Technol., 2010, 41, 11–20 Search PubMed.
- M. Bassi, M. Realini and C. Sorlini, Int. Biodeterior., 1986, 22, 201–205 Search PubMed.
- S. Buni, F. Cariati, C. L. Bianchi, E. Zanardini and C. Sorlini, Archaeometry, 1995, 37, 249–255 CrossRef.
- E. Zanardini, S. Bruni, F. Cariati, G. Ranalli and C. Sorlini, in 3rd International Symposium on the Conservation of Monuments in the Mediterranean Basin, Venice, 1994, pp. 349–352.
- C. Sorlini, E. Zanardini, S. Albo, G. Praderio, F. Cariati and S. Bruni, Int. Biodeterior. Biodegrad., 1994, 33, 153–164 CrossRef.
- E. Zanardini, V. Andreoni, S. Borin, F. Cappitelli, D. Daffonchio, P. Talotta, C. Sorlini, G. Ranallib, S. Bruni and F. Cariati, Int. Biodeterior. Biodegrad., 1997, 40, 171–182 CrossRef CAS.
- J. P. Petushkova and N. N. Lyalikova, Stud. Conserv., 1986, 31, 65–69 CrossRef CAS.
- E. Cantisani, O. A. Cuzman, S. Vettori, L. Chelazzi, S. Ciattini, M. Ricci, R. Manganelli Del Fá, L. Chiarantini and C. A. Garzonio, Analyst, 2019, 144, 2375–2386 RSC.
- P. Tiano and L. Tomaselli, Coalition, 2004, 8, 2–4 Search PubMed.
- C. A. Garzonio, E. Cantisan, M. Coli, O. Cuzman, D. De Luca, C. Lubritto, M. Ricci, S. Vettori and E. Sibilia, in Il Battistero di San Giovanni – Conoscenza Diagnostica, Conservazione, ed. F. Gurrieri, Mandragora, Firenze, 2017, pp. 179–191 Search PubMed.
- L. Burgio, R. J. H. Clark and S. Firth, Analyst, 2001, 126, 222–227 RSC.
- M. Cotte, V. Gonzalez, F. Vanmeert, L. Monico, C. Dejoie, M. Burghammer, L. Huder, W. de Nolf, S. Fisher, I. Fazlic, C. Chauffeton, G. Wallez, N. Jiménez, F. Albert-Tortosa, N. Salvadó, E. Possenti, C. Colombo, M. Ghirardello, D. Comelli, E. Avranovich Clerici, R. Vivani, A. Romani, C. Costantino, K. Janssens, Y. Taniguchi, J. McCarthy, H. Reichert and J. Susini, Molecules, 2022, 27, 1997 CrossRef CAS PubMed.
- J. Kieffer, V. Valls, N. Blanc and C. Hennig, J. Synchrotron Radiat., 2020, 27, 558–566 CrossRef CAS PubMed.
- V. A. Solé, E. Papillon, M. Cotte, Ph. Walter and J. Susini, Spectrochim. Acta, Part B, 2007, 62, 63–68 CrossRef.
- https://www.crystallography.net/cod/ .
- C. Riminesi and M. A. Suzuki, Structural analysis of historical materials [dataset], European Synchrotron Radiation Facility, 2025 Search PubMed.
- D. Le Bellac, J. M. Kiat and P. Garnier, J. Solid State Chem., 1995, 114, 459–468 CrossRef CAS.
- A. Amat, F. Rosi, C. Miliani, P. Sassi, M. Paolantoni and S. Fantacci, J. Cult. Herit., 2020, 46, 374–381 CrossRef.
- E. Zanardini, E. May, K. J. Purdy and J. C. Murrell, Environ. Microbiol. Rep., 2019, 11, 147–154 CrossRef CAS PubMed.
- P. G. Falkowski, T. Fenchel and E. F. Delong, Science, 2008, 320, 1034–1039 CrossRef CAS PubMed.
- C. Ricci, C. Miliani, B. G. Brunetti and A. Sgamellotti, Talanta, 2006, 69, 1221–1226 CrossRef CAS PubMed.
- V. Chu, L. Regev, S. Weiner and E. Boaretto, J. Archaeol. Sci., 2008, 35, 905–911 CrossRef.
- E. L. Kendix, S. Prati, E. Joseph, G. Sciutto and R. Mazzeo, Anal. Bioanal. Chem., 2009, 394, 1023–1032 CrossRef CAS PubMed.
- M. Matteini, A. Moles, C. Manganelli, F. Fratini, L. Lazzarini and M. Pecoraro, Schede di restauro: Fonte del Labirinto o di Fiorenza, Firenze, 1986 Search PubMed.
- D. Camuffo, M. Del Monte, C. Sabbioni and O. Vittori, Atmos. Environ., 1982, 16, 2253–2259 CrossRef CAS.
- I. Silva, L. Dias, C. Salvador, A. Z. Miller, A. Candeias and A. T. Caldeira, J. Cult. Herit., 2024, 67, 248–257 CrossRef.
- K. L. Rasmussen, B. B. Rasmussen, T. Delbey, I. Bonaduce, F. Kjeldsen and V. Gorshkov, Heritage Sci., 2024, 12, 18 CrossRef CAS.
- A. Coccato, L. Moens and P. Vandenabeele, Heritage Sci., 2017, 5, 1–25 CrossRef.
- D. A. Fraser and L. T. Fair Hall, Public Health Rep., 1959, 76, 501–510 CrossRef.
- E. Kotulanová, P. Bezdička, D. Hradil, J. Hradilová, S. Švarcová and T. Grygar, J. Cult. Herit., 2009, 10, 367–378 CrossRef.
- J. D. Noel, Y. Wang and D. E. Giammar, Water Res., 2014, 54, 237–246 CrossRef CAS PubMed.
- P. Delahay, M. Pourbaix and P. Van Rysselberghe, J. Electrochem. Soc., 1951, 98, 57 CrossRef CAS.
- H. Liu, G. V. Korshin and J. F. Ferguson, Environ. Sci. Technol., 2009, 43, 3278–3284 CrossRef CAS PubMed.
- M. P. Demma and G. Favara, La fontana Pretoria in Palermo, Assessorato dei Beni Culturali Ambientali e della Pubblica Istruzione, 2006 Search PubMed.
- C. Acidini Luchinat, Fiorenza in Villa, Stampa Nazionale, Firenze, 1987 Search PubMed.
- E. J. Kim and J. E. Herrera, Environ. Sci. Technol., 2010, 44, 6054–6061 CrossRef CAS PubMed.
- D. Guo, C. Robinson and J. E. Herrera, Corros. Sci., 2016, 103, 42–49 CrossRef CAS.
- C. Kushnir and C. E. Robinson, Water Qual. Res. J., 2021, 56, 194–204 CrossRef CAS.
- D. A. Lytle and M. R. Schock, Am. Water Works Assoc., 2005, 97, 102–114 CrossRef CAS.
- J. D. Pasteris, Y. Bae, D. E. Giammar, S. N. Dybing, C. H. Yoder, J. Zhao and Y. Hu, Minerals, 2021, 11, 1047 CrossRef CAS.
- D. Guo, C. Robinson and J. E. Herrera, Environ. Sci. Technol., 2014, 48, 12525–12532 CrossRef CAS PubMed.
Footnote |
| † Electronic supplementary information (ESI) available. See DOI: https://doi.org/10.1039/d4an00692e |
| This journal is © The Royal Society of Chemistry 2024 |

