Comparison of different fast gas chromatography – mass spectrometry techniques (Cold EI, MS/MS, and HRMS) for the analysis of pyrethroid insecticide residues in food†‡
Nicolás
Michlig
 a,
Aviv
Amirav
 bc,
Benny
Neumark
b and
Steven J.
Lehotay
 *a
*a
aU.S. Department of Agriculture, Agricultural Research Service, Eastern Regional Research Center, 600 East Mermaid Lane, Wyndmoor, PA 19038, USA. E-mail: Steven.Lehotay@usda.gov
bSchool of Chemistry, Tel Aviv University, Tel Aviv 6997801, Israel
cAviv Analytical Ltd, 24 Hanagar Street, Hod Hasharon 4527713, Israel
First published on 23rd July 2024
Abstract
In the multiclass, multiresidue analysis of pesticides in food and environmental samples, pyrethroid insecticides are generally more difficult to analyze than other types of analytes. They do not ionize well by electrospray ionization, and although they are suitable for analysis by gas chromatography-mass spectrometry (GC-MS), selectivity using standard electron ionization (EI) in GC-MS is often insufficient because the molecular ion is rarely present. Many pyrethroids tend to have the same fragment ions in MS or high-resolution (HR)MS, and similar ion transitions in tandem MS/MS, leading to difficulties in distinguishing different pyrethroids from each other and chemical interferences in complex matrices. In this study, different forms of fast GC coupled with different types of MS detectors were compared for the analysis of up to 15 pyrethroids in barley extracts as a test case to assess which approach was the most advantageous. The three studied GC-MS techniques consisted of Cold EI using supersonic molecular beams in selected ion monitoring (SIM) mode with a single quadrupole instrument; triple quadrupole MS/MS; and HRMS using an orbital ion trap (orbitrap). A higher flow rate was used in Cold EI, and low pressure (LP) GC was employed in the MS/MS and orbitrap methods, to speed up the GC analyses (<10 min chromatograms in all cases). Each technique had some advantages over the others depending on specific pyrethroid analytes in the matrix. Nontargeted LPGC-orbitrap typically yielded the highest selectivity, but it rarely achieved the needed detectability to quantidentify the residues at 10 ng g−1. Cold EI-SIM and LPGC-MS/MS usually met the needed detection limits and generally achieved similar capabilities for the targeted pyrethroids.
1 Introduction
Currently, pesticide residues in food, environmental, and other matrices are most commonly analyzed by both gas and liquid chromatography coupled with triple quadrupole tandem mass spectrometry (GC-MS/MS and LC-MS/MS). However, MS/MS is a targeted approach with a limited number of analytes that can be monitored in 10–40 min chromatograms. Multiclass, multiresidue methods typically target 300–350 pesticides, but more than 1600 pesticides could be applied during crop production, leading to a great shortfall in the analytical monitoring scope. Any nontargeted pesticide illegally present in the sample would be a false negative, and the purpose for the analyses would be partially unmet. Furthermore, the regulatory need generally calls for 10 ng g−1 limits of quantification (LOQs) for unregistered pesticides in food crops. Only MS/MS currently meets this need for most of the pesticide analytes due to its optimized conditions for high sensitivity and selectivity for each analyte. However, the limited scope of analysis in MS/MS calls for a major improvement in the way pesticides are analyzed.In full-scan GC-MS using standard electron ionization (EI), the selectivity against matrix interference was found to increase by about 20-fold per 100 m/z increase.1 Thus, the use of molecular ions (M+) in MS-based methods tends to greatly enhance selectivity (and thereby lower LOQs) in the analysis of pesticides in agricultural products. Electrospray ionization (ESI) commonly used in LC-MS methods predominantly generates M + H ions in the positive mode, which serves as a main reason for its ability to achieve such low LOQs in complex matrices. EI in GC-MS induces greater fragmentation, which can be helpful to better identify the analytes, but the frequent lack of M+ in the mass spectra worsens selectivity and increases LOQs. Cold EI using supersonic molecular beams (SMBs) in GC-MS nearly always enhances the intensity of the M+ peak, among many other advantageous features, leading to both increased selectivity and sensitivity.
Unlike GC-MS using standard EI, Cold EI entails the ionization of vibrationally cold sample compounds in the SMB that are directed through a contact-free fly-through ion source. This type of ionization using the fly-through source is more efficient than standard EI, and even though the M+ is enhanced, enough fragmentation still occurs to provide accurate searching and identification of analyzed chemicals in commercial MS libraries. An increased GC column flow rate can be used in Cold EI to greatly increase the speed of analysis and extend the range of low-volatility and thermally labile compounds without decreasing sensitivity. Cold EI was developed by Amirav and his group in 1990,2,3 reviewed,4,5 and published in a book.6 Its features and applications are highlighted in several papers.7–16
Pyrethroid insecticides are a particularly difficult class of commonly applied pesticides to analyze by multiclass, multiresidue methods. Pyrethroids are synthetic compounds related to natural pyrethrins that have been extensively used in many agricultural crops for decades due to their reduced acute toxicity and low environmental persistence compared to organophosphate and organochlorine insecticides. Pyrethroids are esters of chrysanthemic acid [2,2-dimethyl-3-(2-methylprop-1-enyl)cyclopropane-1-carboxylic acid], and depending on their chemical structures, they are classified as either type I or II. Type II pyrethroids have a cyano group at the α-carbon of the ester, unlike type I. Fig. 1 shows the chemical structures of type I (allethrin, bifenthrin, etofenprox, permethrins, phenothrin, prallethrin, resmethrin, and tetramethrin) and type II compounds (cyfluthrin, λ-cyhalothrin, cypermethrin, cyphenothrin, deltamethrin, es/fenvalerate, fenpropathrin, and fluvalinate). The base fragment ion peaks in standard EI-MS are circled in each structure, and Table S1 (ESI‡) provides the relative abundances for each exact mass ion in high-resolution (HR)MS as described in the table caption.
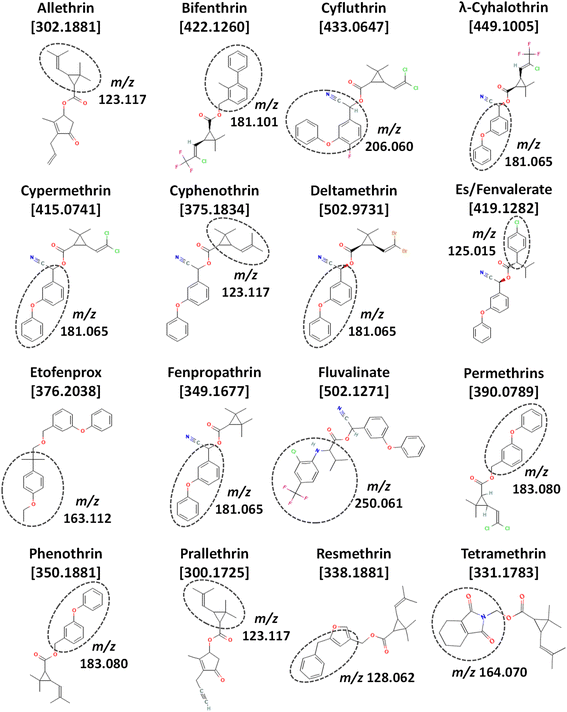 | ||
| Fig. 1 Chemical structures (from PubChem), exact mass monoisotopic molecular ions (m/z), and standard EI-MS base peak fragment ions of the 16 pyrethroids in this study, including prallethrin. | ||
In real-world monitoring of foods, Fig. 2 lists the number of determinations of pyrethroid residues among 305![[thin space (1/6-em)]](https://www.rsc.org/images/entities/char_2009.gif) 773 samples from 1994–2022 involving 133 diverse types of foods and beverages in the USDA Pesticide Data Program.17 In all, 40
773 samples from 1994–2022 involving 133 diverse types of foods and beverages in the USDA Pesticide Data Program.17 In all, 40![[thin space (1/6-em)]](https://www.rsc.org/images/entities/char_2009.gif) 495 samples were reported to contain at least one pyrethroid insecticide, and Fig. 3 plots the number (and %) of pyrethroids that were found in these positive samples. No sample contained more than 5 pyrethroids. These 6 samples (0.015% of the positives) consisted of kale (3), frozen spinach, mustard greens, and a peach. The latter was analyzed in 2013, and the 5 others were from 2017–2019. All 6 samples contained 2–84 ng g−1 bifenthrin, 13–469 ng g−1 cyfluthrin, and 3–510 ng g−1 λ-cyhalothrin; 5 contained 31–860 ng g−1 cypermethrin and/or 2–1400 ng g−1 permethrins, and one each out of the 6 contained 26 ng g−1 es/fenvalerate or 13 ng g−1 fenpropathrin. As shown in Fig. 2, these constitute the top 7 pyrethroids reported in PDP samples, but for reasons shown in this work, an unknown small number of false positives likely met analytical confirmation criteria, especially at ultra-trace concentrations.
495 samples were reported to contain at least one pyrethroid insecticide, and Fig. 3 plots the number (and %) of pyrethroids that were found in these positive samples. No sample contained more than 5 pyrethroids. These 6 samples (0.015% of the positives) consisted of kale (3), frozen spinach, mustard greens, and a peach. The latter was analyzed in 2013, and the 5 others were from 2017–2019. All 6 samples contained 2–84 ng g−1 bifenthrin, 13–469 ng g−1 cyfluthrin, and 3–510 ng g−1 λ-cyhalothrin; 5 contained 31–860 ng g−1 cypermethrin and/or 2–1400 ng g−1 permethrins, and one each out of the 6 contained 26 ng g−1 es/fenvalerate or 13 ng g−1 fenpropathrin. As shown in Fig. 2, these constitute the top 7 pyrethroids reported in PDP samples, but for reasons shown in this work, an unknown small number of false positives likely met analytical confirmation criteria, especially at ultra-trace concentrations.
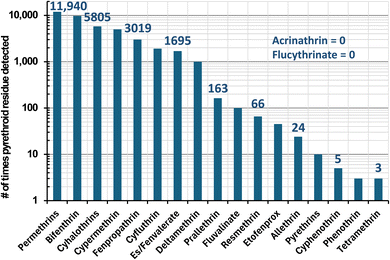 | ||
Fig. 2 Number of times in the USDA Pesticide Data Program among 305![[thin space (1/6-em)]](https://www.rsc.org/images/entities/char_2009.gif) 773 food samples from 1994–2022 that the listed pyrethroids were detected (note: not all pyrethroids were monitored in all years). 773 food samples from 1994–2022 that the listed pyrethroids were detected (note: not all pyrethroids were monitored in all years). | ||
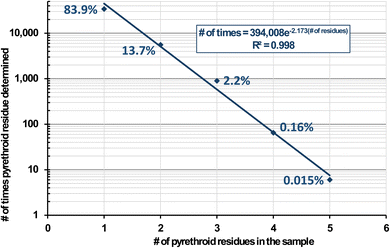 | ||
Fig. 3 Number of times (and %) in the USDA Pesticide Data Program from 1994–2022 in which at least 1 pyrethroid was detected in 40![[thin space (1/6-em)]](https://www.rsc.org/images/entities/char_2009.gif) 495 food samples. 495 food samples. | ||
The PDP is intended for risk assessment purposes, not regulatory enforcement monitoring, so low LOQs are desired. In the 40![[thin space (1/6-em)]](https://www.rsc.org/images/entities/char_2009.gif) 495 reported positives in Fig. 2 and 3, the determined pyrethroid concentrations were <1 ng g−1 (0.73%), 1–10 ng g−1 (28.0%), 10–100 ng g−1 (42.4%), 100–1000 ng g−1 (19.2%) and >1000 (9.7%). As shown in Table 1 with respect to the PDP, GC-MS/MS has served as the most widely used technique for the analysis of pyrethroids. In monitoring labs, the selective detectors in GC were replaced by GC-MS about 20 years ago, which has been supplanted by GC-MS/MS in the past decade. LC-MS/MS has only started to be used for pyrethroids in the past few years, which can be tracked in the PDP by searching the online database by year.17
495 reported positives in Fig. 2 and 3, the determined pyrethroid concentrations were <1 ng g−1 (0.73%), 1–10 ng g−1 (28.0%), 10–100 ng g−1 (42.4%), 100–1000 ng g−1 (19.2%) and >1000 (9.7%). As shown in Table 1 with respect to the PDP, GC-MS/MS has served as the most widely used technique for the analysis of pyrethroids. In monitoring labs, the selective detectors in GC were replaced by GC-MS about 20 years ago, which has been supplanted by GC-MS/MS in the past decade. LC-MS/MS has only started to be used for pyrethroids in the past few years, which can be tracked in the PDP by searching the online database by year.17
![[thin space (1/6-em)]](https://www.rsc.org/images/entities/char_2009.gif) 182 determinations and 39
182 determinations and 39![[thin space (1/6-em)]](https://www.rsc.org/images/entities/char_2009.gif) 688 confirmations in the USDA Pesticide Data Program of pyrethroid residues in 305
688 confirmations in the USDA Pesticide Data Program of pyrethroid residues in 305![[thin space (1/6-em)]](https://www.rsc.org/images/entities/char_2009.gif) 773 food samples from 1994–2022 that each technique was used in the analysis
773 food samples from 1994–2022 that each technique was used in the analysis
| Analyte | Determination | Confirmation |
|---|---|---|
| GC (not MS) | 16.0% | 13.8% |
| GC-MS | 15.9% | 17.4% |
| GC-MS/MS | 62.7% | 67.7% |
| LC-MS/MS | 1.0% | 1.1% |
In standard EI, pyrethroids undergo extensive fragmentation often with a weak or absent M+. The main fragments usually have low m/z that is common among many pyrethroids. Geometric isomers abound in the pyrethroid structures, often leading to complications in their chromatographic separations. Some pyrethroids can have 4 or 8 stereoisomers that are usually resolved into 2 or 4 enantiomeric peaks in conventional chromatography.18–20 Adding to the difficulties, pyrethroid isomers can be inter-converted during sample preparation or GC analysis, affecting their results.21,22 Furthermore, thermally labile pyrethroids, like tralomethrin, can be converted to deltamethrin in a reproducible way during GC injection.23
In the literature, LC-ESI-MS/MS was shown to perform well in the analysis of 30 pyrethroids in fruits and vegetables.24 Similarly, LC-ESI-MS/MS and LC-ESI-quadrupole (Q)/HRMS gave good performance for 19 pyrethroids in tea and orange.25 However, the conditions used in those methods were tailored for pyrethroids only, and the same conditions would not work as well for other classes of pesticides. Even so, some labs choose to sacrifice some performance factors by including pyrethroids in their multiclass, multiresidue methods using LC-MS/MS. However, if they only use LC-MS methods for monitoring, this also sacrifices many other nonpolar pesticides that can only be analyzed by GC. If a lab wishes to achieve the widest analytical scope, then GC is still needed, and if they use GC methods, then those methods should include pyrethroids.
Thus, multiclass, multiresidue analysis of foods (and other matrices) currently involve both GC and LC separations to cover the broad range of pesticides and other types of analytes that need to be monitored. Furthermore, it is better to include as many analytes as possible in MS-based detections in both LC and GC for the sake of duplication and verification of findings via orthogonally selective methods.26
The aim of this study was to compare the capabilities of 3 different MS detection techniques (Cold EI, MS/MS, and orbitrap HRMS) coupled with fast-GC separations of 15 pyrethroids in the quick, easy, cheap, effective, rugged, safe, efficient, and robust (QuEChERSER) mega-method extracts of barley.27–29 Although only pyrethroids are the focus of this report, the full QuEChERSER validation study included 525 pesticides, environmental contaminants, veterinary drugs, and mycotoxins, which will be reported separately elsewhere.
2 Materials and methods
2.1 Reagents and standards
Reference standards of high-purity pyrethroid insecticides were obtained from the EPA National Pesticide Repository (Fort Meade, MD; USA), ChemService (West Chester, PA; USA), or AccuStandard (New Haven, CT; USA). Shikimic acid used as an analyte protectant in low-pressure (LP) GC was from Sigma-Aldrich (St. Louis, MO; USA). MS-grade acetonitrile (MeCN) was from Fisher Scientific (Pittsburgh, PA; USA). Solid-phase extraction (SPE) mini-cartridges for automated cleanup via instrument-top sample preparation (ITSP), consisting of 20 mg anh. MgSO4, 12 mg each of C18 and primary secondary amine, and 1 mg CarbonX, were purchased from ITSP Solutions (Hartwell, GA; USA). Also, 15 mL polypropylene (PP) centrifuge tubes containing 2 g of 4/1 (w/w) anh. MgSO4/NaCl were from Agilent (Little Falls, DE; USA).2.2 Sample preparation
QuEChERSER extracts of milled barley were obtained by weighing 2 g test portions into 15 mL PP centrifuge tubes and adding 10 mL of 4/1 (v/v) MeCN/water. The tubes were capped and vortexed for 10 min using a Glas-Col (Terre-Haute, IN; USA) platform pulsed shaker at 80% intensity with maximum pulsation. Then the tubes were centrifuged for 3 min at room temperature and 3711 rcf using a Kendro (Osterode, Lower Saxony; Germany) Sorvall Legend RT swinging bucket centrifuge. A 200 μL aliquot was taken from each extract for separate LC-MS/MS analysis of LC-amenable analytes, and the remaining ≈9.8 mL supernatant was then decanted into QuEChERSER salt tubes listed in Section 2.1, which were shaken for 1 min followed by centrifugation as before. For ITSP cleanup, 800 μL aliquots of the upper layers were transferred to amber glass autosampler vials, and 300 μL of each extract was passed through 45 mg ITSP mini-cartridges at 2 μL s−1 into the receiving vial (yielding ≈220 μL) for injection of 3 μL into each respective GC-MS system. The final extracts were equivalent to 0.25 g sample per mL, and 0.75 mg equivalent sample was injected.2.3 Instrumental analysis
| Analyte | M+ (m/z) | t R (min) | Ion 1 (m/z) | Ion 2 (m/z) | Ion 3 (m/z) |
|---|---|---|---|---|---|
| a nd = not done. | |||||
| Bifenthrin | 422.1 | 3.64 | 422.1 | 424.1 | 181.1 |
| Cyfluthrin | 433.1 | 4.17 | 433.0 | 435.0 | 209.1 |
| λ-Cyhalothrin | 449.1 | 3.86 | 449.1 | 451.1 | 208.1 |
| Cypermethrin | 415.1 | 4.24 | 415.1 | 417.1 | 209.1 |
| Deltamethrin | 503.0 | 4.58 | 505.1 | 507.1 | 253.0 |
| Permethrins | 390.1 | 4.02 | 390.1 | 392.1 | 183.1 |
| Phenothrin | 350.2 | 3.70 | 350.2 | 351.2 | 183.1 |
| Resmethrin | 338.2 | 3.49 | 338.2 | 339.2 | 171.1 |
| Tetramethrin | 331.2 | 3.57 | 331.1 | Nd | 164.1 |
| Analyte | HRMS | MS/MS | ||||||
|---|---|---|---|---|---|---|---|---|
| t R (min) | Ion 1 (m/z) | Ion 2 (m/z) | Ion 3 (m/z) | t R (min) | Ion 1 (m/z) | Ion 2 (m/z) | Ion 3 (m/z) | |
| Allethrin | 5.26 | 123.1168 | 79.0542 | 107.0856 | 5.21 | 123 → 81 | 136 → 77 | 136 → 93 |
| Bifenthrin | 6.05 | 181.1012 | 182.1045 | 166.0777 | 5.99 | 181 → 165 | 181 → 166 | 181 → 141 |
| Cyfluthrin | 6.64 | 206.0600 | 127.0310 | 163.0081 | 6.58 | 206 → 151 | 163 → 91 | 163 → 127 |
| λ-Cyhalothrin | 6.28 | 181.0647 | 197.0339 | 141.0511 | 6.21 | 181 → 152 | 197 → 141 | 197 → 91 |
| Cypermethrin | 6.74 | 181.0648 | 163.0076 | 127.0309 | 6.68 | 181 → 152 | 163 → 127 | 163 → 91 |
| Cyphenothrin | 6.39 | 181.0647 | 123.1170 | 167.1060 | 6.32 | 181 → 152 | 123 → 81 | 123 → 79 |
| Deltamethrin | 7.26 | 173.9862 | 171.9882 | 252.9046 | 7.17 | 181 → 152 | 181 → 127 | 181 → 77 |
| Esfenvalerate | 6.99 | 125.0153 | 225.0784 | 167.0622 | 6.92 | 167 → 125 | 167 → 89 | 167 → 77 |
| Etofenprox | 6.79 | 163.1117 | 135.0804 | 107.0491 | 6.72 | 163 → 107 | 163 → 135 | 163 → 95 |
| Fenpropathrin | 6.10 | 265.0734 | 180.0807 | 181.0647 | 6.04 | 265 → 210 | 181 → 127 | 265 → 89 |
| Fenvalerate | 7.06 | 125.0153 | 225.0784 | 167.0622 | 6.99 | 167 → 125 | 167 → 89 | 167 → 77 |
| Fluvalinate | 7.02 | 250.0607 | 252.0577 | 200.0681 | 6.95 | 250 → 55 | 250 → 200 | 250 → 180 |
| Permethrins | 6.49 | 183.0804 | 163.0076 | 127.0309 | 6.44 | 183 → 168 | 183 → 153 | 183 → 77 |
| Phenothrin | 6.15 | 183.0804 | 123.1168 | 184.0838 | 6.09 | 183 → 168 | 183 → 155 | 183 → 77 |
| Resmethrin | 5.93 | 143.0855 | 171.0804 | 123.1168 | 5.88 | 142 → 128 | 171 → 142 | 171 → 128 |
| Tetramethrin | 6.07 | 164.0706 | 165.0738 | 135.0441 | 6.01 | 164 → 79 | 164 → 107 | 164 → 91 |
![[thin space (1/6-em)]](https://www.rsc.org/images/entities/char_2009.gif) 000 FWHM resolution with automatic gain control of 1 × 10⁶. Thermo TraceFinder 5.1 was used for data processing for the listed pyrethroids, and their tR and HRMS fragment ions are given in Table 3.
000 FWHM resolution with automatic gain control of 1 × 10⁶. Thermo TraceFinder 5.1 was used for data processing for the listed pyrethroids, and their tR and HRMS fragment ions are given in Table 3.
3 Results and discussion
The Cold EI results in this study were obtained at the School of Chemistry of Tel Aviv University in Israel, and the LPGC-(HR)MS(/MS) analyses were carried out at the USDA-ARS Eastern Regional Research Center in the USA. The same vials of the final barley extracts were transferred from the MS/MS to the orbitrap instrument one day apart, recapped, and then stored at −18 °C in a freezer for 18 months before being transferred to Israel at room temperature under storage at 4 °C until analysis by Cold EI a few months later. Dorweiler et al. demonstrated no appreciable degradation of pyrethroids stored in MeCN.30 However, a few of the pyrethroids were believed to have partially degraded prior to the analyses using Cold EI in Israel, but this could not be proven.In total, 322 analytes of pesticides and environmental contaminants were added to the barley extracts and matrix-matched standards, 266 of which were monitored in the LPGC methods (this report only focuses on the 15 pyrethroids in the mixture). Of these, only 9 were targeted in Cold EI because reference standards were not available for the other 8 pyrethroids in the lab in Israel.
Table S1 (ESI‡) lists all the common and unique empirical exact mass fragment ions in the Thermo orbitrap and NIST libraries for the different pyrethroids in the study, and we also included the measured HRMS spectra from this study for cyphenothrin, fluvalinate, and phenothrin. This table serves as a good reference in the discussion to follow, but it is also intended to be a useful resource to others conducting GC-EI-MS analysis of these complicated analytes in different applications. We curated duplicative ions with >10% relative abundance for at least one analyte within 1 m/z unit to improve their HRMS accuracy with respect to feasible molecular formulae for the specific pyrethroids.
One noteworthy recognition about curation of Table S1‡ is that contributions from 13C, which constitute ≈1.1% of natural carbon on earth, often led to substantial relative ion abundances at m/z +1.0033 from the base ion peaks. For example, m/z 181.0648 corresponding to C13H9O was the base peak for 4 pyrethroids in Table S1.‡ For 13 carbons in a molecule with 1.1% chance of 13C being present, the theoretical relative abundance becomes 14% at m/z 182.0682. Indeed, that exact mass ion had a relative abundance of 14% for every pyrethroid with m/z 181.0648 as the base peak. The contribution of 13C increases as the number of carbons increase, which provides an additional advantage of the enhanced M+ in Cold EI. The relative abundance of the M + 1 ion for fluvalinate, for example, with 26 carbons is 29% that of the M+ ion. If the M+ signal for an analyte is relatively high, then M + 1 is also usually detectable with a high qualitative and quantitative value for making accurate quantidentifications. Isotopes of Cl and Br are even more distinctive and prevalent, which is why M+, M + 1, and/or M + 2 ions were chosen for the analytes in Cold EI-SIM as listed in Table 2. Like the exact mass in HRMS, the ratios of these ions at sufficient concentrations in a clean background can be used to accurately determine the molecular formula of the compound or fragment ion.11
3.1 Comparison of results
Fig. 4–12 show a comparison of each fast-GC-MS technique demonstrating the detectabilities (a combination of both sensitivity and selectivity in a real matrix)9 for the 9 pyrethroid analytes at 100 ng g−1 in the barley final extracts. Table 4 compiles the LOQs and limits of identification (LOIs) for each analyte and detection technique in the study. Since at least two ions are generally needed for targeted analyte identification purposes, the LOI is estimated to be the second lowest LOQ among the 3 ions chosen for analysis. LOQs for each ion were estimated by measuring and extrapolating the signal/noise ratio (S/N). The LOQ is the concentration at which S/N = 10 with root mean square (rms) noise calculated as 1/5 of the peak-to peak electronic noise. In some instances using LPGC-orbitrap analysis, no electronic noise was observed due to an underlying response threshold applied by the instrument software. In those cases, the LOQ was estimated to be the concentration at the minimum discernible peak area for an analyte calculated from the best-fit least linear squared calibration line for that analyte.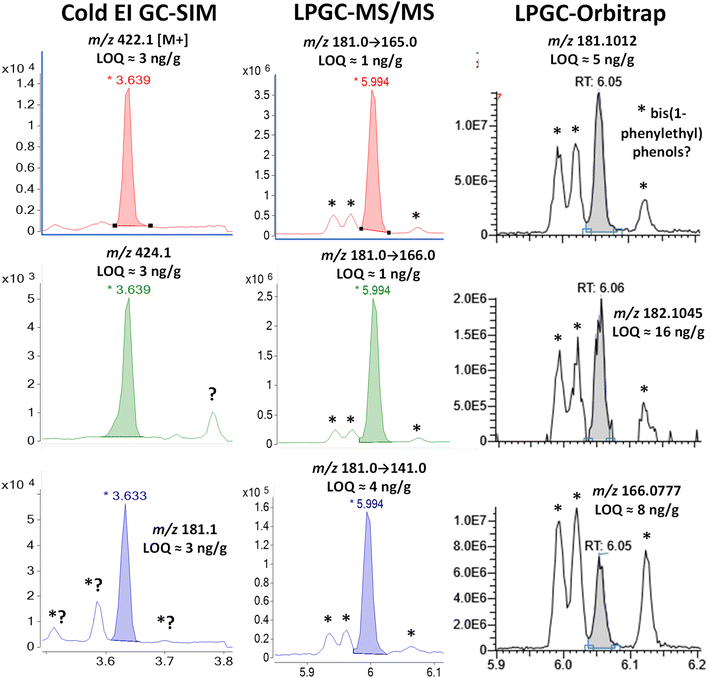 | ||
| Fig. 4 Comparison in the analysis of 100 ng g−1 (75 pg injected) bifenthrin in the barley extract using different fast GC-MS techniques. The peaks marked with * were identified as 2,4-bis(1-phenylethyl)phenol by LPGC-orbitrap using the NIST library (see Fig. S3‡), and the 3 peaks presumably consist of the 2,4-, 2,5-, and 3,5-structural isomers originating from nitrile gloves. | ||
| Analyte | Cold EI-SIM | LPGC-MS/MS | LPGC-orbitrap | |||
|---|---|---|---|---|---|---|
| LOQ | LOI | LOQ | LOI | LOQ | LOI | |
| a n.a. = not analyzed. | ||||||
| Allethrin | n.a. | n.a. | 6 | 7 | 18 | 50 |
| Bifenthrin | 3 | 3 | 1 | 1 | 5 | 8 |
| Cyfluthrin | 12 | 12 | 10 | 12 | 36 | 68 |
| λ-Cyhalothrin | <1 | 5 | 3 | 6 | 11 | 33 |
| Cypermethrin | 6 | 6 | 5 | 6 | 39 | 100 |
| Cyphenothrin | n.a. | n.a. | 31 | ? | 67 | >100 |
| Deltamethrin | 5 | 6 | ? | ? | 7 | 7 |
| Es/Fenvalerate | n.a. | n.a. | <1 | <1 | 8 | 13 |
| Etofenprox | n.a. | n.a. | <1 | <1 | 12 | 22 |
| Fenpropathrin | n.a. | n.a. | 2 | 3 | 8 | 50 |
| Fluvalinate | n.a. | n.a. | <1 | <1 | 2 | 7 |
| Permethrins | 4 | 8 | 8 | 11 | 16 | 96 |
| Phenothrin | 6 | 6 | 5 | 6 | 8 | 25 |
| Resmethrin | 12 | 17 | 6 | 8 | 24 | 36 |
| Tetramethrin | 6 | 9 | 3 | 3 | 8 | 21 |
Chemical noise is apparent in several ion chromatograms and often labeled when the interferant originates from another pyrethroid analyte. The extracts contained 322 pesticides and environmental contaminants added at similar concentrations, including the 15 pyrethroids (plus prallethrin) in this study, but real samples contain relatively few residues that would occur at different levels. Unlike the situation shown in many of these examples, analyte-to-analyte chemical interferences are not such a severe problem in real-world analyses (see Fig. 2 and S1‡). Although it is still important to distinguish individual analytes from each other, interferences from one analyte to another should not be the limiting factor in assessing the LOQs because only matrix interferences would usually affect LOQs in real-world samples. For the highest accuracy in regulatory enforcement applications (for example), calibration standards should mimic the specific analytes and concentration range identified in suspect samples.31 In other words, the main “problem” with analyte-to-analyte interferences arises from the practical use of large analyte mixtures in calibration and validation experiments, and rarely do partially co-eluting analytes occur in the same sample. Thus, chemical noise from other analytes was not considered in the estimated LOQs and LOIs in Fig. 4–12 and Table 4.
As calculated from Table 4, the average LOQs for the 9 shared analytes were 6, 5, and 17 ng g−1 in fast-GC Cold EI-SIM, LPGC-MS/MS, and LPGC-orbitrap, respectively. For the same subset of 9 pyrethroids, the average LOIs were 8, 7, and 44 ng g−1. Similar average LOQs and LOIs were obtained for all 15 pyrethroids analyzed by MS/MS and orbitrap. Cold EI-SIM achieved the lowest calculated LOQs for 3 out of the 9 shared analytes, whereas MS/MS attained the lowest LOQs for 7 of them. In the case of LOIs, both Cold EI-SIM and MS/MS yielded the lowest values for 6 shared analytes (counting ties for both techniques). The HRMS orbitrap instrument was not able to achieve lower LOQs or LOIs than the other approaches for any of the 9 (or 15) pyrethroids, but it outperformed LPGC-MS/MS for deltamethrin, which was unable to be quantidentified due to reagent interferences. In terms of meeting the typical 10 ng g−1 LOQ for regulatory food monitoring applications, Cold EI-SIM, MS/MS, and orbitrap HRMS met this need for 7, 8, and 4 out of the 9 shared analytes, respectively (and 7, 7, and 2 out of 9 with respect to LOIs). Taking into account all 15 pyrethroids in MS/MS, 14 and 12 of the of the analytes yielded LOQs and LOIs ≤10 ng g−1, respectively, but only 7 and 3 of them met that criterion using orbitrap detection.
Regardless of the selectivity differences observed in Fig. 4–12, the targeted Cold EI-SIM and MS/MS methods yielded very similar detectabilities in this study, but the nontargeted HRMS orbitrap approach could not match them. The detection mechanism in orbitrap instruments cannot achieve the same degree of sensitivity provided by ion detection with electron multipliers since induced current detection is limited by amplifier noise in orbitraps. Furthermore, the cleanliness of the instruments may have been a factor in LOQs, but in the LPGC methods, the same number of injections of shared samples had been made using the same maintenance schedules on both the MS/MS and orbitrap instruments. Instrument robustness is probably the most important factor in routine analyses, and if the lowest possible LOQs for the instruments were not achieved in this comparison, that also reflects instrument performance during real-world usage. In the case of Cold EI, the samples were injected into an old liner and column, and the fly-through ion source has proven to be so robust that it has not been serviced since its installation in 2011. Regrettably, full-scan MS was not used in this study for barley samples in Cold EI, and we have plans to evaluate the technique in a full QuEChERSER validation study when possible. Otherwise, the orbitrap technique has excellent advantages of generally greater selectivity, full-spectral data acquisition, and the possibility for retrospective analysis for additional analytes. The targeted and nontargeted methods are complementary with regards to different advantages and disadvantages in each case, as further discussed in the sections to follow.
Although LPGC separation sufficiently resolved the analyte from the observed chemical interferences in both MS/MS and orbitrap analyses, 3 significant peaks surrounded the tR of bifenthrin. Fig. S3 and S4 (ESI‡) show the background-subtracted HRMS and NIST library search finding of the third peak at 6.12 min. The search probability was 88% and the chemical noise originated from 2,4-bis(1-phenylethyl)phenol, which is additionally supported by the observation that the m/z 302.1662 ion matched the calculated m/z 302.167![[thin space (1/6-em)]](https://www.rsc.org/images/entities/char_2009.gif) 053 for C22H22O within ±3 ppm. The other two peaks at 5.99 and 6.02 min had the same spectra plus an m/z 223.1115 (C16H15O) ion with 25% relative abundance. We postulated that the chromatographic peaks consisted of 3 structural isomers of bis(1-phenylethyl)phenol, but the NIST library only contains the 2,4-isomer. Further investigation of the literature uncovered that Mutsuga et al. found the exact same pattern of peaks and HRMS spectra in leachates from nitrile gloves.32 Their NMR analysis of gel-permeation chromatography fractions suggested that the first two peaks were stereoisomers of 2,6-bis(1-phenylethyl)phenol, which they referred to as 2,6-di(α-methylbenzyl)phenol. We did not purchase standards of these compounds, so we did not confirm the full-scan HRMS identifications.
053 for C22H22O within ±3 ppm. The other two peaks at 5.99 and 6.02 min had the same spectra plus an m/z 223.1115 (C16H15O) ion with 25% relative abundance. We postulated that the chromatographic peaks consisted of 3 structural isomers of bis(1-phenylethyl)phenol, but the NIST library only contains the 2,4-isomer. Further investigation of the literature uncovered that Mutsuga et al. found the exact same pattern of peaks and HRMS spectra in leachates from nitrile gloves.32 Their NMR analysis of gel-permeation chromatography fractions suggested that the first two peaks were stereoisomers of 2,6-bis(1-phenylethyl)phenol, which they referred to as 2,6-di(α-methylbenzyl)phenol. We did not purchase standards of these compounds, so we did not confirm the full-scan HRMS identifications.
A literature search uncovered that 2,4-bis(1-phenylethyl)phenol has been reported to be identified in natural products,33,34 but we suspect that the use of nitrile gloves contaminated those samples leading to mistaken conclusions. Further investigation indicated that the leachates may have originated from the ITSP mini-cartridges in our study, but this could not be proven. Upon review of previous results, we did not find these contaminants in the recently commercialized septum-less μ-SPE mini-cartridges made from polypropylene.35 A clear NIST library match for tris(1-phenylethyl)phenol also resulted in the same profile as determined previously.32
In any case, the differences in the relative responses of the background chemical vs. bifenthrin in the 3 analyses shown in Fig. 4 are quite dramatic. The same solution was injected in HRMS one day after MS/MS, so degradation differences were highly unlikely in comparing their results. As described previously,26 increased selectivity of HRMS can only be achieved for ions with different elemental compositions. As shown in Fig. S2 and S3,‡ bis(1-phenylethyl)phenol has similar linked biphenyl groups to bifenthrin, leading to the calculated exact masses of m/z 181.1017 (C14H13), 182.1096 (C14H14), and 166.0782 (C13H10) for the ions generated by standard EI. Fig. S4‡ demonstrates that ions with measured m/z 165.0699, 153.0699, and 115.0542 also appear from different chemical origins, even though Fig. S3‡ shows how they merely have <10% relative abundances in the full-scan MS of bis(1-phenylethyl)phenol. Additionally, unlike how Cold EI shifts the relative abundances to higher masses, comparison of the orbitrap mass spectrum for bis(1-phenylethyl)phenol to the NIST spectrum indicates that the specific conditions used led to relative abundance for an m/z 302 of 32% in orbitrap vs. 55% in the NIST library. Conversely, the m/z 209 ion in the orbitrap analysis had 38% relative abundance compared to 21% in the NIST spectrum.
The very same issue occurs in SIM and MS/MS for common fragment ions as in HRMS using standard EI, but in MS/MS, structural differences in precursor ions can lead to different ion transitions and/or ratios depending on collision energies used. For example, the C14H13 fragment ions at m/z 181 for bifenthrin and bis(1-phenylethyl)phenol have the exact same mass to confound HRMS, but they have different structures, as indicated in Fig. 1, S2, and S3.‡
The HRMS spectrum of the chemical contaminant further shows that m/z 181 in unit-mass resolution SIM and MS/MS also contains C13H9O with m/z 181.0647. The precursors yield the same MS/MS product ion masses (losses of O, CH3, and C3H4), but the specific ions involved are different. For this reason, the optimum MRM collision energies chosen for MS/MS analysis of bifenthrin gave less intense product ions from the m/z 181 fragments of the interferants. Standard EI of the m/z 181 precursors in MS/MS would not be much different in relative intensities as observed in the case of HRMS in Fig. 4, but the much-reduced relative intensities of the product ions in MS/MS provided a greater degree of selectivity in this example.
Even so, it was fortunate that bifenthrin fell into a clear window between the background interferants in all 3 fast GC-MS techniques, and the analyte had similar estimated LOQs and LOIs <10 ng g−1 in all cases. The analyst must be aware and extra cautious of these interferants, though, which all occurred within the commonly used ±0.1 min tR window for regulatory analyte identification. Automatic software approaches would easily mis-integrate and mis-identify one or more of the interferants as bifenthrin in both MS/MS and HRMS, but not in Cold EI using the enhanced M+ ions.
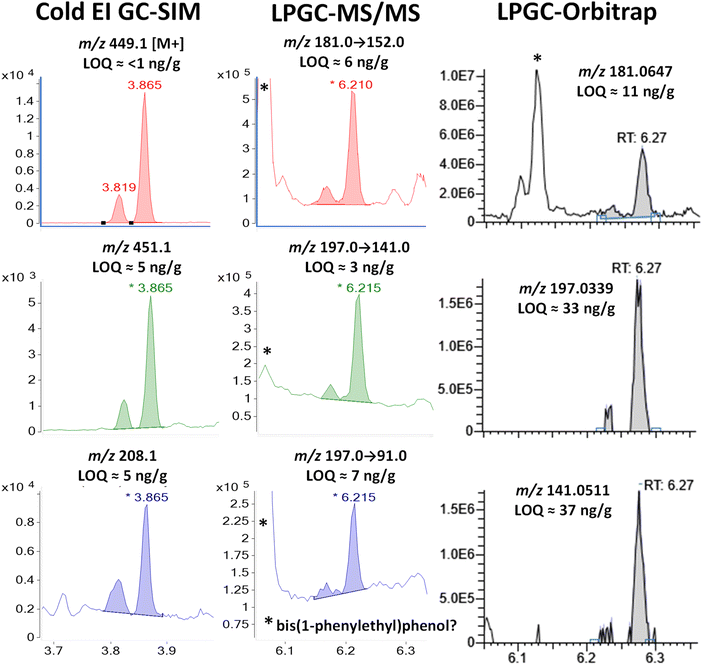 | ||
| Fig. 5 Comparison in the analysis of 100 ng g−1 (75 pg injected) λ-cyhalothrin in the barley extract using different fast GC-MS techniques. In MS/MS, the peak with tR = 6.06 min is the same chemical as shown in Fig. 2 and S2 (ESI‡), but the missing m/z 197 fragment ion in HRMS demonstrates that it has a different elemental composition than λ-cyhalothrin. | ||
A comparison of Cold EI and orbitrap HRMS spectra for λ-cyhalothrin is shown in Fig. S5 (ESI‡). The M+ (m/z 449) ion in Cold EI was enhanced to such an extent that it grew to a relative abundance of 100% from essentially 0% in standard EI. The use of this M+ and its M + 2 isotopologue in Cold EI-SIM was nearly completely free of chemical noise, as shown in Fig. 5. Furthermore, the use of the additionally enhanced higher mass m/z 208 fragment ion in Cold EI-SIM avoided the less selective m/z 197 ion as the third ion. This achieved about half the estimated LOQ of 5 ng g−1 than the weak M + 2 ion despite being only 1 m/z unit difference from the infamous m/z 207 column bleed.
In MS/MS, the m/z 181 and 197 precursor ions led to higher baselines for associated product ions, including very intense peaks at 6.06 min, presumably due to 2,4-bis(1-phenylethyl)phenol. The optimized MRM ion transitions and collision energies chosen for λ-cyhalothrin were not nearly as selective to avoid the chemical noise as those chosen for bifenthrin, but the LOI was still <10 ng g−1 for regulatory applications. However, the orbitrap could not quite meet that need with a calculated LOI of 33 ng g−1. Interestingly, the standard EI base peak C13H9O fragment with m/z 181.0647 for λ-cyhalothrin was also present in the interferant but not the m/z 197.0339 ion, as shown in Fig. 5 and S3.‡
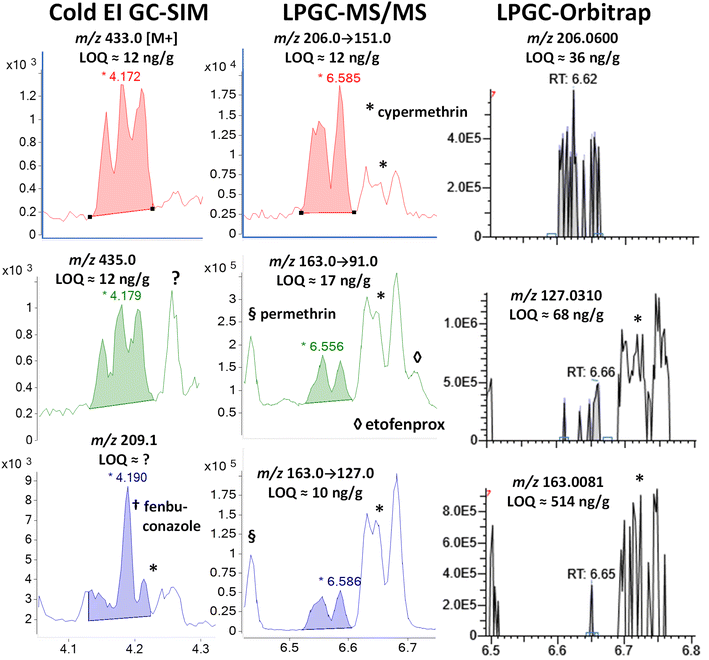 | ||
| Fig. 6 Comparison in the analysis of 100 ng g−1 (75 pg injected) cyfluthrin in the barley extract using different fast GC-MS techniques. | ||
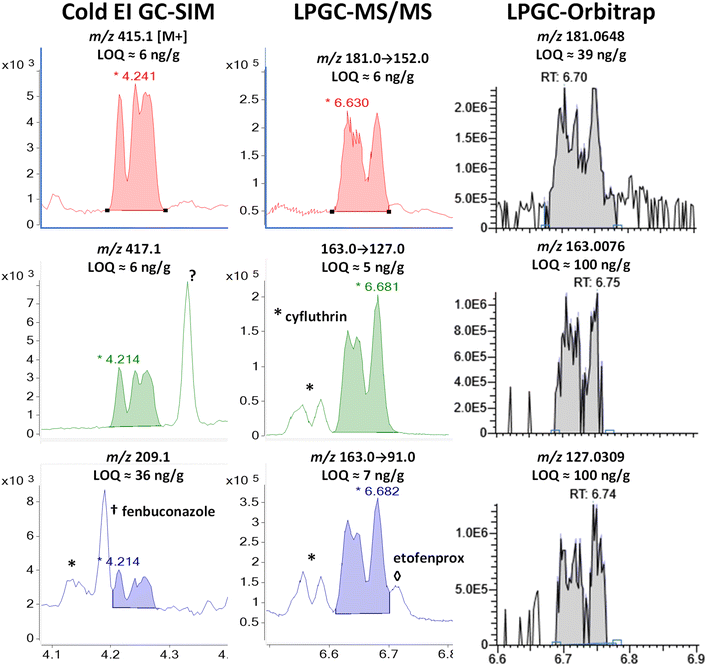 | ||
| Fig. 7 Comparison in the analysis of 100 ng g−1 (75 pg injected) cypermethrin in the barley extract using different fast GC-MS techniques. | ||
In MS/MS, cypermethrin was clearly present in all 3 ion transitions chosen for cyfluthrin, but the two groups of diastereomers were fully separated by LPGC. The chromatographic peak profiles and relative intensities of both groups changed depending on the collisional deactivation energy differences for the 8 diastereomers under the conditions used in the MRM ion transitions. Taking both Fig. 6 and 7 into account, two ion transitions are duplicated for both cyfluthrin and cypermethrin, totaling 3 transitions useful for cyfluthrin and 4 for cypermethrin (including m/z 181 → 152). Thus, somewhat more confident identification can be made for cypermethrin in MS/MS, but this is also true for other analytes with overlapping ions, such as etofenprox at 6.71 min with m/z 163 → 91.
In the case of the nontargeted LPGC-orbitrap approach using full-spectral acquisition, many other ions could be chosen in theory, but in practice, only a few of the most intense and selective ions prove useful for any analyte near the LOQ. For that reason (and the mix of 4 diastereomers), the orbitrap was not able to reliable detect cyfluthrin at 100 ng g−1 except for its unique m/z 206.0600 ion. Even its base peak ion of m/z 163.008 shared with cypermethrin did not yield an appreciably high S/N at 100 ng g−1. The ions for cypermethrin were detected at that concentration, but the LOQs were not necessarily better due to worse electronic noise.
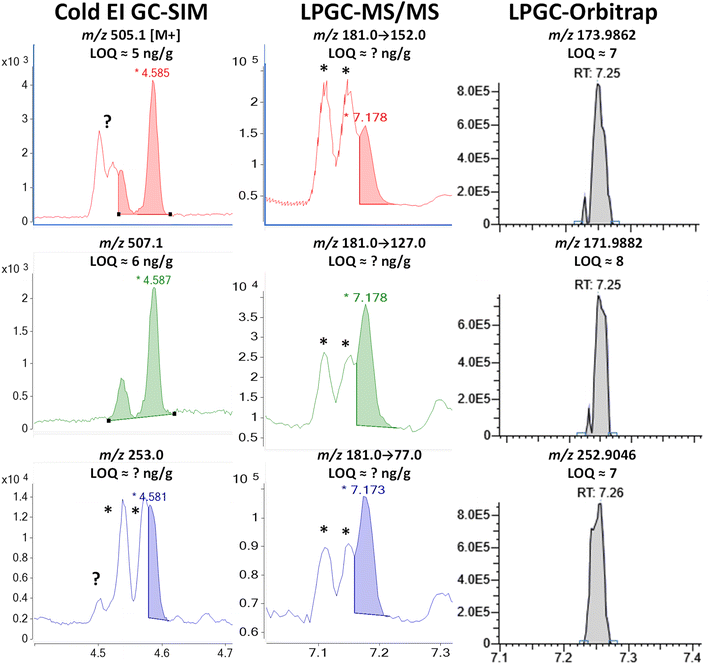 | ||
| Fig. 8 Comparison in the analysis of 100 ng g−1 (75 pg injected) deltamethrin in the barley extract using different fast GC-MS techniques. * tris(1-phenylethyl)phenol. | ||
As shown in Fig. S6,‡ a search of the NIST library of this interferant in full-spectral HRMS data acquisition identified it to be 2,4,6-tris(1-phenylethyl)phenol with 98% probability. The measured −2.2 ppm mass difference in HRMS of the M+ ion from the calculated exact mass for C30H30O provides further evidence in the identification. Phenylethylphenols have been used as a manufacturing agent in plastics and other applications for at least 75 years.36 The two GC peaks could correspond to different structural isomers or stereoisomers with the exact same mass spectra.
Although the m/z 253 base peak ion was used for deltamethrin in both Cold EI-SIM and orbitrap quantification, HRMS at m/z 252.9046 eliminated the m/z 253.1015 interferant that essentially ruined the use of that ion in Cold EI. As shown in Table S1,‡ the large mass defect of two Br atoms in that fragment greatly aided in resolving deltamethrin from the interferant (which is a benefit in HRMS of fragments containing Cl, too). Due to the compositional and structural differences, the m/z 253 ion as a precursor in MS/MS probably would have also provided unique ion transitions to cleanly distinguish deltamethrin, but unfortunately, we made a mistake in this study to only use the less selective m/z 181 base peak as the precursor. That ion originated from C13H9O, and thus the greater selectivity in MS/MS provided by the C13H14 fragment for bifenthrin in Fig. 4 was not achieved for deltamethrin, as also observed for λ-cyhalothrin ion transitions shown in Fig. 5. Just as HRMS cannot distinguish ion peaks with the same elemental formula from each other, nothing can be done in MS/MS if the precursor fragment ions also have the same molecular structures.
Acquisition of M+ isotopologues as done in Cold EI is one way to avoid this problem in both MS/MS and HRMS. As shown in Fig. 8, the M + 4 ion for deltamethrin was free of chemical noise, but despite the high mass, an unknown matrix component still interfered with the first deltamethrin peak in the m/z 505 M + 2 ion chromatogram. Previous experiments also encountered chemical noise with the m/z 503 M+ ion in Cold EI. A hint of this interferant also appears in the Cold EI m/z 253 ion for deltamethrin. Due to the enhancement of higher mass ions in Cold EI, full scan searches in LPGC-HRMS using standard EI were not able to find these components. Although Cold EI provides greater overall selectivity by shifting mass spectra of analytes to higher masses, it also increases the intensity of chemical noise from higher mass ions.
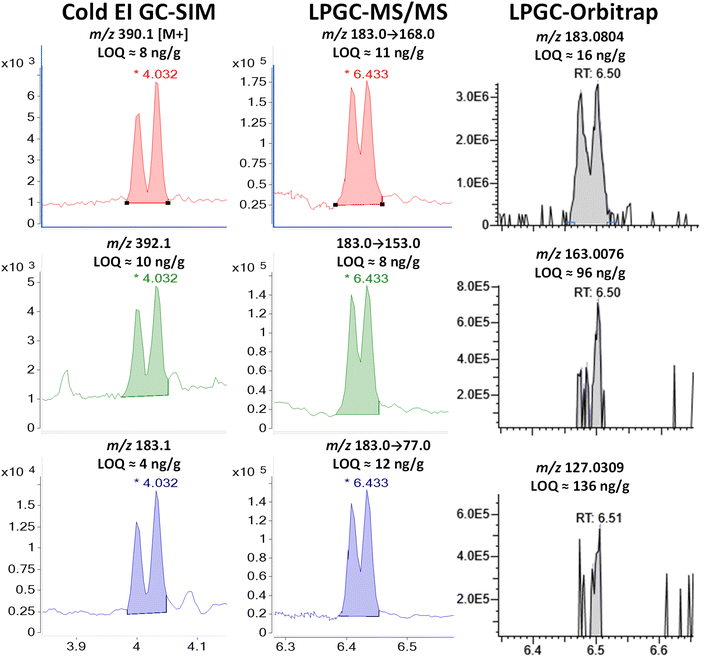 | ||
| Fig. 9 Comparison in the analysis of combined 100 ng g−1 (75 pg injected) of cis- and trans-permethrins in the barley extract using different fast GC-MS techniques. | ||
Although some of the permethrin in the barley extract may have degraded or volatilized, Fig. 9 and S7‡ show how the enhanced M+ provided by Cold EI makes a significant improvement in its detection compared to standard EI-(HR)MS. As shown, permethrin in standard EI simply does not fragment into enough ions for confident identifications at low concentrations, but use of the enhanced M+ and M + 2 in Cold EI-SIM matched or bettered the LOQs using the m/z 183 base peak as the precursor ion in MS/MS. In full-spectral LPGC-orbitrap, the second and third most intense ions (m/z 163.008 and 127.031) were simply too weak to provide an LOI <96 ng g−1. This problem was avoided in MS/MS by employing the same precursor for all 3 transitions. Even then, the LOQs for all 3 ions in all 3 techniques (when summing both isomers as a single analyte) exceeded the desired 10 ng g−1 performance goal for permethrin.
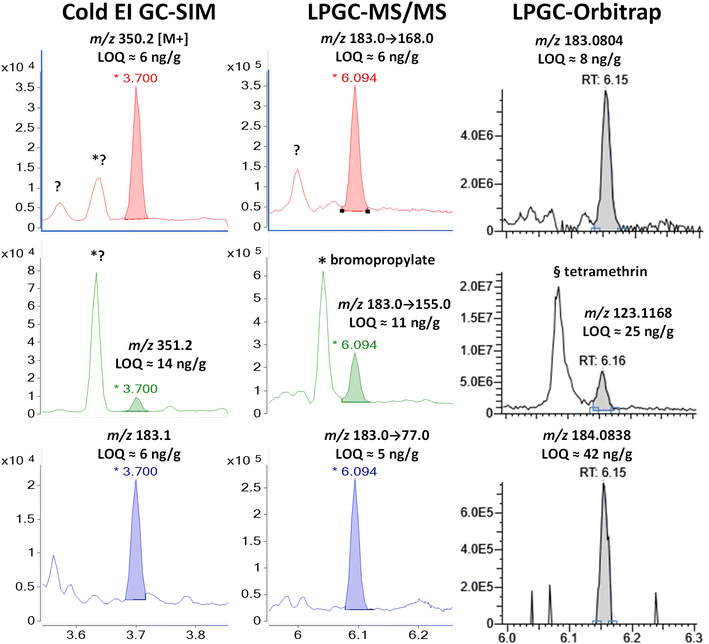 | ||
| Fig. 10 Comparison in the analysis of 100 ng g−1 (75 pg injected) phenothrin in the barley extract using different fast GC-MS techniques. | ||
Again, MS/MS was able to employ the base peak of m/z 183 as the precursor for all 3 ion transitions, and that base peak was also monitored in Cold EI. More importantly, Cold EI held the advantage to also detect the enhanced M+ and M + 1 isotopologues of phenothrin. Other unknown chromatographic peaks for m/z 350 and 351 appeared at 3.62 min, but they did not interfere with the analysis of phenothrin at 3.70 min. This allowed clean measurement of the M + 1/M+ peak area ion ratio, which was 25.7%. For chemicals consisting of C, H, N, and O, this exactly matched the theoretical formula of C22H30N4, but this was also close to the theoretical ion ratio of 25.4% for phenothrin's molecular formula of C23H26O3. In any case, the experimental isotope abundance ratio provides more important qualitative information than other MS ion ratios.11
The 13C isotopologue was also useful in HRMS for the fragment ion m/z 184.0838, but its integrated ion ratio vs. m/z 183.0804 was 10.9%, which most closely corresponded to C10HNO3 (a graphite-nitric acid intercalation compound) with an isotope abundance ion ratio of 11.3%. This is far removed from the expected ion ratio of 14.3% for phenothrin's actual fragment ion of C13H11O (see Fig. 1 and Table S1‡). Although this molecular formula is the highest probability based on the HRMS ion, this choice was not confirmed by the M + 1 isotope abundance ion ratio. This may be due to the lack of sensitivity or a function of the vendor's data collection and integration software – not an inherent feature in orbitrap analysis.
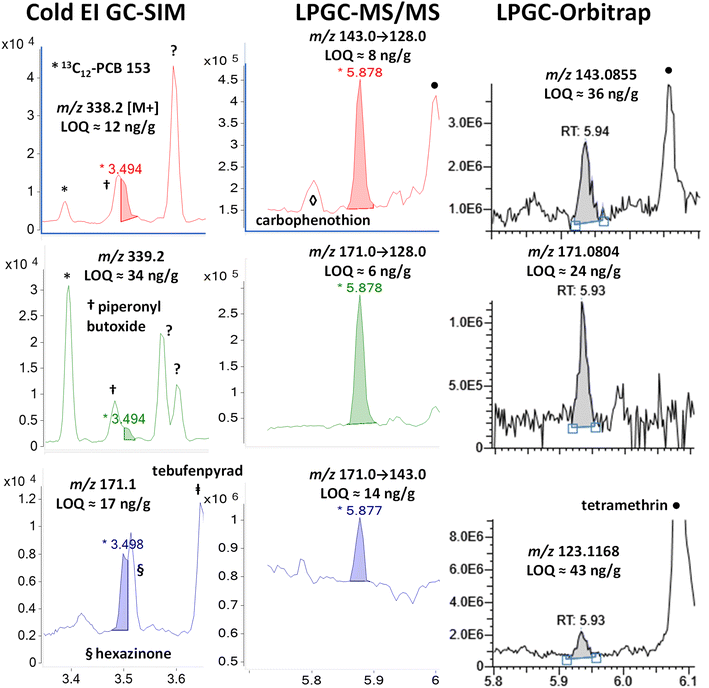
In the case of LPGC, the MS/MS and HRMS ions chosen for quantidentification were free of the piperonyl butoxide and hexazinone interferences, even though they also essentially co-eluted. A trace signal for carbophenothion can be observed at 5.8 min in the m/z 143 → 128 MS/MS transition, and tetramethrin yielded large peaks at 6 min for the same transition as well as the m/z 143.0855 and 123.1168 fragment ions in the orbitrap analysis. Neither interfered in the chromatographic integration of resmethrin, but the generally higher chemical noise in the background for all useful ions in all 3 techniques led to slightly higher than typical LOQs for resmethrin among the pyrethroids. Interestingly, it produces some unique Cold EI and (HR)MS(/MS) ions compared to other pyrethroids, but they are less unique among other analytes and matrix backgrounds.
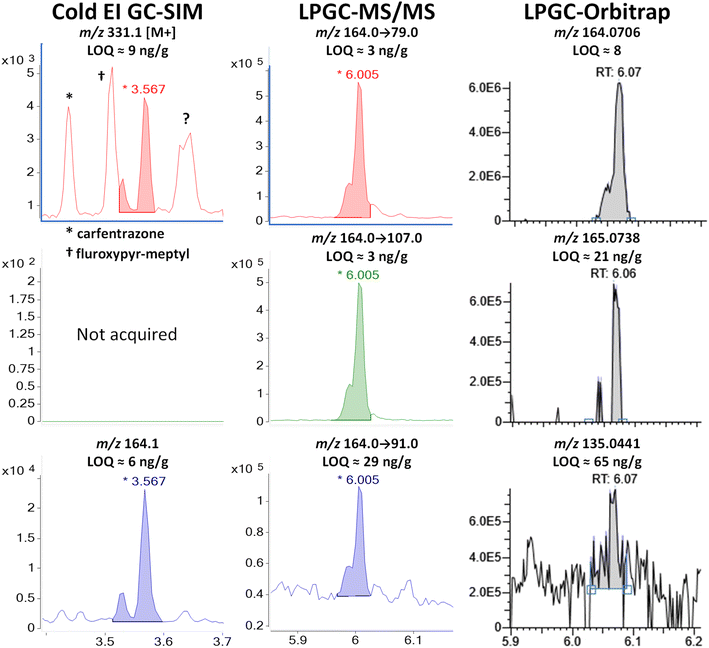 | ||
| Fig. 12 Comparison of the analysis of 100 ng g−1 (75 ng injected) tetramethrin in the barley extract using different fast GC-MS techniques. | ||
Tetramethrin is a type I pyrethroid (without the α-cyano group), and thus it does not undergo conversion in the inlet as in the cases of λ-cyhalothrin and deltamethrin. Unlike type II pyrethroids, tetramethrin has only two chiral centers on the cyclopropyl ring, and non-chiral separations give rise to two peaks (two co-eluting enantiomers for each cis/trans diastereomer). Fig. 12 shows in Cold EI that the first peak at 3.52 min (cis-) averaged 25% of the main tetramethrin peak with tR = 3.57 min (trans-), in agreement with the reported cis/trans ratio of 1/4 for this pyrethroid.38 Although with poorer separation, the same ratio also occurred in the LPGC analyses, indicating that injection conditions did not make a difference in this case.
The fast GC conditions in Cold EI were able to fully resolve the two pairs of enantiomers for the base peak of m/z 164, but chemical noise affected the separation of the M+ at m/z 331. While the trans-enantiomers were resolved giving rise to the 6 ng g−1 LOQ, the cis-pair partially coeluted with a fragment ion of fluroxypyr-meptyl at 3.55 min. The selectivity of m/z 331 for tetramethrin was also affected by the fragmentation of the nearby carfentrazone peak at 3.43 min and by one or two other chemical interferences at 3.65 min that we couldn't identify. Fig. 12 shows that the selectivity of m/z 164 observed in Cold EI also occurred in LPGC analyses by MS/MS and HRMS, to the extent that the 3 MRM transitions chosen for the analysis of tetramethrin in MS/MS originated from this same moiety (m/z 164 → 79, 164 → 107 and 164 → 91). In HRMS, m/z 164.0706 was among the few fragments produced by tetramethrin that was free of interferences, which led to one of the rare instances in which the orbitrap analyzer achieved an LOQ <10 ng g−1 in barley. Again, the ion including a 13C isotope at m/z 165.0738 was found to be better than other ion choices for identification. The second-most abundant ion (40%) in the standard EI MS spectrum of tetramethrin was m/z 123.1168, but it was strongly affected by background interferences and was not able to be used.
3.2 Comparison of LPGC-MS/MS with orbitrap HRMS
Unfortunately, the remaining 6 pyrethroids in the mixture added to the barley extract were not targeted in the Cold EI-SIM method. Fig. S8–S14 (ESI‡) compare the ion LPGC-MS/MS and orbitrap chromatograms for allethrin, prallethrin (actually triadimenol), cyphenothrin, es/fenvalerate, fenpropathrin, fluvalinate, and etofenprox, respectively, in the same way as in Fig. 4–12 for all 3 techniques. The ESI‡ figure captions explain the salient aspects within the analyses, but we make several points of special emphasis below.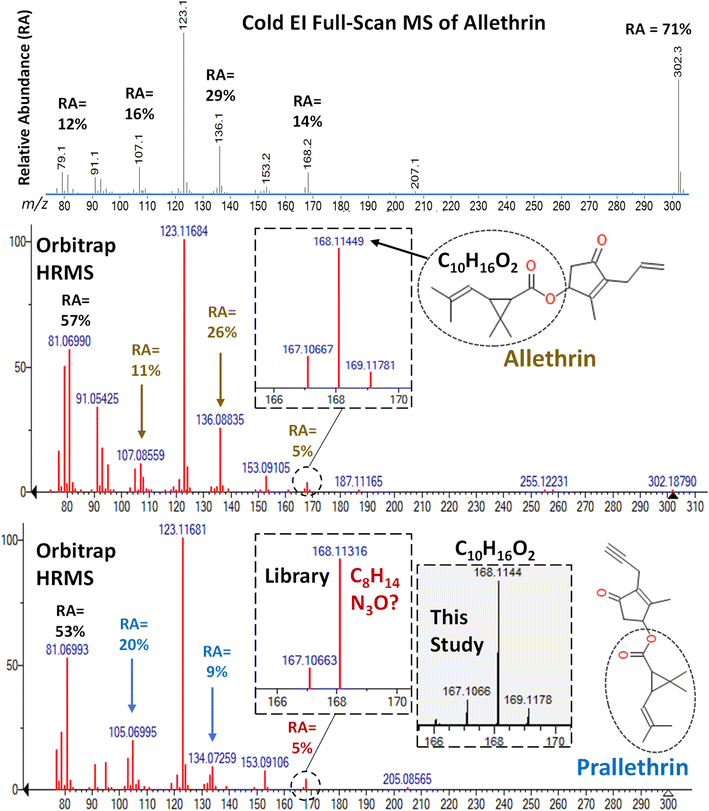 | ||
| Fig. 13 Comparison of the full-scan MS spectra of allethrin in Cold EI and the orbitrap HRMS library. The HRMS library spectrum for prallethrin, however, exhibited a −8 ppm difference in the m/z 168 ion that exactly corresponded to an intense ion of triadimenol, which co-eluted with prallethrin as shown in Fig. S8.‡ A reference standard of prallethrin in this study yielded the correct HRMS m/z 168.1144 fragment ion. | ||
In HRMS, the m/z 123.1168 (base peak) and m/z 105.0699 qualitative ions in LPGC-orbitrap were similarly unselective as in MS/MS. The interferences deformed the peak profile for prallethrin, demonstrating the importance of human involvement in common sense decision-making to double check identifications made automatically using inflexible criteria. For example, the peak areas of the qualifier ions would meet the identification criteria at some combination of analyte/interferant concentrations. This further emphasizes the importance that positive samples in one analysis should be re-analyzed using orthogonally selective methods to confirm the actual presence of the analytes.26
In another example demonstrating the need for expertise in analyses, we originally thought that the unique m/z 168.1131 ion in prallethrin's orbitrap library spectrum (see Fig. 13) was useful to isolate it for analysis. However, Fig. S9‡ demonstrates how that exact mass ion happens to correspond to an intense triadimenol ion at the same tR as prallethrin's in the LPGC chromatogram. This confused us until we compared our measured orbitrap HRMS spectrum of a prallethrin reference standard with the library spectrum. After studying the fragmentation pathway, the 8 ppm exact mass difference in the m/z 168 ion in the HRMS library spectra for allethrin vs. prallethrin made no sense, and we corrected the discrepancy in Table S1.‡ Indeed, other similar discrepancies were found in the HRMS library spectra when building Table S1,‡ and we believe most of them were corrected in the table. However, the commercial library spectra still contain the errors, and we caution others not to fully trust the accuracy of every ion in the spectra.
4 Conclusions
Pyrethroids are challenging pesticides to analyze in multiclass, multiresidue methods at regulatory levels in food and environmental matrices. In this study, fast-GC Cold EI-SIM was compared with LPGC-MS/MS and LPGC-orbitrap HRMS analysis of 9 pyrethroids added at 100 ng g−1 (75 pg injected analyte amounts) in final extracts of barley prepared using the QuEChERSER mega-method. An additional 6 pyrethroids were compared in the same way for the shared final extracts by using just the latter two analyzers. The results demonstrated that the targeted methods (Cold EI-SIM and MS/MS) achieved similar analyte detectabilities, yielding LOQs and LOIs often <10 ng g−1, and sometimes <1 ng g−1, depending on the specific pyrethroids, ions chosen, and background interferences. The nontargeted orbitrap instrument generally yielded 3-fold higher LOQs, but due to the nature of standard EI fragmentation of pyrethroids, the low relative abundances of the second ion often led to even higher relative LOIs vs. the targeted methods. In MS/MS, the same high intensity fragment ion could be used multiple times as a precursor to provide quantidentification at ultratrace levels in the complex matrix. In Cold EI, the base ion peak plus the enhanced M+ and its isotopologues could be used to generate enough ions for reliably sensitive and selective detections.With respect to chemical noise, only a single barley matrix component was found to interfere for one ion used to quantidentify one pyrethroid in the study (m/z 123 for cyphenothrin, which could have arisen from a mistake in MS/MS). Despite the high degree of selectivity that each type of MS analyzer provided, several reagent background and analyte-to-analyte interferences were encountered in all 3 techniques. The fast-GC methods were devised for high sample throughput, not fully resolved separations, and many of the interfering peaks came from other pesticides and environmental contaminants among the 322 analytes added to the final extracts. Due to the rarity of multiple interfering residues occurring in the same samples in practice (see Fig. 3 and S1‡), analyte-to-analyte interferences were discounted. The same problem occurs in traditional GC separations of so many analytes, too. The analyst can easily notice the presence of multiple analytes in those rare instances and re-analyze the sample using an alternate method if needed.
Unfortunately, interferants from nitrile gloves ruined the ability of MS/MS to quantidentify deltamethrin in the study, but again, the problem arose due to a mistake in the choice of ion transition used for that analyte. The interferants also affected ions used for fenpropathrin, bifenthrin, and λ-cyhalothrin, but those analytes could still be quantidentified in the study by using other options.
Data availability
The authors confirm that the data supporting the conclusions of this study are presented in the manuscript (and/or its ESI‡). Requests to access additional data should be directed to the corresponding author.Conflicts of interest
The authors report no conflicts of interest.Acknowledgements
This research was supported by Research Grant Award No. IS-5451-21 from BARD, The United States – Israel Binational Agricultural Research and Development Fund. The USDA authors also thank ThermoFisher Scientific for the loan of the GC-Q-Exactive orbital ion trap system as part of Materials Transfer Research Agreement No. 58-8072-9-020. We thank Robyn Moten and Messiah Davis for contributions to Table S1‡ and Ryan Stoklosa for providing the barley samples used in the experiments.References
- M. Kochman, A. Gordin, P. Goldshlag, S. J. Lehotay and A. Amirav, Fast, high-sensitivity, multipesticide analysis of complex mixtures with supersonic gas chromatography–mass spectrometry, J. Chromatogr. A, 2002, 974, 185–212 CrossRef CAS PubMed.
- A. Amirav and A. Danon, Electron impact mass spectrometry in supersonic molecular beams, Int. J. Mass Spectrom. Ion Processes, 1990, 97, 107–113 CrossRef CAS.
- A. Amirav, Electron impact mass spectrometry of cholesterol in supersonic molecular beams, J. Phys. Chem., 1990, 94, 5200–5202 CrossRef CAS.
- A. Amirav, A. Gordin, M. Poliak and A. B. Fialkov, Gas chromatography-mass spectrometry with supersonic molecular beams, J. Mass Spectrom., 2008, 43, 141–163 CrossRef CAS PubMed.
- A. Amirav, A. B. Fialkov, K. J. Margolin Eren, B. Neumark, O. Elkabets, S. Tsizin, A. Gordin and T. Alon, Gas chromatography–mass spectrometry (GC–MS) with Cold electron ionization (EI): Bridging the gap between GC–MS and LC–MS, Curr. Trends Mass Spectrom., 2020, 18, 5–15 CAS.
- A. Amirav, Gas Chromatography – Mass Spectrometry with Cold EI: Leading the Way to the Future of GC-MS, Scientific Research Publishing Inc., USA, 2021, ISBN: 978-1-64997-142-5 Search PubMed.
- A. Amirav, A. B. Fialkov and A. Gordin, Improved electron ionization ion source for the detection of supersonic molecular beams, Rev. Sci. Instrum., 2002, 73, 2872–2876 CrossRef CAS.
- A. B. Fialkov, A. Gordin and A. Amirav, Extending the range of compounds amenable for gas chromatography–mass spectrometric analysis, J. Chromatogr. A, 2003, 991, 217–240 CrossRef CAS PubMed.
- A. B. Fialkov, U. Steiner, S. J. Lehotay and A. Amirav, Sensitivity and noise in GC-MS: Achieving low limits of detection for difficult analytes, Int. J. Mass Spectrom., 2007, 260, 31–48 CrossRef CAS.
- A. B. Fialkov, A. Gordin and A. Amirav, Hydrocarbons and fuels analyses with the supersonic gas chromatography mass spectrometry – the novel concept of isomer abundance analysis, J. Chromatogr. A, 2008, 1195, 127–135 CrossRef CAS PubMed.
- T. Alon and A. Amirav, A comparison of isotope abundance analysis and accurate mass analysis in their ability to provide elemental formula information, J. Am. Soc. Mass Spectrom., 2021, 32, 929–935 CrossRef CAS PubMed.
- T. Alon and A. Amirav, How enhanced molecular ions in Cold EI improve compound identification by the NIST library, Rapid Commun. Mass Spectrom., 2015, 29, 2287–2292 CrossRef CAS PubMed.
- A. Amirav, Fast heroin and cocaine analysis by GC–MS with cold EI: the important role of flow programming, Chromatographia, 2017, 80, 295–300 CrossRef CAS.
- K. J. Margolin Eren, O. Elkabets and A. Amirav, A comparison of electron ionization mass spectra obtained at 70 eV, low electron energies, and with Cold EI and their NIST library identification probabilities, J. Mass Spectrom., 2020, 55, e4646 CrossRef CAS PubMed.
- A. Amirav, A. B. Fialkov, A. Gordin, O. Elkabets and K. J. Margolin Eren, Cold electron ionization (EI) is not a supplementary ion source to standard EI. It is a highly superior replacement ion source, J. Am. Soc. Mass Spectrom., 2021, 32, 2631–2635 CrossRef CAS PubMed.
- A. Amirav and A. Yakovchuk, Sensitivity comparison of gas chromatography–mass spectrometry with Cold EI and standard EI, J. Mass Spectrom., 2023, 58, e4950 CrossRef CAS PubMed.
- USDA Agricultural Marketing Service, Pesticide Data Program, 2024, http://www.ams.usda.gov/datasets/pdp, accessed July 3.
- C. Corcellas, E. Eljarrat and D. Barceló, Determination of pyrethroid insecticides in environmental samples by GC–MS and GC–MS–MS, Compr. Anal. Chem., 2013, 61, 203–230 CAS.
- M. Murcia-Morales, V. Cutillas and A. R. Fernández-Alba, Supercritical fluid chromatography and gas chromatography coupled to tandem mass spectrometry for the analysis of pyrethroids in vegetable matrices: A comparative study, J. Agric. Food Chem., 2019, 67, 12626–12632 CrossRef CAS PubMed.
- M. L. Feo, E. Eljarrat and D. Barceló, Performance of gas chromatography/tandem mass spectrometry in the analysis of pyrethroid insecticides in environmental and food samples, Rapid Commun. Mass Spectrom., 2011, 25, 869–876 CrossRef CAS PubMed.
- K. Maštovská and S. J. Lehotay, Evaluation of common organic solvents for gas chromatographic analysis and stability of multiclass pesticide residues, J. Chromatogr. A, 2004, 1040, 259–272 CrossRef PubMed.
- C. Y. Shen, X. W. Cao, W. J. Shen, Y. Jiang, Z. Y. Zhao, B. Wu, K. Y. Yu, H. Liu and H. Z. Lian, Determination of 17 pyrethroid residues in troublesome matrices by gas chromatography/mass spectrometry with negative chemical ionization, Talanta, 2011, 84, 141–147 CrossRef CAS PubMed.
- A. Valverde, A. Aguilera, M. Rodriguez and M. Boulaid, What are we determining using gas chromatographic multiresidue methods: Tralomethrin or deltamethrin?, J. Chromatogr. A, 2001, 943, 101–111 CrossRef PubMed.
- H. Yuan, B. Li, J. Wei, X. Liu and Z. He, Ultra-high performance liquid chromatography and gas chromatography coupled to tandem mass spectrometry for the analysis of 32 pyrethroid pesticides in fruits and vegetables: A comparative study, Food Chem., 2023, 412, 135578 CrossRef CAS PubMed.
- J. Wan, P. He, Y. Chen and Q. Zhu, Comprehensive target analysis for 19 pyrethroids in tea and orange samples based on LC-ESI-QqQ-MS/MS and LC-ESI-Q-ToF/MS, LWT–Food Sci. Technol., 2021, 151, 112072 CrossRef CAS.
- S. J. Lehotay, K. Maštovská, A. Amirav, A. B. Fialkov, P. A. Martos, A. de Kok and A. R. Fernández-Alba, Identification and confirmation of chemical residues in food by chromatography-mass spectrometry and other techniques, Trends Anal. Chem., 2008, 27, 1070–1090 CrossRef CAS.
- S. J. Lehotay, The QuEChERSER mega-method, LCGC North Am., 2022, 40, 13–19 Search PubMed.
- N. Michlig, S. J. Lehotay, A. R. Lightfield, H. R. Beldomenico and M. R. Repetti, Validation of a high-throughput method for analysis of pesticide residues in hemp and hemp products, J. Chromatogr. A, 2021, 1645, 462097 CrossRef CAS PubMed.
- S. H. Monteiro, S. J. Lehotay, Y. Sapozhnikova, E. Ninga, G. C. R. Moura Andrade and A. R. Lightfield, Validation of the QuEChERSER mega-method for the analysis of pesticides, veterinary drugs, and environmental contaminants in tilapia (Oreochromis niloticus), Food Addit. Contam.: Part A, 2022, 39, 699–709 CrossRef CAS PubMed.
- K. J. Dorweiler, J. N. Gurav, J. S. Walbridge, V. S. Ghatge and R. H. Savant, Determination of stability from multicomponent pesticide mixes, J. Agric. Food Chem., 2016, 64, 6108–6124 CrossRef CAS PubMed.
- J. Fillion, R. Hindle, M. Lacroix and J. Selwyn, Multiresidue determination of pesticides in fruit and vegetables by gas chromatography–mass-selective detection and liquid chromatography with fluorescence detection, J. AOAC Int., 1995, 78, 1252–1266 CrossRef CAS.
- M. Mutsuga, Y. Kawamura, C. Wakui and T. Maitani, Identification of migrants from nitrile-butadiene rubber gloves, J. Food Hyg. Soc. Jpn., 2003, 44, 103–109 CrossRef CAS PubMed.
- R. Padmini, V. U. Maheshwari, P. Saravanan, K. W. Lee, M. Razia, M. S. Alwahibi, B. Ravindran, M. S. Elshikh, Y. O. Kim and H. J. Kim, Identification of novel bioactive molecules from garlic bulbs: A special effort to determine the anticancer potential against lung cancer with targeted drugs, Saudi J. Biol. Sci., 2020, 27, 3274–3289 CrossRef CAS PubMed.
- K. d. C. Cruz-Salomón, R. I. Cruz-Rodríguez, J. V. Espinoza-Juárez, A. Cruz-Salomón, A. Briones-Aranda, N. Ruiz-Lau and V. M. Ruíz-Valdiviezo, In vivo and in silico study of the antinociceptive and toxicological effect of the extracts of Petiveria alliacea L. leaves, Pharmaceuticals, 2022, 15, 943 CrossRef PubMed.
- N. Michlig and S. J. Lehotay, Evaluation of a septumless mini-cartridge for automated solid-phase extraction cleanup in gas chromatographic analysis of >250 pesticides and environmental contaminants in fatty and nonfatty foods, J. Chromatogr. A, 2022, 1685, 463596 CrossRef CAS PubMed.
- K. C. Frisch, Derivatives of o-and p-(α-phenylethyl) phenol, J. Org. Chem., 1950, 15, 587–592 CrossRef CAS.
- D. Wells, B. T. Grayson and E. Langner, Vapour pressure of permethrin, Pestic. Sci., 1986, 17, 473–476 CrossRef CAS.
- National Center for Biotechnology Information, PubChem Compound Summary for CID 83975, Tetramethrin, 2024, https://pubchem.ncbi.nlm.nih.gov/compound/Tetramethrin, accessed May 2.
- I. A. Fleet and J. J. Monaghan, Comparison of electrospray mass spectrometry of chrysanthemic acid ester pyrethroid insecticides with electron ionization and positive-ion ammonia chemical ionization methods, Rapid Commun. Mass Spectrom., 1997, 11, 796–802 CrossRef CAS.
- Y. Sapozhnikova, High-throughput analytical method for 265 pesticides and environmental contaminants in meats and poultry by fast low pressure gas chromatography and ultrahigh-performance liquid chromatography tandem mass spectrometry, J. Chromatogr. A, 2018, 1572, 203–211 CrossRef CAS PubMed.
Footnotes |
| † The use of trade, firm, or corporation names does not constitute an official endorsement or approval by the USDA of any product or service to the exclusion of others that may be suitable. |
| ‡ Electronic supplementary information (ESI) available. See DOI: https://doi.org/10.1039/d4ay00858h |
| This journal is © The Royal Society of Chemistry 2024 |

