
 Open Access Article
 This Open Access Article is licensed under a Creative Commons Attribution-Non Commercial 3.0 Unported Licence
Adrenodoxin allosterically alters human cytochrome P450 11B enzymes to accelerate substrate binding and decelerate release†
Cara L.
Loomis
 a,
Sang-Choul
Im
bc and
Emily E.
Scott
*ade
a,
Sang-Choul
Im
bc and
Emily E.
Scott
*ade
aDepartment of Biological Chemistry, University of Michigan, Ann Arbor, MI 48109, USA. E-mail: scottee@umich.edu
bDivision of Metabolism, Endocrinology, & Diabetes, Department of Internal Medicine, University of Michigan, Ann Arbor, MI, USA
cAnn Arbor Veterans Affairs Medical Center, Ann Arbor, MI, USA
dDepartment of Medicinal Chemistry, University of Michigan, Ann Arbor, MI 48109, USA
eDepartment of Pharmacology, University of Michigan, Ann Arbor, MI 48109, USA
First published on 2nd August 2024
Abstract
Two human mitochondrial membrane CYP11B enzymes play a pivotal role in steroidogenesis. CYP11B1 generates the major glucocorticoid cortisol, while CYP11B2 catalysis yields the primary mineralocorticoid aldosterone. Catalysis by both requires electron delivery by a soluble iron–sulfur adrenodoxin redox partner. However recent studies have shown that adrenodoxin/CYP11B interaction alone allosterically increases substrate and inhibitor affinity as exhibited by decreased dissociation constant (Kd) values. The current study moves beyond such equilibrium studies, by defining adrenodoxin effects on the rates of P450 ligand binding and release separately. Stopped-flow data clearly demonstrate that adrenodoxin interaction with the P450 proximal surfaces increases ligand binding in both P450 CYP11B active sites by increasing the on rate constant and decreasing the off rate constant. As substrate entry and exit from the sequestered P450 active site requires conformational changes on the distal side of the P450 enzyme, a likely explanation is that adrenodoxin binding allosterically modulates CYP11B conformational changes. The 93% identical CYP11B enzymes can bind and hydroxylate each other's native substrates differing only by a hydroxyl. However, CYP11B1 exhibits monophasic substrate binding and CYP11B2 biphasic substrate binding, even when the substrates are swapped. This indicates that small differences in amino acid sequence between human CYP11B1 and CYP11B2 enzymes are more functionally important in ligand binding and could suggest avenues for more selective inhibition of these drug targets. Both protein/protein interactions and protein/substrate interactions are most likely to act by modulating CYP11B conformational dynamics.
Introduction
Six cytochrome P450 (CYP) enzymes generate a constellation of human corticosteroids and sex hormones controlling diverse physiological functions. Two such steroidogenic P450 enzymes in the 11B subfamily act on cholesterol-derived products to generate corticosteroids. CYP11B1 performs 11β-hydroxylation on 11-deoxycortisol to produce the primary glucocorticoid cortisol (Fig. 1A), which regulates stress and immune responses.1 CYP11B2 or aldosterone synthase performs three reactions: an initial similar 11β-hydroxylation on 11-deoxycorticosterone to produce corticosterone, followed by subsequent 18-hydroxylation and 18-oxidase steps to ultimately yield the mineralocorticoid aldosterone (Fig. 1B) controlling salt/water homeostasis.2 As a result, CYP11B proteins are of high interest from a clinical standpoint. Excess cortisol leads to cushing syndrome, which is characterized by metabolic dysregulation and immune suppression,3 whereas excess aldosterone causes primary aldosteronism, leading to hypertension.2 Thus both CYP11B enzymes are significant drug targets for these diseases, but drug development has been hindered by low selectivity of active-site-directed inhibitors. Recent FDA approval of Isturisa®/osilodrostat/LCI699 for cushing syndrome treatment is a major clinical advance, yet this compound is poorly selective for CYP11B1 over CYP11B2.4–6 From a clinical perspective, identifying differences between the two enzymes is advantageous for drug development.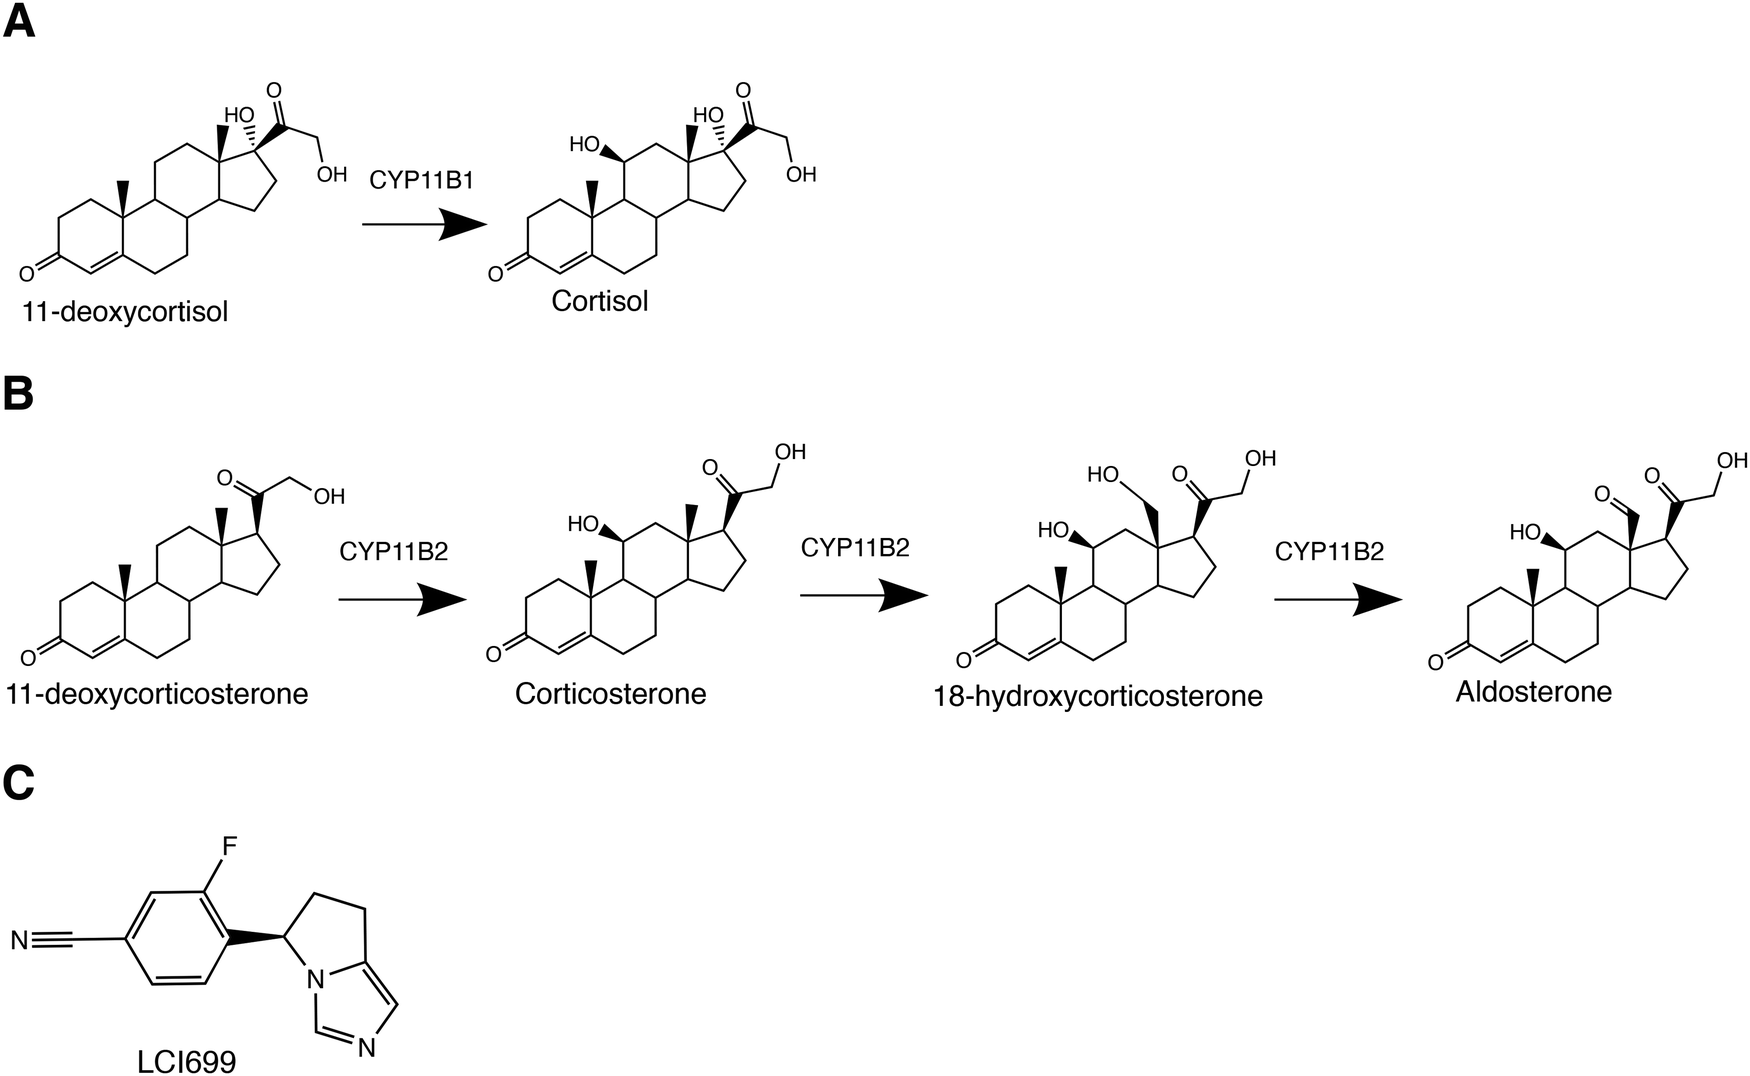 | ||
| Fig. 1 Cytochrome P450 11B enzyme ligands. (A) The CYP11B1-mediated 11β-hydroxylation of 11-deoxycortisol results in the major glucocorticoid hormone cortisol. (B) Human CYP11B2 generates the major mineralocorticoid hormone aldosterone. Similar to CYP11B1, CYP11B2 performs an 11β hydroxylation to convert 11-deoxycorticosterone to corticosterone, but subsequently performs an 18-hydroxylation and 18-oxidase reaction to generate aldosterone. (C) LCI699 is an FDA-approved cushing syndrome drug displaying low nanomolar affinity for both CYP11B1 and CYP11B2 and serves as a heme iron-ligating inhibitor. | ||
CYP11B enzymes are also intriguing from a basic science standpoint. Understanding the structural and mechanistic features that modulate the function of these cytochrome P450 enzymes is a long-standing challenge,6–15 in terms of both their interactions with substrates and redox partners.
The two human CYP11B enzymes are 93% identical in amino acid sequence and their native substrates 11-deoxycortisol and 11-deoxycorticosterone differ only by a C17 hydroxyl (Fig. 1Avs. 1B). As a result, it is not surprising that the enzymes have some activity with each other's native substrates in vitro,16 although this doesn’t typically occur in vivo because the CYP11B enzymes and their respective substrates are zonally separated in the adrenal cortex. CYP11B1 expression typically occurs in the zona fasciculata while CYP11B2 expression is in the zona glomerulosa. There is evidence that expression is not as tightly regulated at the region where the zona glomerulosa and fasiculata meet.17 However, the slight differences in substrates provide a strategy for probing mechanistic similarities and differences between the two closely related enzymes.
Catalysis by almost all human cytochrome P450 enzymes require a redox partner. Most are co-located in the endoplasmic reticulum with NADPH-cytochrome P450 reductase. However, mitochondrial P450 enzymes including CYP11B1 and CYP11B2 receive electrons from a distinct mitochondrial redox chain consisting of adrenodoxin reductase and adrenodoxin. First, two electrons from NADPH are transferred to the adrenodoxin reductase FAD. One electron at a time is then transferred to the soluble, 2Fe–2S protein adrenodoxin. Adrenodoxin then dissociates from adrenodoxin reductase and binds to the proximal surface of mitochondrial P450 proteins to transfer an electron to the P450 heme. This electron transfer cycle must occur twice to support a single P450 catalytic turnover, so both protein–protein interactions are necessarily transient.
In addition to its role as a redox partner, growing evidence supports that even when adrenodoxin is oxidized, its interaction with the proximal face of both CYP11B enzymes allosterically modulates P450 ligand binding and catalytic function in its active site some 18 Å away.10 Recently, equilibrium binding, inhibition, and catalytic assays using CYP11B16 and CYP11B210 indicated that adrenodoxin increases absorbance changes indicative of substrate binding and affinity (decreases the dissociation constant Kd), decreases the Km, and decreases the IC50 for multiple inhibitors. Much more limited information is available for other human mitochondrial P450 enzymes. While one study suggested adrenodoxin may not have similar effects on mitochondrial CYP11A1 function,18 surface plasmon resonance experiments indicated that the presence of substrate changed the affinity of the CYP11A1–adrenodoxin complex.12 Crosslinking and NMR studies of the mitochondrial vitamin D3 metabolizing CYP24A1 implicate specific adrenodoxin-induced conformational changes.7–9
While recent investigations effectively established that adrenodoxin has allosteric effects on CYP11B ligand binding and catalysis, the mechanism for this is currently unknown. Herein, stopped-flow studies were undertaken to probe the similarities and differences in CYP11B ligand binding and determine if adrenodoxin-mediated decreases in the ligand dissociation constant (Kd) are due to increases in ligand binding (kon) or decreased release (koff) rate constants. These experiments establish that whileCYP11B1 and CYP11B2 differ in their substrate binding mechanisms, adrenodoxin affects both increasing the rate of substrate binding and decreasing the rate of substrate release. These results substantiate carefully tuned communication between the specific P450/adrenodoxin interfaces and P450/ligand interactions. This most likely occurs through adrenodoxin modulation of P450 conformational dynamics.
Results
Rate constants for binding of 11-deoxycortisol to CYP11B1
Previous studies determining that adrenodoxin decreased the equilibrium dissociation constant (Kd) for CYP11B1 binding to its substrate 11-deoxycortisol6 prompted the current investigation to determine whether this is due to changes in substrate on and/or off rate constants. Absorbance changes that occur when substrates bind and displace a water from the P450 active site heme iron were measured using stopped flow and analyzed to discern the kon. CYP11B1 was first investigated with its native substrate 11-deoxycortisol. CYP11B1 (1 μM) and adrenodoxin were combined in one syringe and mixed 1![[thin space (1/6-em)]](https://www.rsc.org/images/entities/char_2009.gif) :1 with 11-deoxycortisol in the second syringe. Four concentrations of 11-deoxycortisol substrate (2.5, 5, 10, or 25 μM) and four concentrations of adrenodoxin were employed. The adrenodoxin concentrations were 0, equimolar or 1:1 with the CYP11B1 concentration, 10× molar excess adrenodoxin or 1:10, and 40× molar excess adrenodoxin or 1:40. As substrate binds, the heme iron of unliganded P450 is converted from the low-spin, hexacoordinate form with a coordinated water molecule (λmax 419 nm) to the high-spin, pentacoordinate form (λmax 391 nm) where substrate binding has displaced the water molecule (Fig. S1, ESI†). The differences in absorbances at the two wavelengths (A419–A391) are plotted vs. time for each set of conditions and can be fit to determine kobs. Plots of kobsvs. substrate concentration yield linear relationships whose slope and y-intercept are the kon and koff rate constants, respectively.
:1 with 11-deoxycortisol in the second syringe. Four concentrations of 11-deoxycortisol substrate (2.5, 5, 10, or 25 μM) and four concentrations of adrenodoxin were employed. The adrenodoxin concentrations were 0, equimolar or 1:1 with the CYP11B1 concentration, 10× molar excess adrenodoxin or 1:10, and 40× molar excess adrenodoxin or 1:40. As substrate binds, the heme iron of unliganded P450 is converted from the low-spin, hexacoordinate form with a coordinated water molecule (λmax 419 nm) to the high-spin, pentacoordinate form (λmax 391 nm) where substrate binding has displaced the water molecule (Fig. S1, ESI†). The differences in absorbances at the two wavelengths (A419–A391) are plotted vs. time for each set of conditions and can be fit to determine kobs. Plots of kobsvs. substrate concentration yield linear relationships whose slope and y-intercept are the kon and koff rate constants, respectively.
Several key themes are apparent in such data for CYP11B1 binding its native substrate 11-deoxycortisol. First, under all conditions binding is a single exponential phase. Second, at a given ratio of CYP11B1:adrenodoxin, increasing concentrations of substrate result in increasing CYP11B1 absorbance changes, consistent with previously reported equilibrium studies. For example, data for a constant 1:10 ratio of CYP11B1:adrenodoxin at four different 11-deoxycortisol concentrations (2.5–25 μM) is shown in Fig. 2A. Third and most notable, comparison of the data among CYP11B1 binding a constant 11-deoxycortisol substrate concentration in the presence of increasing amounts of adrenodoxin also demonstrates increasing absorbance changes. For example, CYP11B1 binding a constant 11-deoxycortisol concentration (10 μM) with four different adrenodoxin concentrations is shown in Fig. 2B. If adrenodoxin concentration and substrate binding were independent, the results with different adrenodoxin concentrations should be identical. However the current result demonstrates that increasing adrenodoxin increases the absorbance change, which correlates with the population of protein molecules in the ligand-bound state. Fitting the kinetic data to a one-phase association equation reveals a good fit (Fig. 2A and B) yielding the kobs values and confidence intervals in Table 1. There is a linear dependence between kobs and substrate concentration (e.g.Fig. 2C).
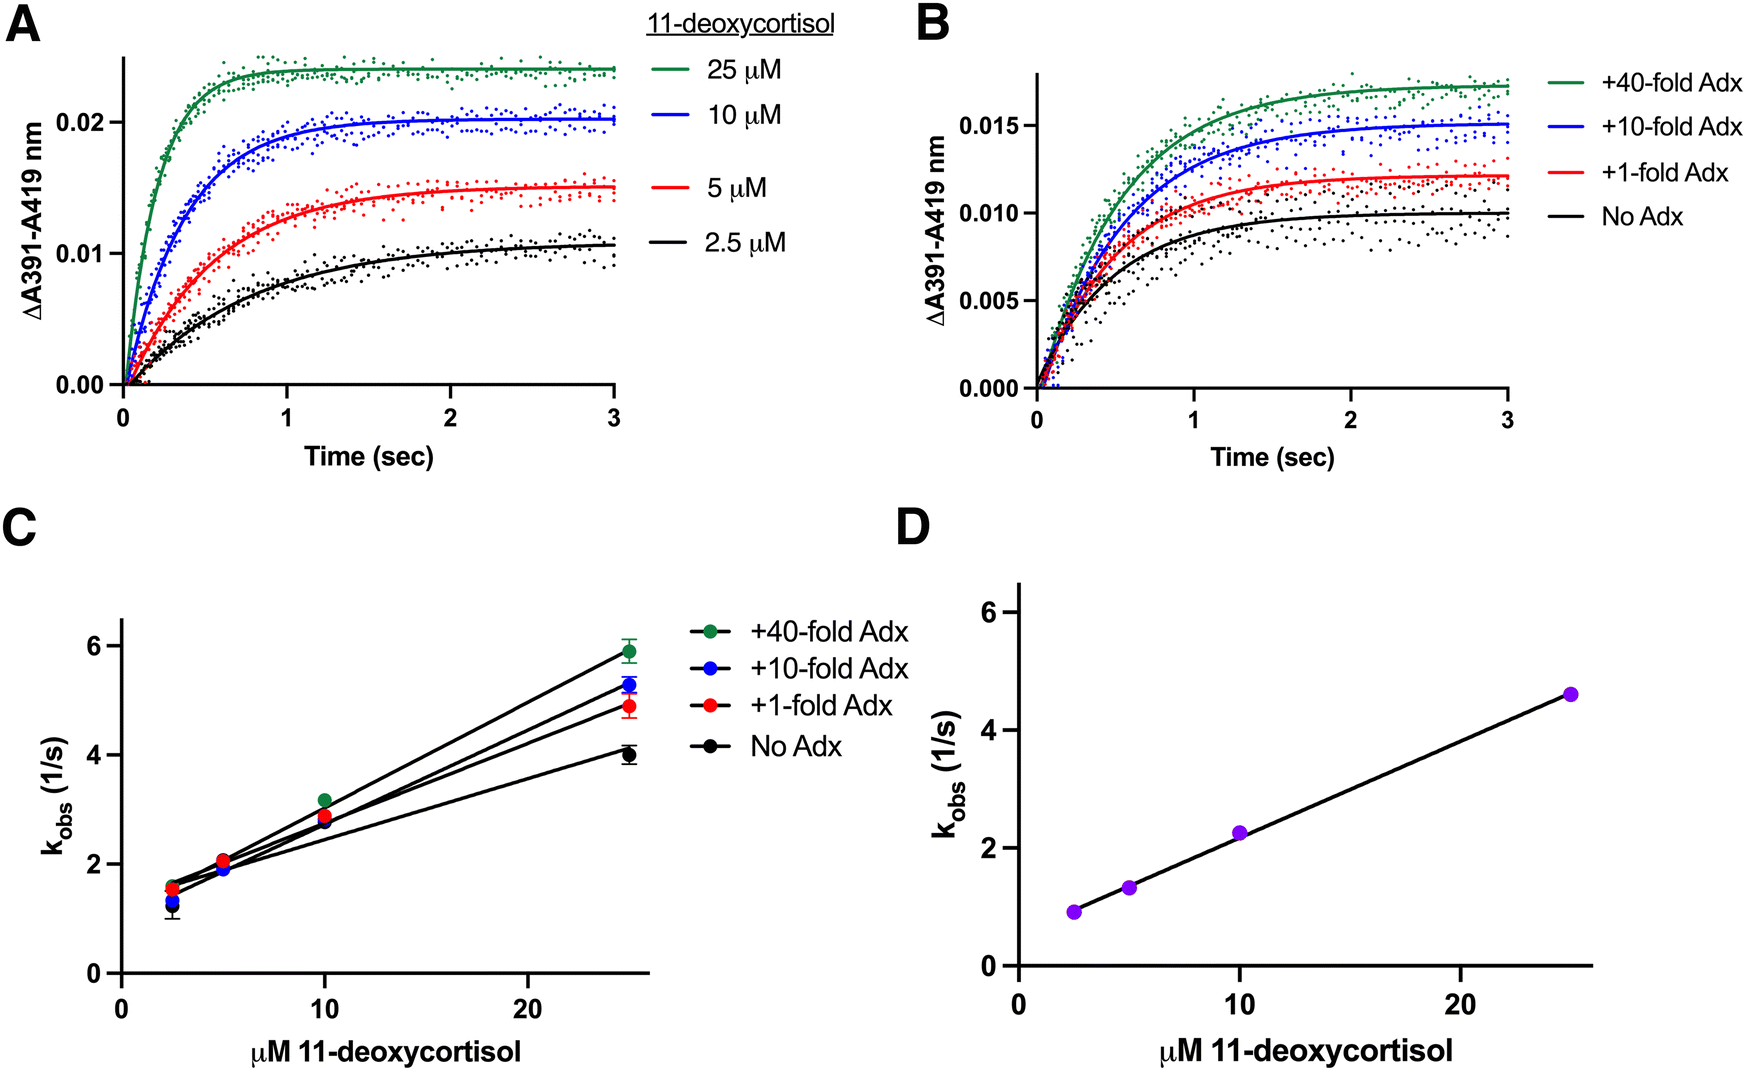 | ||
| Fig. 2 Determination of rate constants for CYP11B1 binding to its major substrate 11-deoxycortisol. CYP11B1 (1 μM) preincubated with various concentrations of adrenodoxin (0, 1, 10, or 40-fold excess) was mixed with 11-deoxycortisol (5, 10, 20, or 50 μM before mixing) and spectra recorded. (A) Changes in the ΔA391–A419 nm representing substrate binding are shown for CYP11B1 with constant (10-fold) excess adrenodoxin mixed with four different 11-deoxycortisol concentrations. (B) Changes in the ΔA391–A419 nm representing substrate binding are shown for CYP11B1 with constant (10 μM) 11-deoxycortisol mixed with four different adrenodoxin concentrations. All CYP11B1 binding curves were a single phase, best fit by a single exponential equation (solid lines). The remaining adrenodoxin and 11-deoxycortisol conditions are shown in Fig. S2 (ESI†). (C) Plots of the rate constants (kobs) from panels A, B, and the additional experiments in Fig. S2 (ESI†) are plotted vs. 11-deoxycortisol concentration for the various adrenodoxin concentrations. (D) The same plot of the rate constant (kobs) against 11-deoxycortisol concentration is shown for an artificial adrenodoxin/CYP11B1 fusion enzyme. | ||
| Enzyme | Substrate | Free adrenodoxin molar ratio | k on (μM−1 s−1) | k off (s−1) |
|---|---|---|---|---|
| CYP11B1 | 11-Deoxycortisol | 0 | 0.11 (0.02–0.21) | 1.33 (0.02–2.64) |
| 1 | 0.15 (0.11–0.18) | 1.29 (0.84–1.74) | ||
| 10 | 0.17 (0.15–0.20) | 1.00 (0.65–1.35) | ||
| 40 | 0.19 (0.16–0.23) | 1.10 (0.64–1.55) | ||
| Adx/CYP11B1 fusion | 11-Deoxycortisol | NA | 0.16 (0.15–0.18) | 0.54 (0.31–0.77) |
| CYP11B1 | 11-Deoxycorticosterone | 0 | 0.30 (0.26–0.34) | 1.94 (1.33–2.54) |
| 1 | 0.30 (0.29–0.30) | 2.31 (2.19–2.43) | ||
| 10 | 0.32 (0.28–0.37) | 2.60 (1.86–3.33) | ||
| 40 | 0.40 (0.25–0.55) | 2.34 (−0.04–4.72) | ||
| CYP11B2 | 11-Deoxycorticosterone | 0 | 0.35 (0.24–0.45) | 2.32 (0.88–3.76) |
| 1 | 0.37 (0.18–0.55) | 2.45 (−0.04–4.95) | ||
| 10 | 0.47 (0.40–0.53) | 2.06 (1.14–2.98) | ||
| 40 | 0.56 (0.36–0.76) | 2.01 (−0.71–4.73) | ||
| Adx/CYP11B2 fusion | 11-Deoxycorticosterone | NA | 0.40 (0.35–0.45) | 1.85 (1.18–2.52) |
| CYP11B2 | 11-Deoxycortisol | 0 | 0.15 (0.12–0.18) | 0.49 (−0.01–0.99) |
| 1 | 0.15 (0.07–0.24) | 0.86 (−0.52–2.23) | ||
| 10 | 0.16 (0.06–0.25) | 0.99 (−0.51–2.49) | ||
| 40 | 0.18 (0.08–0.27) | 0.97 (−0.51–2.44) |
The same one-phase binding was observed for all other combinations of the four 11-deoxycortisol and four adrenodoxin concentrations (Fig. S2, ESI†). Similarly, fits to a one-phase association equation fit well (Fig. S2, ESI†). Plotting all sixteen of the resulting kobs values (Table 1) vs. the 11-deoxycortisol substrate concentration (Fig. 2C) reveals that increasing adrenodoxin concentrations increases the association rate constant kon, as evidenced by the increasing slope, and decreases the dissociation rate constant koff, as evidenced by the y-intercept trend. The fitted values for these on and off rate constants in Table 1 clearly demonstrate that increasing adrenodoxin causes a small but clear trend in increasing kon and general decreases in koff.
The effect of adrenodoxin on 11-deoxycortisol binding rate constants was also probed for an artificial fusion of adrenodoxin and CYP11B1. Details of the construction, expression, and purification of this artificial fusion were previously published,6 but essentially consists of adrenodoxin at the N-terminus, followed by a short linker and the CYP11B1 catalytic domain at the C-terminus. By definition this fusion represents a 1:1 stoichiometry for the two proteins but additionally co-localizes them to promote interaction. In experiments parallel to those described above, this Adx-CYP11B1 fusion was mixed with four different concentrations of 11-deoxycortisol using stopped-flow and 11-deoxycortisol binding was observed by absorbance changes (Fig. S1 and S6, ESI†). Consistent with the previously reported equilibrium studies increasing adrenodoxin increased P450 saturation with ligand. A single exponential or one phase association equation fit the data well, yielding increasing kobs with increasing substrate concentrations (Fig. 2D). The slope and y-intercept of this plot indicate a kon very similar to that of the free 1:1 adrenodoxin:CYP11B1 value (0.16 vs. 0.15, Table 1), but a koff that is more than two-fold lower (0.54 vs. 1.29, Table 1).
Rate constants for binding of 11-deoxycorticosterone to CYP11B2
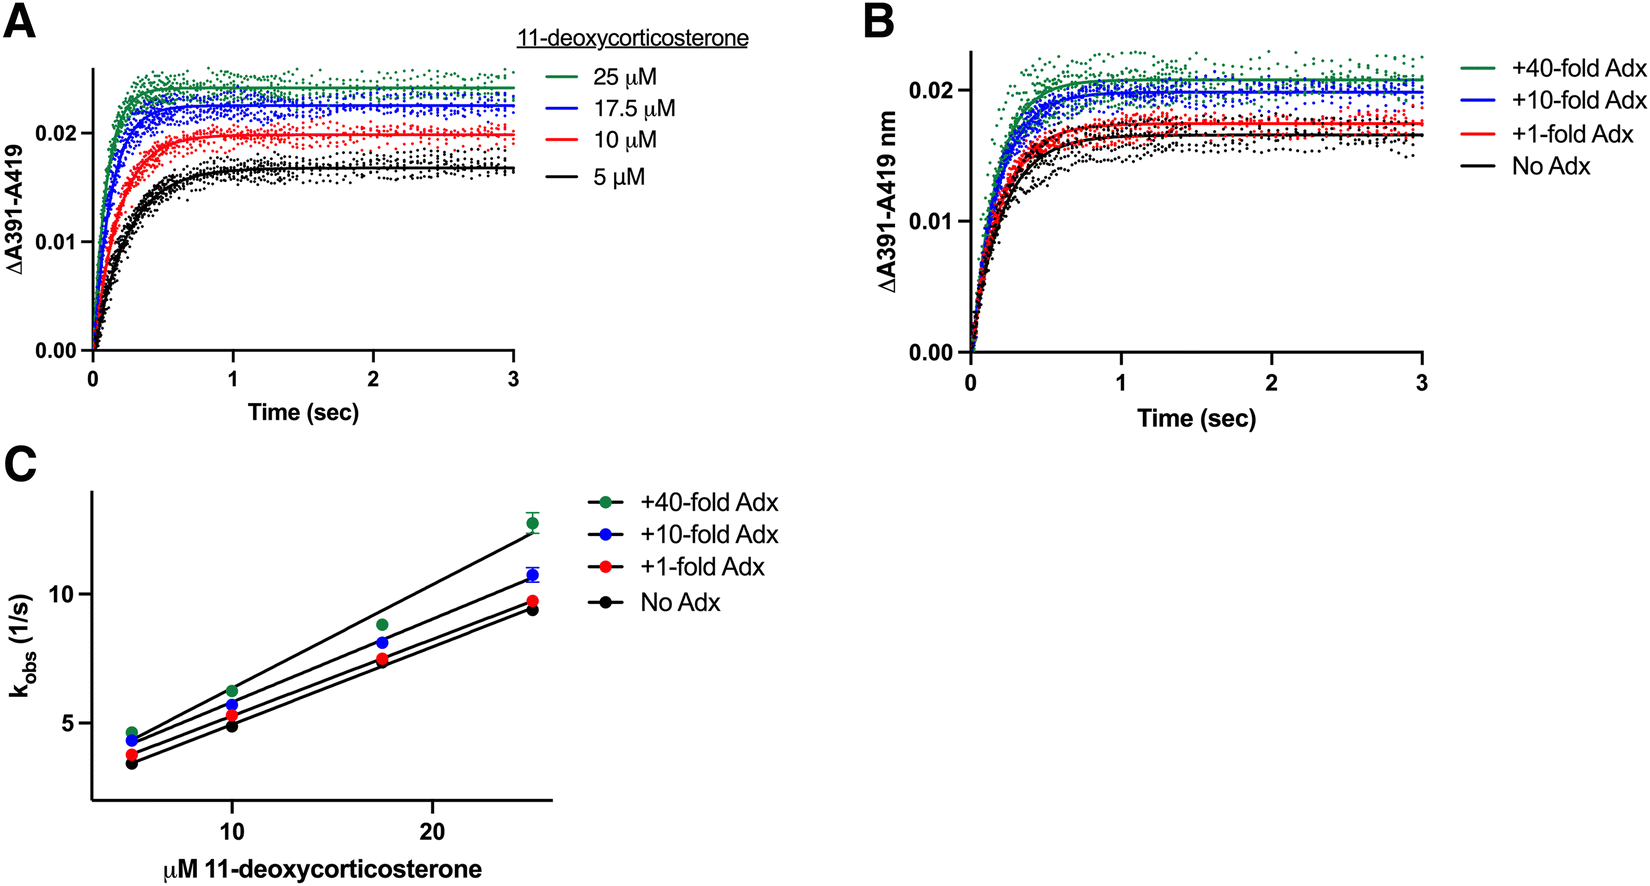
An essentially identical series of stopped-flow experiments to those described above were performed for CYP11B2 with its native substrate 11-deoxycorticosterone. That is, 11-deoxcorticosterone binding rate constants were measured at four different substrate concentrations (2.5, 5, 10, and 25 μM) at each of four adrenodoxin concentrations (0, 1×, 10×, 40×) using stopped flow. As with CYP11B1 the absorbance of the water-bound form at 419 nm decreased over time as the absorbance increased at 391 nm representing generation of the substrate-bound CYP11B2 form. Differences between the absorbance at these two wavelengths were plotted vs. time (Fig. S3, ESI†) and fit to determine kobs. Representative data for 1:10 CYP11B2:adrenodoxin with increasing substrate concentrations (Fig. 3A) or CYP11B2 binding 10 μM substrate with increasing amounts of adrenodoxin (Fig. 3B) demonstrate increasing saturation in both cases.
 | ||
| Fig. 3 Determination of rate constants for CYP11B2 binding to its major substrate 11-deoxycorticosterone. CYP11B2 (2 μM) preincubated with various concentrations of adrenodoxin (0, 1, 10, or 40-fold excess) was mixed with 11-deoxycorticosterone (5, 10, 20, or 50 μM before mixing) and spectra recorded. (A) Changes in the ΔA391–A419 nm representing substrate binding are shown for CYP11B2 in the presence of constant (10-fold excess) adrenodoxin with four different 11-deoxycorticosterone concentrations. (B) Changes in the ΔA391–A419 nm representing substrate binding are shown for CYP11B2 with constant (10 μM) 11-deoxycorticosterone and varying adrenodoxin concentrations. The remaining adrenodoxin and 11-deoxycorticosterone conditions are shown in Fig. S3 (ESI†). All traces were best fit to a biexponential equation (solid lines) yielding rate constants for both the slow and fast phases (kfast and kslow). For these experiments, the percent fast phase ranged from 40–59%. (C) The kfast values for CYP11B2 in the presence of various adrenodoxin concentrations were plotted against 11-deoxycorticosterone concentration and fit to a line to determine kon (slopes) and koff (y-intercepts) in Table 1. (D) The kslow values for CYP11B2 in the presence of various adrenodoxin concentrations were plotted against 11-deoxycorticosterone concentration and fit to a line but yielded little change systematic change in the rates. (E) The corresponding kfast values for the adrenodoxin/CYP11B2 fusion enzyme plotted against 11-deoxycorticosterone concentration yielded the kon and koff rates in Table 1. (F) The kslow values for the adrenodoxin/CYP11B2 fusion enzyme did not significantly vary with substrate concentration. In all experiments, data was collected for at least 15 seconds, but only the first 5 seconds are shown here to facilitate visualization of both phases. | ||
Distinct from the CYP11B1 experiments where a single exponential was sufficient to fit the hyperbolic data, CYP11B2 substrate binding in all cases had an initial fast phase (35.0–55.8%) followed by a slower binding phase (44.2–65.0%) and thus required a bi-exponential (double exponential) equation (Fig. 3A and B). This is supported by an R2 of 0.91–0.98; average: 0.956 for fits to the single exponential and a significantly improved R2 of 0.97–0.99; average: 0.994 for the double exponential fit. Given the 93% amino acid sequence identity between the two enzymes, this difference is notable. Fitting to the bi-exponential equation results in two kobs values, demarcated here as kfast for the fast phase and kslow for the slow phase. A plot of the kfast values for each concentration of adrenodoxin against the substrate concentration reveals that kfast varies linearly with substrate concentration and increases with increasing adrenodoxin concentration (Fig. 3C). The on and off rate constants determined from the slope and y-intercepts in this plot are provided in Table 1 with their 95% confidence intervals. With increasing adrenodoxin these values indicate a systematic increase in the on rate constants (slopes) and a general decrease in the off rate constants (y-intercepts) similar to the observations for CYP11B1. The kslow values are plotted against the substrate concentration in Fig. 3D. The kslow values appear to be stationary or increase very slightly with substrate concentration.
Similar to the CYP11B1/11-deoxycortisol experiments described above, binding rates were also measured with an artificial fusion of N-terminal adrenodoxin and CYP11B2 at the C-terminus previously described.10 Bi-exponential binding of 11-deoxycorticosterone was again observed. Plots of the kfast against substrate concentration are shown in Fig. 3E and demonstrate a linear dependence. The derived on and off rate constants (Table 1) display the same trends as the adrenodoxin/CYP11B1 fusion, in that kon is similar to the experiment using equimolar ratios of free CYP11B2 and adrenodoxin while the koff is significantly reduced. Again the kslow values were little affected (Fig. 3F).
Rate constants for binding of 11-deoxycorticosterone to CYYP11B1
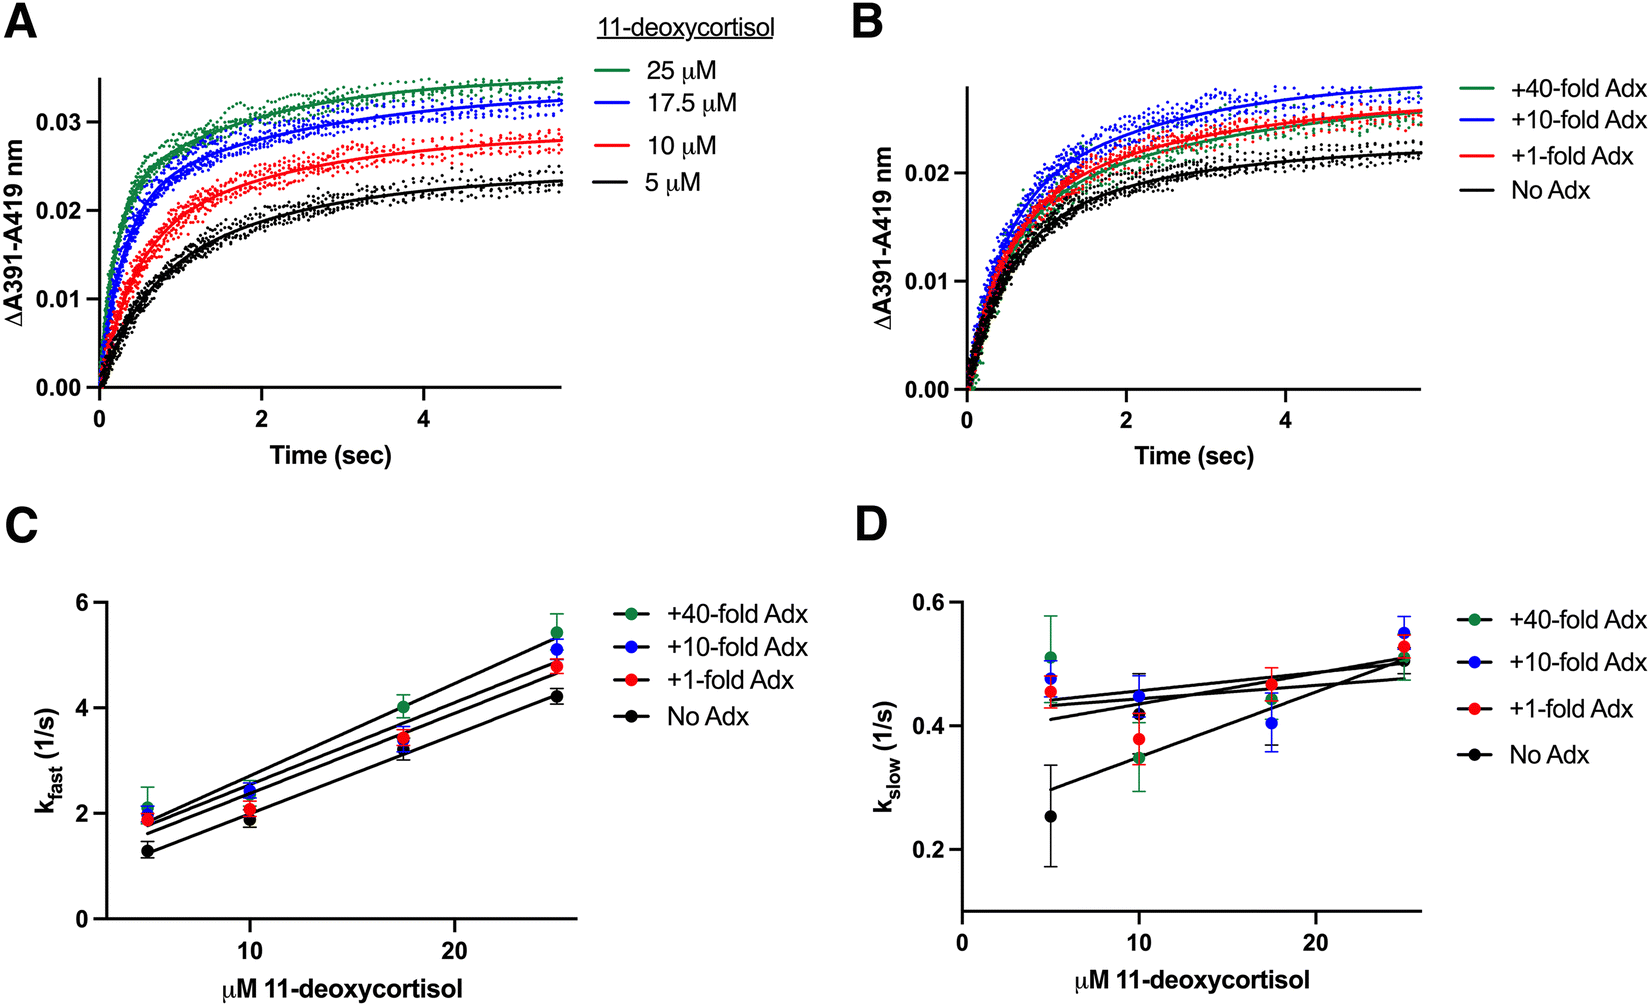
The preceding experiments established that CYP11B1 binds its 11-deoxycortisol substrate with a single association rate constant, while CYP11B2 binds its 11-deoxycorticosterone substrate with two rate constants (kfast and kslow). These differences are not understood. The enzymes are 93% identical and the substrates differ only by a hydroxyl at C-17 (Fig. 1). Thus, to determine whether the difference in binding behavior is due to the substrate or the enzyme, CYP11B1 was evaluated with the CYP11B2 substrate 11-deoxycorticosterone and vice versa. This was possible because both enzymes bind both substrates, though they metabolize them with quite differential rates.19A set of stopped flow experiments corresponding to those described above was collected and analyzed for CYP11B1 binding the CYP11B2 substrate 11-deoxycorticosterone (Fig. S4, ESI†). Experiments for CYP11B1 binding increasing 11-deoxycorticosterone concentrations in the presence of a consistent 10-fold adrenodoxin concentration (Fig. 4A) and for CYP11B1 binding 11-deoxycorticosterone in the presence of a consistent 10 μM 11-deoxycorticosterone but increasing adrenodoxin concentrations (Fig. 4B) are representative. Under all conditions CYP11B1 binding its minor substrate 11-deoxycorticosterone exhibited monophasic curves, as observed for CYP11B1 binding its native substrate 11-deoxycortisol and not the biphasic curves consistently observed for 11-deoxycorticosterone binding to CYP11B2. Plotting the observed rates vs. the 11-deoxycorticosterone concentration (Fig. 4C) permitted definition of the on and off rate constants (Table 1). This revealed that adrenodoxin increased kon by the 1:40 condition, whereas the koff values trended upward at lower adrenodoxin concentrations. This suggests that the binding mechanism is dictated by enzyme features and not the substrate structure.
 | ||
| Fig. 4 Determination of rate constants for CYP11B1 binding its minor substrate 11-deoxycorticosterone. CYP11B1 (1 μM) preincubated with various concentrations of adrenodoxin (0, 1, 10, or 40-fold excess) was mixed 1:1 with 11-deoxycortisol (10, 20, 35, or 50 μM before mixing). (A) Changes in the ΔA391–A419 nm representing substrate binding are shown for CYP11B1 in the presence of constant (10-fold excess) adrenodoxin with four different 11-deoxycorticosterone concentrations. (B) Changes in the ΔA391–A419 nm representing substrate binding are shown for CYP11B1 with constant (10 μM) 11-deoxycorticosterone and varying adrenodoxin concentrations. The remaining adrenodoxin and 11-deoxycorticosterone conditions are shown in Fig. S4 (ESI†). All experiments were readily fit to a single exponential (solid lines). (C) Plots of the resulting kobs plotted against 11-deoxycorticosterone concentration were fit to a line to determine the kon (slopes) and koff (y-intercepts) in Table 1. | ||
Rate constants for binding of 11-deoxycortisol to CYP11B2
If the association mechanism (monophasic or biphasic) is dictated by enzyme rather than the substrate, then CYP11B2 binding the native CYP11B1 substrate 11-deoxycortisol would be expected to exhibit biphasic kinetics. To test this, stopped-flow experiments were performed at multiple substrate concentrations and adrenodoxin concentrations as described previously. Indeed in all cases a biphasic model is required to fit this substrate binding data. Examples of CYP11B2 binding increasing 11-deoxycortisol concentrations at a constant 1:10 adrenodoxin concentration (Fig. 5A) and CYP11B2 binding a constant 10 μM 11-deoxycortisol with increasing adrenodoxin concentrations (Fig. 5B) are shown as examples, with all data present in Fig. S5 (ESI†). The kfast values are plotted against substrate concentration in Fig. 5C, demonstrating a linear dependence on substrate concentration. Similar to the other experiments, the slope or kon increased with increasing adrenodoxin. Trends in the koff or y-intercept were less certain due to higher error. Fig. 5D shows the kslow values plotted against substrate concentration, which appears to be more constant with increasing ligand concentration.
 | ||
| Fig. 5 Determination of rate constants for CYP11B2 binding to its minor substrate 11-deoxycortisol. CYP11B2 (2 μM) preincubated with various concentrations of adrenodoxin (0, 1, 10, or 40-fold excess) was mixed 1:1 with 11-deoxycorticosterone (10, 20, 35, or 50 μM before mixing). (A) Changes in the ΔA391–A419 nm representing substrate binding are shown for CYP11B2 in the present of constant (10-fold excess) adrenodoxin with four different 11-deoxycortisol concentrations. (B) Changes in the ΔA391–A419 nm representing substrate binding are shown for CYP11B2 with constant (10 μM) 11-deoxycortisol and varying adrenodoxin concentrations. The remaining adrenodoxin and 11-deoxycorticosterone conditions are shown in Fig. S5 (ESI†). All experiments fit best to the biexponential equation (solid lines) yielding rate constants for both the slow and fast phases (kslow and kfast). For these experiments, the percent fast phase ranged from 44–62%. (C) These kfast values plotted against 11-deoxycortisol concentration for CYP11B2 with various amounts of adrenodoxin were fit to a line (solid line) to determine the kon (slopes) and koff (y-intercepts) in Table 1. (D) The kslow values were also plotted against 11-deoxycorticosterone concentration yielding kon (slopes) and koff (y-intercepts) that are fairly constant. | ||
Validation of a displacing ligand for more direct measurement of off rate constants
The stopped-flow approach employed above is a valid approach for measuring the on and off rate constants as the slope and y-intercept of a plot of kobsvs. ligand. However the off rate constants can often exhibit higher error than the on rate constants, as was the case in the experiments described above (Table 1). An orthogonal experiment can also be used to independently determine the off rate constant with less error. In this approach the rate of dissociation of the original ligand is measured as a spectrally-distinguishable ligand takes its place. This strategy requires that the displacing ligand binds much more quickly than the off rate of the original dissociating ligand. In the current experiments the displacing ligand used was the type II inhibitor LCI699 (Fig. 1C). Previous studies have validated that LCI699 binds in the same CYP11B2 active site where substrates bind,4 but only LCI699 forms a coordinate-covalent bond with the active site iron. This yields an absorbance maximum at 424 nm which is spectrally distinct from the substrate-bound form with an absorbance maximum at 419 nm. In stopped-flow experiments, mixing of CYP11B enzymes with LCI699 resulted in a 5 nm spectral shift (Fig. S7, ESI†) and the observed rates were 65.1 s−1 (95% CI 61.6–68.9) for CYP11B1 (Fig. 6A) and 47.3 s−1 (95% CI 41.1–54.4) for kfast for CYP11B2 (Fig. 6B). Since the off rates for CYP11B enzymes estimated above are 1–2 s−1, they are 20- to 40-fold slower than LCI699 binding. Thus LCI699 is a suitable displacing ligand or “trapping” agent for these experiments.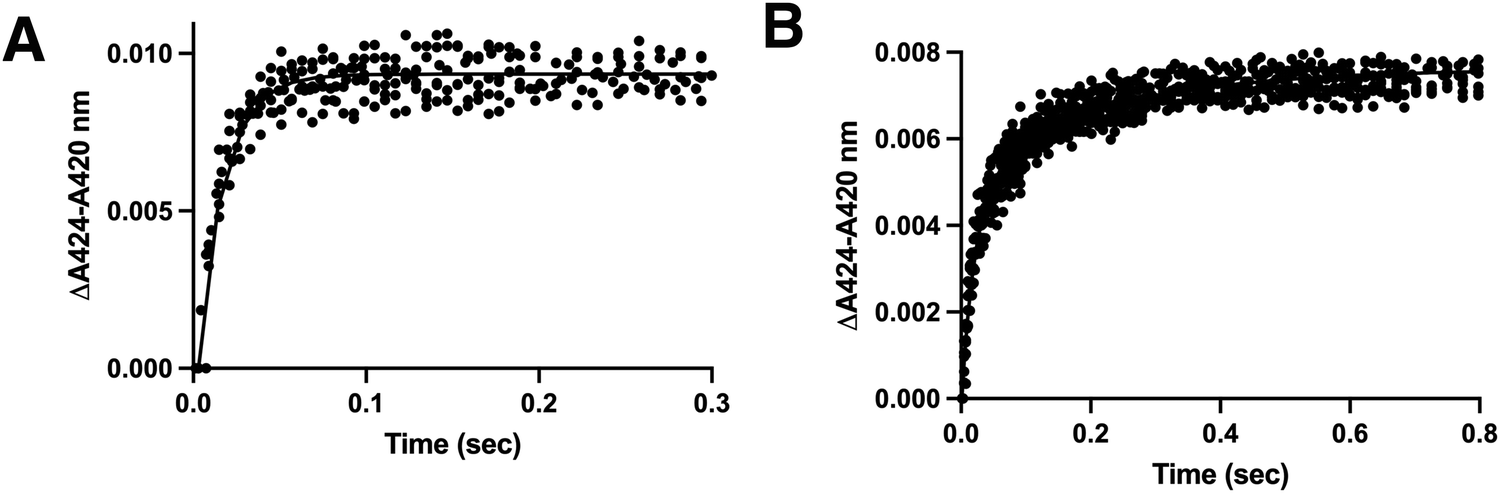 | ||
| Fig. 6 Determination of rate constants for LCI699 binding to CYP11B1 and CYP11B2 to evaluate LCI699 as a potential way to measure the formation of substrate-free enzyme (“trapping compound”). CYP11B1 or CYP11B2 (4 μM) was mixed with 100 μM LCI699 and absorbance spectra were recorded, resulting in a type II shift with increasing absorbance a 424 nm and decreasing absorbance at 420 nm (Fig. S7, ESI†). The Δ424–420 nm was plotted against time and fit to determine the binding rate constants. (A) The data for CYP11B1 binding LCI699 was best fit to the one-phase association equation (solid line) yielding a kobs of 65.1 (61.6–68.9) s−1. (B) The data for CYP11B2 binding LCI699 was best fit to the two-phase association equation (solid line) yielding a kfast value of 47.3 (41.1–54.4) s−1 and a kslow value of 4.9 (4.2–5.6) s−1. | ||
Cross validation of koff for CYP11B enzymes with multiple substrates
When CYP11B1 saturated with either substrate was mixed with LCI699 using stopped-flow, the spectral shift was even greater than above because the substrate-bound Soret maximum is more blue-shifted (391 nm). Thus a more substantial ∼30 nm shift occurred between the substrate-bound form and the LCI699-bound form (Fig. S8, ESI†). These experiments were completed for both CYP11B1 and CYP11B2 binding to both 11-deoxycortisol and 11-deoxycorticosterone at four different adrenodoxin concentrations. Plotting the change in absorbance between 390 nm and 424 nm vs. time (e.g.Fig. 7A and B, full data in Fig. S9, ESI†) yielded the koff rate constants and 95% confidence intervals in Table 2. Consistent with the straight binding experiments above, this approach more clearly validated that that increasing adrenodoxin concentrations monotonically decrease both CYP11B1 and CYP11B2 release/off rate constants for both substrates. | ||
| Fig. 7 Experiments using LCI699 as a trapping agent to quantitate substrate koff. Either CYP11B1 or CYP11B2 (2 μM) was pre-equilibrated with a saturating amount (70 μM) of the substrates 11-deoxycortisol or 11-deoxycorticosterone and either 0, 1, 10, or 40-fold excess adrenodoxin. The CYP11B/substrate/adrenodoxin sample was mixed 1:1 with 100 μM LCI699 and absorbance spectra was recorded. These spectra revealed an increase in absorbance at 424 nm and decrease at 390 nm consistent with conversion from the substrate-bound to inhibitor-bound form (Fig. S8, ESI†). The ΔA390–A424 plotted against time are shown for (A) CYP11B1 with 11-deoxycorticosterone and (B) CYP11B2 with 11-deoxycorticosterone. The remaining traces are shown in Fig. S9 (ESI†). The fit of this data was used to determine the substrate koff rates in Table 2. | ||
| Enzyme | Substrate | Adrenodoxin molar ratio | k off (s−1) (95% CI) |
|---|---|---|---|
| 11B1 | 11-Deoxycortisol | 0 | 1.15 (1.12–1.19) |
| 1 | 1.09 (1.07–1.11) | ||
| 10 | 0.81 (0.79–0.82) | ||
| 40 | 0.75 (0.74–0.76) | ||
| 11B1 | 11-Deoxycorticosterone | 0 | 2.04 (1.99–2.10) |
| 1 | 1.88 (1.84–1.92) | ||
| 10 | 1.46 (1.43–1.49) | ||
| 40 | 1.20 (1.17–1.24) | ||
| 11B2 | 11-Deoxycortisol | 0 | 0.70 (0.67–0.72) |
| 1 | 0.52 (0.50–0.54) | ||
| 10 | 0.48 (0.48–0.49) | ||
| 40 | 0.41 (0.40–0.42) | ||
| 11B2 | 11-Deoxycorticosterone | 0 | 0.72 (0.70–0.75) |
| 1 | 0.55 (0.53–0.57) | ||
| 10 | 0.47 (0.45–0.48) | ||
| 40 | 0.42 (0.41–0.43) |
Discussion
Adrenodoxin influences CYP11B1 and CYP11B2 binding rate constants to each respective major substrate
Previously, we determined that adrenodoxin increases the affinity of both CYP11B1 and CYP11B26,10 for multiple ligands, as revealed by decreases in the dissociation constant Kd. Since Kd is equivalent to koff/kon, this adrenodoxin-mediated increase in binding affinity must result from a decrease in koff and/or an increase in kon. Determination of these binding rate constants thus provides insight into whether the adrenodoxin allosteric modulation results from facilitating substrate binding or decelerating substrate release. Using stopped-flow, we determined the influence of adrenodoxin on CYP11B1 and CYP11B2 substrate binding rate constants using 4 different ratios of CYP11B to adrenodoxin: 1:0, 1:1, 1:10, and 1:40. Initially, we measured CYP11B1 binding rates to its major substrate 11-deoxycortisol (Fig. 2) and CYP11B2 binding rates to its major substrate 11-deoxycorticosterone (Fig. 3). Interestingly, as the adrenodoxin increased, the kon increased monotonically while the koff usually decreased (Table 1). These results were compared to equilibrium substrate Kd values previously reported6,10 (Table 3). While the equilibrium Kd values were systematically higher than the Kd values determined here via transient state kinetics, the overall trends remained consistent. For both methods, increasing adrenodoxin resulted in a decreased Kd with similar net-fold decreases from 0 to 40× equivalents of adrenodoxin.
| Enzyme | Substrate | Adrenodoxin molar ratio | k off (s−1) | k on (μM s−1) | K d (μM) | Equilibrium Kd valuesd (μM) |
|---|---|---|---|---|---|---|
| a k off values from experiments with LCI699 trapping enzyme having released substrate. b k on values from initial direct binding experiments. c K d values calculated from koff/kon. d Values from (4, 6, 10).N.D., not determined. | ||||||
| CYP11B1 | 11-Deoxy-cortisol | 0 | 1.15 | 0.11 | 10.45 | 17.0 |
| 1 | 1.09 | 0.15 | 7.27 | 20.8 | ||
| 10 | 0.81 | 0.17 | 4.76 | 12.2 | ||
| 40 | 0.75 | 0.19 | 3.95 | 7.3 | ||
| Fold change | ⇓1.53 | ⇑1.72 | ⇓2.65 | 2.33 | ||
| CYP11B1 | 11-Deoxy-corticosterone | 0 | 2.04 | 0.30 | 6.80 | ND |
| 1 | 1.88 | 0.30 | 6.27 | |||
| 10 | 1.46 | 0.32 | 4.56 | |||
| 40 | 1.20 | 0.40 | 3.00 | |||
| Fold change | ⇓1.70 | ⇑1.33 | ⇓2.27 | |||
| CYP11B2 | 11-Deoxy-cortisol | 0 | 0.70 | 0.15 | 4.67 | ND |
| 1 | 0.52 | 0.15 | 3.47 | |||
| 10 | 0.48 | 0.16 | 3.00 | |||
| 40 | 0.41 | 0.18 | 2.28 | |||
| Fold change | ⇓1.71 | ⇑1.20 | ⇓2.05 | |||
| CYP11B2 | 11-Deoxy-corticosterone | 0 | 0.72 | 0.35 | 2.06 | 10.39 |
| 1 | 0.55 | 0.37 | 1.49 | 3.94 | ||
| 10 | 0.47 | 0.47 | 1.00 | 3.38 | ||
| 40 | 0.42 | 0.56 | 0.75 | 3.42 | ||
| Fold change | ⇓1.71 | ⇑1.60 | ⇓2.74 | 3.06 | ||
The physical implications of this result deserve consideration. The results suggest that adrenodoxin binding on the P450 surface changes the enzyme conformation in such a way that the active site cavity some 18 Å away cavity is more available to ligand, thus facilitating binding, but this conformational change also creates a more conducive environment for prolonged binding in the active site, thus slowing substrate release. This suggests that adrenodoxin binding may cause a complex conformational change, resulting in structural changes in multiple regions of the protein. For example, it is possible that adrenodoxin binding could affect both the opening of the substrate access channel20 as well as the heme and/or active site. It is even possible that substrate binding itself induces a conformational change on the P450/adrenodoxin complex. It is possible that adrenodoxin allosterically modulates the dynamics of P450, causing the increase in kon, but the binding of substrate and displacement of water in turn induces another conformational change in the P450/adrenodoxin interaction that is responsible for the decrease in koff. To date we only have structures for the adrenodoxin/CYP11B2 fusion with inhibitor.10
These stopped-flow studies were additionally completed to measure substrate kon and koff values for artificially fused constructs of adrenodoxin and the CYP11Bs. These Adx—CYP11B fusions are expected to stabilize the normally transient interaction between adrenodoxin and the P450. Two pieces of evidence support this stabilization. First, crystal structures of both CYP11A1 and CYP11B2 fused to adrenodoxin have been solved,10,18 which would not be feasible unless the interaction was stabilized. Second, the adrenodoxin/CYP11B fusions only turn over product in the presence of 40-fold excess added free adrenodoxin, suggesting that the interaction between the two fused domains must be outcompeted to result in productive catalysis.6,10 The adrenodoxin/CYP11B fusion proteins both had comparable kon values to the experiments using 1:1 CYP11B:adrenodoxin, however the koff for the fusion was distinctly lower in both cases (Table 1). This result is interesting as the fusion enzymes stoichiometrically have the same amount of adrenodoxin as in the 1:1 CYP11B:adrenodoxin experiments, however these experiments differ in that the interaction with the free adrenodoxin is transient, whereas the interaction in the fusion enzyme is stabilized. This suggests that transient binding to the P450 is sufficient to result in the kon increases, however more sustained binding of adrenodoxin may be necessary to result significantly decreased koff values.
Adrenodoxin influences CYP11B binding rate constants to each other's substrates
The specificity of the adrenodoxin allosteric effect was interrogated by swapping CYP11B substrates. The CYP11B substrates 11-deoxycortisol and 11-deoxycorticosterone differ by only a C-17 hydroxyl group (Fig. 1). Previous literature indicates that the CYP11B enzymes readily turn over each other's substrates,19 albeit at differential rates. Interestingly, initial ligand binding experiments at increasing adrenodoxin concentrations clearly revealed increasing kon values for both CYP11B enzymes binding the incorrect substrate (Table 1), although the increases were 1.2- to 1.3-fold higher for the opposing substrate and a larger 1.6- to 1.7-fold higher for the matching substrates (Table 3). Trends in the koff values were more difficult to decipher due to higher error values. To better define the koff values, experiments were performed to trap enzyme that has released substrate. Evaluation of all four CYP11B/substrate pairs and for all four ratios of CYP11B:adrenodoxin revealed that in each case increasing adrenodoxin monotonically lowered the koff (Table 2). In these results the off rate constants were decreased by a similar 1.5- to 1.7-fold, regardless of the enzyme/substrate pairing.
An additional observation was that the kon values for both CYP11B1 and CYP11B2 binding to 11-deoxycorticosterone were significantly higher than for either enzyme binding to 11-deoxycortisol (Table 1). One would expect that the major substrate would have the highest kon, but this is not the case for CYP11B1. Interestingly though, the koff for CYP11B1 binding to 11-deoxycorticosterone is about twice as high as that of 11-deoxycortisol. As these substrates differ by only a C-17 hydroxyl, perhaps the positioning of the hydroxyl somewhat hinders substrate binding initially but helps to form a stronger interaction with the active site once bound.
CYP11B1 and CYP11B2 exhibit different substrate binding mechanisms
The results herein revealed that CYP11B1 and CYP11B2 have differing substrate binding mechanisms. CYP11B1 binding of either 11-deoxycortisol or 11-deoxycorticosterone results in a single phase consistent with one-step binding. This binding varies linearly with substrate concentration. However CYP11B2 binding to either 11-deoxycorticosterone or 11-deoxycortisol results in an initial fast and a subsequent slow phase, corresponding to two-step binding (Fig. 3). The fast phase varies linearly with substrate concentration, like CYP11B1, whereas the slow phase is relatively constant with substrate concentration. Thus, no matter the substrate, CYP11B1 binding was always monophasic and CYP11B2 binding was always biphasic. This confirmed that the difference in binding mechanism is enzyme-specific.This result was unexpected since the CYP11B enzymes are 93% identical, their substrates only differ by a single hydroxyl, both perform 11β-hydroxylation reactions, and selective drugs for one CYP11B over the other have yet to be developed.21 However, one key difference between the CYP11Bs is that CYP11B2 has additional 18-hydroxylation and 18-oxidase function in addition to the 11β-hydroxylation, whereas CYP11B1 primarily performs the 11β-hydroxylation with very little 18-hydroxylation and essentially no 18-oxidase activity.19 Because CYP11B2 performs three different reactions, its active site might be more dynamic to accommodate multiple orientations of the steroid. Although determination of the specific CYP11B2 binding mechanism is outside of the scope of this work, these studies would be highly informative in determining functional and mechanistic differences between CYP11B1 and CYP11B2. Since CYP11B1 and CYP11B2 are both drug targets for different disease states, identification of any sort of difference that could be exploited for drug design is of high interest. Crystal structures of both enzymes are now available,19,21 and combining knowledge of both structural and functional differences between the two enzymes could empower future drug development.
Potential mechanisms for CYP11B/adrenodoxin interactions
Adrenodoxin is known to bind to the proximal side of the CYP11B enzymes, as illustrated by a structure of the CYP11B2/adrenodoxin fusion (Fig. 8) published recently.10 Specific hydrogen bonding and electrostatic interactions occur between multiple residues in helix 3 and the adjacent meander around the iron–sulfur cluster of adrenodoxin and specific CYP11B2 residues in the P450 it's heme-ligating meander, K” helix, K helix, and L helix. While no similar structure is available for CYP11B1 with adrenodoxin, these interacting residues are conserved with the exception of position 439 (Tyr in CYP11B1, His in CYP11B2). The distance between the adrenodoxin iron–sulfur and the heme iron is ∼18 Å and both inhibitors and substrates bind on the opposite (distal) side of the heme. Thus adrenodoxin alterations in substrate binding and release occur allosterically. | ||
| Fig. 8 CYP11B2/adrenodoxin structure (PDB 7M8I).10 Adrenodoxin (dark grey ribbons) binds to the proximal side of CYP11B2 (cyan ribbons), while substrates and inhibitors (here illustrated by fadrozole in light grey sticks) bind to the distal side of the heme (black sticks). Substrate entry and exit is thought to occur via conformational changes in the P450 secondary structure elements at the far top in this orientation. Thus adrenodoxin is thought to act allosterically or at a distance to modulate substrate on and off rate constants. | ||
The active sites of the two CYP11B enzymes have all first shell residues completely conserved, though they can adopt slightly different rotamers and positions.21 Many ligands are thought to bind to P450 enzymes by conformational selection.22–24 That is, the protein preexists in multiple conformations and the ligand binds to the one that is compatible. It is possible that adrenodoxin binding causes allosteric CYP11B conformational changes to yield the changes in on and off rate constants observed herein. It has previously been observed that cytochrome b5 binding to the same proximal region of CYP17A1 causes conformational modulation of that enzyme in regions thought to control substrate binding.25 Although the exact mechanism that allosterically modulates the CYP11B proteins is unknown, there are several hypotheses based on previous literature and these findings.
One potential mechanism for this interaction is that adrenodoxin has an influence on the spin state of the CYP11Bs. One limitation of all P450 absorbance spectroscopy studies is that the signal from the Soret peak relies on a spin-state change. However, some verified P450 substrates can bind in the active site without displacing the Fe-coordinated water molecule and thus without causing any spectral shift.26 If this occurred, then one possible mechanism is that some adrenodoxin binding could cause P450 conformational changes that reorient and/or relocate the substrate to facilitate displacement of the water molecule. This idea would explain why the change in absorbance upon substrate binding increases with increasing adrenodoxin (Fig. 2B, 3B, 4B, and 5B). From the stopped-flow spectral shift data (Fig. S2, ESI†), fusing CYP11B1 to adrenodoxin causes a much more significant conversion from low to high spin.
A second potential mechanism for the allosteric effect is that adrenodoxin could act similarly to putidaredoxin with P450cam from Pseudomonas putida. Pochapsky et al. determined that putidaredoxin binding to P450cam induces a trans to cis isomerization of a proline in the B′ helix, thus causing distortions in the I helix and influencing the shape of the active site cavity.27 Several studies demonstrate that putidaredoxin binding to substrate bound P450cam shifts the equilibrium towards a more open enzyme conformation and low-spin state.28–30 Poulos et al. connects these two ideas, suggesting that the conformational change is mediated by the proline isomerization, causing the B’ helix to contact the F and G helices and the enzyme to adopt a more open conformation.31 There is a conserved proline in the B’ helix for both CYP11B proteins that could be involved in this allosteric response (Pro92), but there is no structural evidence for this conformational change as of yet. Two P450 structures complexed with adrenodoxin are available,10,18 and while neither of them display these conformational changes, this might be due to the static nature of crystallographic structures and is not evidence against this allosteric response. Additionally, one difference between the CYP11B proteins and P450cam is that adrenodoxin shifts the substrate-bound CYP11B equilibrium towards the high-spin state while putidaredoxin shifts camphor-bound P450cam towards the low-spin state.29 These differences illustrate the diversity in P450/redox partner interactions and identify a need for more detailed studies with human P450s similar to those completed undertaken for bacterial species.
Conclusions
CYP11B1 and CYP11B2 are responsible for producing the major human corticosteroids cortisol and aldosterone respectively. Both are drug targets and their high shared sequence identity has hindered development of selective drugs. Here, we characterized the interactions of both CYP11B enzymes with their shared redox partner adrenodoxin using transient-state kinetics. In both enzymes, adrenodoxin increased CYP11B substrate binding by both increasing the on rate constant and simultaneously decreasing the off rate constant.While the information presented here illuminates the next level of information on how adrenodoxin allosterically modulates CYP11B enzymes, much remains to be learned about this interaction. Thus far, all experiments have been performed with oxidized adrenodoxin and the influence of the redox state on this effect should also be investigated.
The current studies additionally revealed that CYP11B1 and CYP11B2 possess different substrate binding mechanisms. While CYP11B1 binds substrates in a single step, CYP11B2 does so in a multi-step fashion. While the substrate-swapping experiment clearly demonstrated that the origins of this effect are related to the enzyme and not the substrate, it remains to be determined if CYP11B2 binds substrates via conformational selection, induced fit, or some more complex mechanism. However, given the very small compositional differences between the two CYP11B enzymes and their importance as drug targets, understanding this difference could potentially be exploited in future drug design.
Experimental procedures
Materials
11-Deoxycortisol (152-58-9) and 11-deoxycorticosterone (64-85-7) were obtained from Sigma-Aldrich (St. Louis, MO).Protein expression and purification
Stopped-flow determination of substrate binding rates
Substrate binding rates for CYP11B1 and CYP11B2 were measured using a High-Tech SF61DX2 stopped-flow spectrophotometer equipped with a temperature-controlled circulating water bath. The dead time of the instrument is 1 ms.In the initial spectra, the Soret peak was for substrate-free P450 centered at 419 nm, consistent with the low-spin water coordinated form and over the course of the reaction the peak at 419 nm decreased in intensity and a peak at 391 nm formed, consistent with formation of the substrate-bound form. To measure substrate binding rates, the difference in absorbance between 391 nm and 419 nm was calculated at each point in time. This delta absorbance at the first recorded point (2–7 ms) was set to zero and used to scale the rest of the data.
For each enzyme/substrate combination, the difference in absorbance between 391 and 419 nm over time was fit to both one and two phase association equation in GraphPad Prism and the best fit (highest R2 values) was selected for analysis. For each CYP11B1 experiment, the one-phase equation was sufficient to fit the data (Fig. S2 and S3, ESI†). The average R2 was 0.980 and the range 0.82–0.99. For each CYP11B2 experiment, the two-phase equation was a much better representation of the data (Fig. S4 and S5, ESI†). The R2 values for fitting to a single exponential were an average of 0.962 (range 0.90–0.98), while the R2 values for fitting to the double exponential were improved to an average of 0.995 (range 0.97–0.99). For both CYP11B1 and CYP11B2 experiments with the lowest substrate concentration without adrenodoxin have lower signal/noise than any of the other experiments and this, rather than systematic errors in the fit, results in the lower R2 values for both ranges. These fits determined the kobs values at each substrate concentration, with CYP11B2 yielding two rate constants (kfast and kslow). These kobs values were plotted against substrate concentration for each cytochrome P450 with 0, 1, 10, and 40-fold excess adrenodoxin. This data was fit to a linear equation to determine the impact of adrenodoxin on the kon (slope) and koff (y-intercept) values.
Stopped-flow determination of off rates
The tight binding inhibitor LCI699 was used to trap the substrate-free enzyme and thus directly measure substrate koff values. Initial experiments were designed to determine if LCI699 binding was at least an order of magnitude faster than substrate release. Solutions of 4 μM CYP11B1 or CYP11B2 were prepared in binding buffer (50 mM potassium phosphate, pH 7.4, 20% glycerol, 0.5% CHAPS) were mixed with 100 μM LCI699 and spectra recorded. A mixture of 3 and 5 second time courses were collected on a logarithmic timescale with a minimum of 3 replicates per condition. For each enzyme, Δ424–420 nm was calculated and plotted against time. The CYP11B1 data was fit to the one-phase association equation and the CYP11B2 data was fit to the two-phase association equation in GraphPad Prism. LCI699 binding to both CYP11B enzymes was extremely fast, nearly occurring in the dead time of the instrument for CYP11B1. The resulting kobs for LCI699 binding is well over 10× faster than the substrate koff estimated from the experiments above, making it a suitable trapping agent for both enzymes.Next, LCI699 trapping of the substrate-free enzymes was used to determine CYP11B substrate off rates. For each CYP11B enzyme, off rates were determined with the substrates 11-deoxycortisol and 11-deoxycorticosterone and with varying amounts of 0, 1, 10, or 40-fold excess adrenodoxin. Solutions containing 2 μM CYP11B, 70 μM (a saturating concentration) of 11-deoxycortisol or 11-deoxycorticosterone, and either 0, 1, 10, or 40 μM adrenodoxin were prepared in binding buffer (50 mM potassium phosphate, pH 7.4, 20% glycerol, 0.5% CHAPS). The CYP11B/substrate/adrenodoxin syringe was mixed with a solution of 100 μM LCI699 in the same buffer. A mixture of 3, 5, and 15 second shots were taken on a logarithmic scale with a minimum of 3 replicates per condition. For each condition, Δ424–390 nm was calculated and the delta absorbance changes fit to the one phase (CYP11B1) or two phase (CYP11B2) association equation in GraphPad Prism. Because the rate of LCI699 binding is limited by the substrate off rate, the LCI699 kobs value can be approximated as the substrate koff.
Author contributions
CL: conceptualization, methodology, investigation, formal analysis, validation, visualization, writing – original draft, writing – review and editing. S-CI: methodology; investigation, validation, resources, writing – review and editing. EES: conceptualization, funding acquisition, project administration, supervision, writing – original draft, writing – review and editing.Data availability
The data supporting this article have been included as part of the ESI.†Conflicts of interest
The authors declare that they have no conflicts of interest with the contents of this article.Acknowledgements
The construct for expression of human adrenodoxin was a gift from Dr Richard Auchus at the University of Michigan. The authors additionally acknowledge Dr Richard Auchus for use of his stopped-flow instrument. This research was supported by the National Institutes of Health R37 GM076343 (to EES) and F31 HD111338 (to CL). Sang-Choul's participation and the stopped-flow instrumentation were supported by R01-GM086596 and a Veteran's Administration Merit Review Grant.References
- R. Bernhardt, The potential of targeting CYP11B, Expert Opin. Ther. Targets, 2016, 20(8), 923–934 CrossRef PubMed.
- M. C. Zennaro, S. Boulkroun and F. L. Fernandes-Rosa, Pathogenesis and treatment of primary aldosteronism, Nat. Rev. Endocrinol., 2020, 16(10), 578–589 CrossRef CAS PubMed.
- A. Buliman, L. G. Tataranu, D. L. Paun, A. Mirica and C. Dumitrache, Cushing's disease: a multidisciplinary overview of the clinical features, diagnosis, and treatment, J. Med. Life, 2016, 9(1), 12–18 CAS.
- S. Brixius-Anderko and E. E. Scott, Aldosterone Synthase Structure With Cushing Disease Drug LCI699 Highlights Avenues for Selective CYP11B Drug Design, Hypertension, 2021, 78(3), 751–759 CrossRef CAS PubMed.
- J. Valentín-Goyco, J. Liu, H. M. Peng, J. Oommen and R. J. Auchus, Selectivity of Osilodrostat as an Inhibitor of Human Steroidogenic Cytochromes P450, J. Steroid Biochem. Mol. Biol., 2023, 106316 CrossRef PubMed.
- C. L. Loomis, S. Brixius-Anderko and E. E. Scott, Redox partner adrenodoxin alters cytochrome P450 11B1 ligand binding and inhibition, J. Inorg. Biochem., 2022, 235, 111934 CrossRef CAS PubMed.
- D. F. Estrada, The cytochrome P450 24A1 interaction with adrenodoxin relies on multiple recognition sites that vary among species. The, J. Biol. Chem., 2018, 293(11), 4167–4179 CrossRef CAS PubMed.
- A. Kumar and D. F. Estrada, Specificity of the Redox Complex between Cytochrome P450 24A1 and Adrenodoxin Relies on Carbon-25 Hydroxylation of Vitamin-D Substrate, Drug Metab. Dispos., 2019, 47(9), 974–982 CrossRef CAS PubMed.
- A. Kumar, P. R. Wilderman, C. J. Tu, S. C. Shen, J. Qu and D. F. Estrada, Evidence of Allosteric Coupling between Substrate Binding and Adx Recognition in the Vitamin D Carbon-24 Hydroxylase CYP24A1, Biochemistry, 2020, 59(15), 1537–1548 CrossRef CAS PubMed.
- S. Brixius-Anderko and E. E. Scott, Structural and functional insights into aldosterone synthase interaction with its redox partner protein adrenodoxin, J. Biol. Chem., 2021, 100794 CrossRef CAS PubMed.
- S. M. Glass, S. N. Webb and F. P. Guengerich, Binding of cytochrome P450 27C1, a retinoid desaturase, to its accessory protein adrenodoxin, Arch. Biochem. Biophys., 2021, 714, 109076 CrossRef CAS PubMed.
- E. O. Yablokov, T. A. Sushko, L. A. Kaluzhskiy, A. A. Kavaleuski, Y. V. Mezentsev and P. V. Ershov, et al., Substrate-induced modulation of protein-protein interactions within human mitochondrial cytochrome P450-dependent system, J. Steroid Biochem. Mol. Biol., 2020, 105793 Search PubMed.
- S. A. Child, M. J. Reddish, S. M. Glass, M. H. Goldfarb, I. R. Barckhausen and F. P. Guengerich, Functional interactions of adrenodoxin with several human mitochondrial cytochrome P450 enzymes, Arch. Biochem. Biophys., 2020, 694, 108596 CrossRef CAS PubMed.
- J. D. Lambeth and S. Kriengsiri, Cytochrome P-450scc-adrenodoxin interactions. Ionic effects on binding, and regulation of cytochrome reduction by bound steroid substrates, J. Biol. Chem., 1985, 260(15), 8810–8816 CrossRef CAS.
- Q. Zhu, P. J. Mak, R. C. Tuckey and J. R. Kincaid, Active Site Structures of CYP11A1 in the Presence of Its Physiological Substrates and Alterations upon Binding of Adrenodoxin, Biochemistry, 2017, 56(43), 5786–5797 CrossRef CAS PubMed.
- K. M. Curnow, M. T. Tusie-Luna, L. Pascoe, R. Natarajan, J. L. Gu and J. L. Nadler, et al., The product of the CYP11B2 gene is required for aldosterone biosynthesis in the human adrenal cortex, Mol. Endocrinol., 1991, 5(10), 1513–1522 CrossRef CAS PubMed.
- C. Duparc, P. Camponova, M. Roy, H. Lefebvre and M. Thomas, Ectopic localization of CYP11B1 and CYP11B2-expressing cells in the normal human adrenal gland, PLoS One, 2022, 17(12), e0279682 CrossRef PubMed.
- N. Strushkevich, F. MacKenzie, T. Cherkesova, I. Grabovec, S. Usanov and H. W. Park, Structural basis for pregnenolone biosynthesis by the mitochondrial monooxygenase system, Proc. Natl. Acad. Sci. U. S. A., 2011, 108(25), 10139–10143 CrossRef CAS PubMed.
- N. Strushkevich, A. A. Gilep, L. Shen, C. H. Arrowsmith, A. M. Edwards and S. A. Usanov, et al., Structural insights into aldosterone synthase substrate specificity and targeted inhibition, Mol. Endocrinol., 2013, 27(2), 315–324 CrossRef CAS PubMed.
- P. Hlavica, Key regulators in the architecture of substrate access/egress channels in mammalian cytochromes P450 governing flexibility in substrate oxyfunctionalization, J. Inorg. Biochem., 2023, 241, 112150 CrossRef CAS PubMed.
- S. Brixius-Anderko and E. E. Scott, Structure of human cortisol-producing cytochrome P450 11B1 bound to the breast cancer drug fadrozole provides insights for drug design. The, J. Biol. Chem., 2019, 294(2), 453–460 CrossRef CAS PubMed.
- F. P. Guengerich, C. J. Wilkey, S. M. Glass and M. J. Reddish, Conformational selection dominates binding of steroids to human cytochrome P450 17A1. The, J. Biol. Chem., 2019, 294(26), 10028–10041 CrossRef PubMed.
- F. P. Guengerich, C. J. Wilkey and T. T. N. Phan, Human cytochrome P450 enzymes bind drugs and other substrates mainly through conformational-selection modes. The, J. Biol. Chem., 2019, 294(28), 10928–10941 CrossRef PubMed.
- F. Zarate-Perez and J. C. Hackett, Conformational selection is present in ligand binding to cytochrome P450 19A1 lipoprotein nanodiscs, J. Inorg. Biochem., 2020, 209, 111120 CrossRef CAS PubMed.
- D. F. Estrada, A. L. Skinner, J. S. Laurence and E. E. Scott, Human Cytochrome P450 17A1 Conformational Selection. The, J. Biol. Chem., 2014, 289(20), 14310–14320 CrossRef CAS PubMed.
- W. R. Arnold, J. L. Baylon, E. Tajkhorshid and A. Das, Asymmetric Binding and Metabolism of Polyunsaturated Fatty Acids (PUFAs) by CYP2J2 Epoxygenase, Biochemistry, 2016, 55(50), 6969–6980 CrossRef PubMed.
- B. OuYang, S. S. Pochapsky, M. Dang and T. C. Pochapsky, A Functional Proline Switch in Cytochrome P450cam, Structure, 2008, 16(6), 916–923 CrossRef PubMed.
- A. H. Follmer, S. Tripathi and T. L. Poulos, Ligand and Redox Partner Binding Generates a New Conformational State in Cytochrome P450cam (CYP101A1), J. Am. Chem. Soc., 2019, 141(6), 2678–2683 CrossRef PubMed.
- M. Unno, J. F. Christian, D. E. Benson, N. C. Gerber, S. G. Sligar and P. M. Champion, Resonance Raman Investigations of Cytochrome P450cam Complexed with Putidaredoxin, J. Am. Chem. Soc., 1997, 119(28), 6614–6620 CrossRef.
- W. K. Myers, Y. T. Lee, R. D. Britt and D. B. Goodin, The conformation of P450cam in complex with putidaredoxin is dependent on oxidation state, J. Am. Chem. Soc., 2013, 135(32), 11732–11735 CrossRef CAS PubMed.
- T. L. Poulos and A. H. Follmer, Updating the Paradigm: Redox Partner Binding and Conformational Dynamics in Cytochromes P450, Acc. Chem. Res., 2022, 55(3), 373–380 CrossRef CAS PubMed.
Footnote |
| † Electronic supplementary information (ESI) available. See DOI: https://doi.org/10.1039/d4cb00015c |
| This journal is © The Royal Society of Chemistry 2024 |