 Open Access Article
Enhancement of tryptophan 2-monooxygenase thermostability by semi-rational enzyme engineering: a strategic design to minimize experimental investigation†
Sirus
Kongjaroon
 a,
Narin
Lawan
 b,
Duangthip
Trisrivirat
 a and
Pimchai
Chaiyen
 *a
*a
aSchool of Biomolecular Science and Engineering, Vidyasirimedhi Institute of Science and Technology (VISTEC), Wangchan Valley, Rayong, 21210, Thailand. E-mail: pimchai.chaiyen@vistec.ac.th
bDepartment of Chemistry, Faculty of Science, Chiang Mai University, Chiang Mai, 50200, Thailand
First published on 27th July 2024
Abstract
Tryptophan 2-monooxygenase (TMO) is an FAD-bound flavoenzyme which catalyzes the oxidative decarboxylation of L-tryptophan to produce indole-3-acetamide (IAM) and carbon dioxide. The reaction of TMO is the first step of indole-3-acetic acid (IAA) biosynthesis. Although TMO is of interest for mechanistic studies and synthetic biology applications, the enzyme has low thermostability and soluble expression yield. Herein, we employed a combined approach of rational design using computational tools with site-saturation mutagenesis to screen for TMO variants with significantly improved thermostability properties and soluble protein expression. The engineered TMO variants, TMO-PWS and TMO-PWSNR, possess melting temperatures (Tm) of 65 °C, 17 °C higher than that of the wild-type enzyme (TMO-WT). At 50 °C, the stabilities (t1/2) of TMO-PWS and TMO-PWSNR were 85-fold and 92.4-fold higher, while their soluble expression yields were 1.4-fold and 2.1-fold greater than TMO-WT, respectively. Remarkably, the kinetic parameters of these variants were similar to those of the wild-type enzymes, illustrating that they are promising candidates for future studies. Molecular dynamic simulations of the wild-type and thermostable TMO variants identified key interactions for enhancing these improvements in the biophysical properties of the TMO variants. The introduced mutations contributed to hydrogen bond formation and an increase in the regional hydrophobicity, thereby, strengthening the TMO structure.
Introduction
Tryptophan 2-monooxygenase (TMO) is an FAD-bound flavoenzyme which catalyzes the oxidative decarboxylation of L-tryptophan using molecular oxygen as a co-substrate to produce indole-3-acetamide (IAM) and carbon dioxide in the first step of the indole-3-acetic acid (IAA) biosynthesis pathway. IAM is subsequently converted into IAA, the most common plant stimulant or phytohormone in the class of auxin,1 by an amide hydrolase encoded by the iaaH gene (Scheme 1). TMO is typically found in plant-associated bacteria such as Pseudomonas savastanoi. Due to its potential applications in promoting plant growth, the IAA production pathway via IAM has been extensively studied in various microbes. Recently, a metabolically engineered Escherichia coli producing IAA via the TMO reaction was reported.2 Due to its ability to use other aromatic amino acids, TMO has also been used to create a synthetic pathway to produce phenylacetamide in the engineered E. coli.3 The CRISPR-Cas dynamic modulation system was employed as a pathway-controlling module of the IAM pathway.4 TMO's applications in amperometric biosensors for L-tryptophan detection have also been explored.5The overall catalytic reaction of TMO is similar to those of flavoenzyme oxidases in which the first half-reaction is a reductive half-reaction where a substrate is oxidized by an enzyme-bound FAD to form an imino acid intermediate, followed by the second half-reaction which is oxidation of the reduced FAD to generate H2O2 which subsequently reacts with the imino acid to form IAM. Although the kinetics and crystal structures of wild-type TMO and several variants have been reported,6–13 a full understanding of the TMO mechanisms regarding the intriguing oxygen insertion to generate IAM at the oxidative half-reaction remains elusive.14 For previous site-directed mutagenesis studies, none of the variants have shown improvement in enzyme stability; only the variant generating a keto acid instead of an amide product was obtained.12 Based on our own experience, we found that the amount of soluble TMO overexpressed in E. coli was low and the enzyme was not very stable at ambient temperature.15 This has obstructed a thorough mechanistic investigation or enzyme engineering campaign of TMO for further investigation.
Therefore, we proposed to overcome this hurdle by obtaining TMO variants which are more thermostable and overexpress better than the wild-type enzyme while still maintaining effective catalytic efficiency for IAM production. Such stable variants can serve as a well-built template for future mechanistic investigations and facilitate additional engineering efforts toward obtaining TMOs suitable for future applications.
Engineering of target enzymes to improve their thermostability can be done using the combined approaches of computational prediction, mechanism-guided, and random mutagenesis.16–19 Semi-rational enzyme engineering is advantageous for creating a small-size library that contains a high chance of success in obtaining the desired enzymes.20 Several computational tools for predicting probable variants are available. The FireProt web server is a comprehensive protein predictor that can be used to propose single- or multiple-point mutations to create thermostable protein variants.21,22 B-FITTER software can be used to analyze B-factor values of individual residues and probe the high flexibility region of the protein structure.23,24 Disulfide by Design 2.0 (DbD) can be used to calculate probable regions for introducing disulfide pairs to strengthen the protein structures.25 Protein Repair One-Stop Shop (PROSS) is another comprehensive protein predictor focusing on improving protein stability and solubility.26 By applying these tools with mechanistic understanding and knowledge of regions to be avoided or focused, we have successfully obtained variants of flavin-dependent enzymes with improved thermostability.27–29
Apart from focusing on protein stability, we were also interested in improving the yield of soluble TMO. Several studies have reported obstacles in the production of soluble L-amino acid oxidases (LAAOs)30 including TMO in E. coli systems. Typically, TMO is overexpressed in a low amount using a conventional expression system.7 Recently, it has been reported that recombinant expression of the TMO native sequence resulted in insoluble protein, and a SUMO soluble protein tag was required for soluble TMO expression.2 In our case, we found that the co-expression of a pGro7 chaperone vector was required to facilitate soluble TMO folding.15 Here, we proposed that the semi-engineering approach can be used to improve TMO solubility and thermostability in the same engineering campaign.
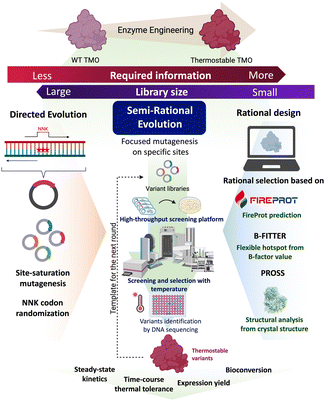
In this work, TMO from P. savastanoi was engineered to improve its thermostability and soluble expression yield using a semi-rational enzyme engineering approach. The overall rationale used for selecting candidate residues for mutation was based on structural analysis and computational predictions by FireProt, DbD, PROSS, and B-FITTER software. DbD was used to predict the positions for the incorporation of disulfide bridges through site-directed mutagenesis. FireProt, B-FITTER and PROSS were used to predict the hotspot regions for site-saturation mutagenesis to obtain variants of 20 amino acids at each position. Libraries were screened for variants with improved thermostability compared to the wild-type enzyme. Beneficial single-site and double-site mutations were later combined to obtain the TMO-PWS and TMO-PWSNR variants which have a maximum Tm value of 65 °C. The variants were further tested for time-course thermal tolerance, steady-state kinetics, and their soluble expression yield. Finally, they were tested for their ability to produce IAM in bioconversion experiments. Molecular dynamics (MD) simulations were also carried out to elucidate the effects of the mutations. The overall workflow of our approach is summarized in Fig. 1. This work is the first to report TMO variants with significant improvement in thermostability and expression yield while maintaining comparable catalytic properties as the wild-type enzyme.
Results and discussion
Computation prediction and rational selection of candidate residues for improving the thermostability of TMO
Several tools are available for predicting mutations to increase protein thermostability, but we chose FireProt, B-FITTER, DbD, and PROSS software for analyzing candidate residues due to the availability and comprehensiveness in analysis. The crystal structure of TMO (PDB: 4IV9) was submitted independently to each website server of FireProt, B-FITTER, DbD, and PROSS to identify hotspot residues for mutagenesis. Although the TMO structure reported is a homodimer, the analyses were done with separate peptide chains since TMO is reported to function in a monomeric form9 and to fit with the software requirements.| No. | Positions | FireProt candidates | B-FITTER | PROSS | Structural analysis | |
|---|---|---|---|---|---|---|
| Energy | Evolutionary | |||||
| The results from each tool were compared and selected for site-saturation mutagenesis. Note that each tool suggested different final mutations. We only selected the residue positions and performed site-saturation mutagenesis without performing site-directed mutagenesis suggested by the software. | ||||||
| 1 | M25 | ✓ | ✓ | |||
| 2 | S33 | ✓ | ✓ | ✓ | ✓ | |
| 3 | T36 | ✓ | ||||
| 4 | T38 | ✓ | ✓ | |||
| 5 | Q85 | ✓ | ✓ | ✓ | ✓ | |
| 6 | A191 | ✓ | ||||
| 7 | G196 | ✓ | ||||
| 8 | C204 | ✓ | ✓ | ✓ | ||
| 9 | A290 | ✓ | ||||
| 10 | S304 | ✓ | ||||
| 11 | A307 | ✓ | ✓ | ✓ | ✓ | |
| 12 | N331 | ✓ | ✓ | ✓ | ||
| 13 | K377 | ✓ | ||||
| 14 | T382 | ✓ | ||||
| 15 | Q385 | ✓ | ||||
| 16 | A424 | ✓ | ||||
| 17 | T430 | ✓ | ✓ | |||
| 18 | A473 | ✓ | ✓ | ✓ | ✓ | |
| 19 | Q488 | ✓ | ||||
| 20 | T496 | ✓ | ✓ | |||
| 21 | S499 | ✓ | ✓ | |||
| 22 | S530 | ✓ | ✓ | ✓ | ||
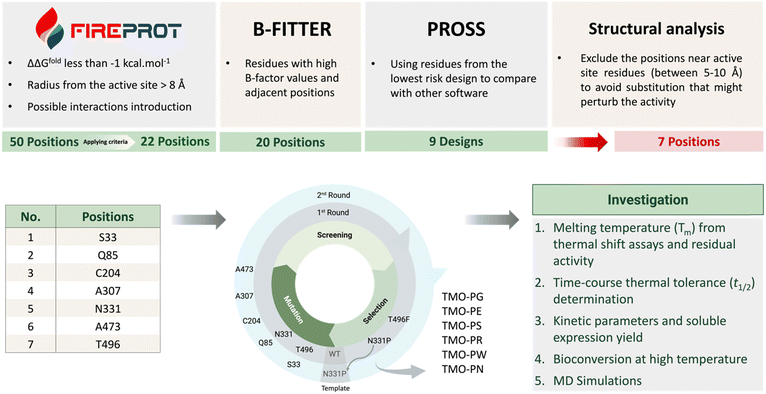
FireProt is a comprehensive web server tool which can be used to predict thermostable variants based on energy calculations and evolutionary analysis.21,22 The FireProt web-based software can be accessed viahttps://loschmidt.chemi.muni.cz/fireprotweb/. The PDB file structure of TMO was submitted to FireProt for the prediction of TMO thermostable variants using the default settings. The software provided 50 suggested variants for mutation including 26 energy variants and 31 evolution variants. Some variants were classified as both types and, thus, there were 50 predicted variants in total. We selected and ranked the candidates based on the following criteria. The positions located within 8 Å from the active site were excluded to avoid interference with TMO catalysis. We selected only the variants with mutations at positions which resulted in differences in the folding free energy relative to the wild-type enzyme (ΔΔGfold) as calculated by both FoldX and/or Rosetta of less than −1 kcal mol−1. Among the 50 suggested candidates, 22 candidates were selected for further analysis. The selected candidates and all of the variants predicted from the FireProt analysis are shown in Table S1 (ESI†).
B-FITTER software which can be downloaded from the website (https://www.kofo.mpg.de/en/research/biocatalysis) provides identification of residues with high B-factor values. B-factor or temperature factor reflects the diffusion of the atomic electron density of crystal structures. The high B-factor value region (high diffusion of atomic electron density) reflects the high flexibility. We thus used the B-FITTER software to rank the top 20 highest B-factor value residues from the whole protein structure. These high B-factor value residues are targets for performing mutations to strengthen the region. The mutations could be iterative to create the most thermostable variant.24 We analyzed the TMO PDB structure using B-FITTER to obtain the analysis as shown in Table S2 (ESI†) in which most of the residues are located on the protein surface. The predicted positions and their adjacent positions (±1 residues from the predicted residue) with high B-factor values were selected to be compared with the results from FireProt and PROSS for final selection.
PROSS is also a comprehensive tool for predicting mutations to increase protein stability and solubility.26,31,32 The PROSS online website can be accessed through https://pross.weizmann.ac.il/step/pross-terms/. After the TMO structure was submitted to the PROSS website, we obtained the suggested designs containing different numbers of mutations as listed from Design 1 to Design 9 (Fig. S1, ESI†). Design 9 comprises the largest number of mutations and was suggested to be avoided by the website. In this work, the suggested positions from Design 1 (containing the lowest number of mutations present in every design) were selected to be compared with the results from FireProt and B-FITTER for the final selection.
According to Fig. 2, the candidate residues predicted by FireProt (22 positions), B-FITTER (20 positions), and PROSS (9 designs), which passed our selection criteria, were compared, and analyzed for their structural interactions. For residues from B-FITTER analysis, the adjacent residues (±1 residues from the predicted residues) were also included in the consideration. We manually inspected target candidates to determine whether they could promote additional interactions with nearby residues without perturbing the TMO active site and the overall folding. We also favored the residues located near areas on the surface to possibly improve protein expression upon performing site-saturation mutagenesis.
The residues, including S33, Q85, C204, A307, N331, and A473, predicted in common by more than one tool, were subjected to site-saturation mutagenesis for further screening. We also selected the T496 position which was suggested only by FireProt but it was favored by structural analysis because it has potential to promote local aromatic interactions. The list of selected positions is shown in Table 1 and Fig. 2.
The selected variants were successfully constructed, verified by sequence analysis, and overexpressed using the same methods as for the wild-type enzyme as described in the experimental procedures section. However, it was found that all of the DbD variants were insoluble upon overexpression, as observed by a large protein band at 67 kDa upon SDS-PAGE analysis in the lane corresponding to the pellet samples (Table 2 and Fig. S2, ESI†). Moreover, the cell pellet of the DbD variants did not show any yellow color, unlike the overexpressed wild-type TMO cell pellet which shows a distinctive yellow color commonly found in many cells overexpressing FAD-bound proteins. Therefore, only the approaches described in the previous section and Fig. 2 were further used to improve the TMO stability.
| No. | Variant | ∑B-factor | Bond energy (kcal mol−1) | Folding |
|---|---|---|---|---|
| The table shows the selected variants with bond energy and ∑B-factor values. All of the variants resulted in insoluble proteins. | ||||
| 1 | L166C/H218C | 39.33 | 4.63 | Insoluble |
| 2 | R299C/E315C | 51.43 | 7.61 | Insoluble |
| 3 | D342C/A441C | 45.49 | 1.7 | Insoluble |
Identification of thermostable variants from high-throughput screening
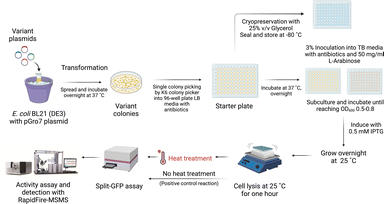
After the single point variant libraries were generated, the libraries were transformed into E. coli BL21 (DE3) for the screening process. Single colonies were inoculated into 200 μL LB culture medium in 96-well plates. TMO overexpression was induced in the culture, followed by lysis to obtain the expressed TMO variant in the supernatant solution. The screening method was based on IAM product analysis. The TMO variant samples without heat treatment were used to set up a positive control reaction with 500 μM L-tryptophan to compare with the same enzyme samples which had been incubated at different temperatures (heat-treated enzymes) for an hour. The reaction samples were quenched with 1 M HCl after the reactions started and analyzed by the RapidFire 365 mass spectrometry system. The split-GFP assay was used for activity normalization. Because different TMO variants might be expressed at different soluble levels, TMO variant activities detected in the 96-well plate were thus divided by the levels of GFP (linked to TMO) overexpressed in the same well to identify candidates based on their remaining activities.33,34 The N-terminus of TMO was attached to the linker sequence and the GFP11 small domain. To detect GFP signals, a lysate sample under both positive control and heat treatment conditions was mixed with a solution of the GFP1-10 domain in 100 mM Tris–HCl and 100 mM NaCl and 10% glycerol, pH 7.4 buffer (TNG buffer) and further incubated overnight at 4 °C. The incubation allows the binding of the GFP1-10 domain to the GFP11 domain linked to TMO. The GFP signals measured by fluorescent readouts with the excitation wavelength at 488 nm and the emission wavelength at 530 nm were directly correlated with the amount of soluble TMO overexpressed. The overall procedure is demonstrated in Fig. 3.For the first round of screening, we selected the first group of candidate positions with high negative values based on FoldX energy calculations. Therefore, the site-saturation mutagenesis was carried out at the T496 and N331 residues independently using the TMO-WT as a template. The variant samples were incubated at 50 °C for one hour before being tested in the reaction setting as described above. The T496F (TMO-F) and N331P (TMO-P) variants were identified from the screening results as promising candidates. These variants were purified and investigated by thermal shift assays for Tm values in comparison to the Tm of TMO-WT of 48 °C. The TMO-F variant showed a slight improvement in the Tm with a one-degree Celsius increase; however, the Tm of TMO-P was increased by approximately 7 °C. Therefore, the TMO-P variant was used as a template for the second round of evolution at other positions.
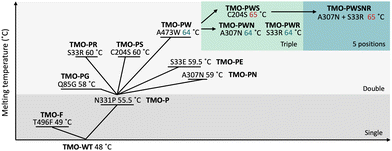
For the second round of screening, positions 33, 85, 204, 307, and 473 were subjected to site-saturation mutagenesis in independent libraries. The libraries containing double mutations (N331P and another mutation from this round) were expected to have higher thermostability than the template. Thus, the incubation temperature for this round was increased to 55 °C for an hour. Some examples of screening data are shown in Fig. S3 (ESI†). From the last round of the screening, five variants which were N331P/S33E (TMO-PE), N331P/S33R (TMO-PR), N331P/Q85G (TMO-PG), N331P/C204S (TMO-PS), N331P/A307N (TMO-PN), and N331P/A473W (TMO-PW) were identified. The mutations S33E (TMO-PE) and Q85G (TMO-PG) were excluded from the further characterizations since the TMO-PE and TMO-PG variants showed less improvement in Tm as compared to the S33R mutation, and the Q85G mutation showed lower enzyme activities than that of the wild-type enzyme (Fig. S4, ESI†). Based on Tm values, S33R, C204S, A307N, and A473W were identified as beneficial mutations to increase TMO stability. Thus, we combined these mutations to create variants with triple mutations (TMO-PWS, TMO-PWR, and TMO-PWN) by site-directed mutagenesis. We also created the combined variant with all five positions mutated (TMO-PWSNR) which was expected to improve the thermostability of the enzyme further. The summary of improvement in Tm values for all of the variants is shown in Fig. 4.
The addition of the third mutation using the TMO-PW variant as the template resulted in equal values of Tm for the TMO-PWN and TMO-PWR variants, whereas the TMO-PWS exhibited a slight improvement, showing a Tm of 65 °C. The TMO-PWSNR variant also showed a Tm value of 65 °C, similar to the TMO-PWS variant. Altogether, the data suggests that the addition of another mutation to double mutation variants resulted in the slightly higher melting temperature while the combined variant of TMO-PWSNR showed a similar level of thermostability compared to the TMO-PWS variant, giving a Tm value of around 65 °C.
Improvement of the thermostability among TMO variants
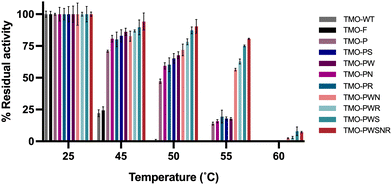
We further investigated the thermostability of all variants by measuring their residual activities after incubating them at various temperatures for one hour. The results in Fig. 5 indicate that the TMO-PWS and TMO-PWSNR variants were the most thermotolerant enzymes compared to all variants. Both variants showed more than 85% residual activity after incubation at 50 °C for one hour. The residual activities at 50 °C and Tm of different variants are shown in Table 3. Therefore, the TMO-PWS and TMO-PWSNR variants were selected for further characterizations.| No. | Variant | Mutation | T m (°C) | % Residual activity after 50 °C |
|---|---|---|---|---|
| n.d. = not determined | ||||
| 1 | TMO-WT | — | 48 | 0 |
| 2 | TMO-F | T496F | 49 | 0 |
| 3 | TMO-P | N331P | 55.5 | 47.3 ± 1.7 |
| 4 | TMO-PG | N331P/Q85G | 58 | n.d. |
| 5 | TMO-PE | N331P/Q85E | 59.5 | n.d. |
| 6 | TMO-PS | N331P/C204S | 60 | 65.2 ± 3.9 |
| 7 | TMO-PR | N331P/S33R | 60 | 60.2 ± 5.5 |
| 8 | TMO-PW | N331P/A473W | 64 | 68.0 ± 2.7 |
| 9 | TMO-PN | N331P/A307N | 59 | 59.3 ± 2.5 |
| 10 | TMO-PWN | N331P/A473W/A307N | 65 | 71.9 ± 4.6 |
| 11 | TMO-PWR | N331P/A473W/S33R | 65 | 78.3 ± 2.3 |
| 12 | TMO-PWS | N331P/A473W/C204S | 65 | 87.3 ± 2.7 |
| 13 | TMO-PWSNR | N331P/A473W/C204S/A307N/S33R | 65 | 90.4 ± 5.5 |
Characterization of thermostable TMO variants
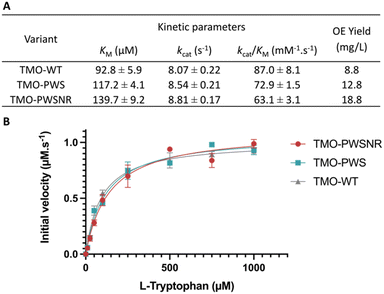
Steady-state kinetics of the thermostable TMO-PWS, TMO-PWSNR, and the TMO-WT enzymes were investigated. Steady-state kinetic parameters and Michaelis–Menten plots of all enzymes are shown in Fig. 6A and B. The KM values of the TMO-PWS and TMO-PWSNR variants were increased by approximately 1.3-fold to 1.5-fold compared to that of the TMO-WT enzyme, respectively. However, their kcat values were slightly higher than those of the TMO-WT enzyme. Altogether, the kinetics parameters of TMO-PWS and TMO-PWSNR were in the same range while their Tm values were 17 °C higher than the wild-type values, indicating that these two variants are promising candidates for future investigations or applications of TMO.Interestingly, in addition to the improvement in thermostability, the soluble overexpression yield of TMO variants determined by the amount of purified enzyme (in mg) per culture volume (in liter) was increased by approximately 2.14-fold for TMO-PWSNR and 1.46-fold for TMO-PWS relative to the wild-type TMO (Fig. 6A).
Time-course of TMO-PWS and TMO-PWSNR thermal tolerance
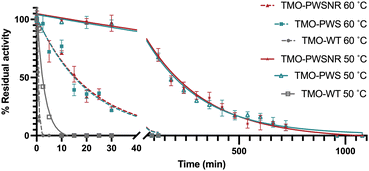
To investigate the difference in the thermotolerance between the TMO-WT, TMO-PWS, and TMO-PWSNR variants, the enzymes were tested for their thermal tolerance over a time course. Because the Tm of both variants were around 65 °C, we selected 50 °C and 60 °C as the incubation temperatures for the investigation. The enzyme variants were incubated at different temperatures for various lengths of time prior to activity measurement under the standard assay conditions at 25 °C. The residual activities of the individual enzymes were plotted versus time (Fig. 7). The data indicate that the TMO-WT, TMO-PWS, and TMO-PWSNR variants exhibited t1/2 values of 2.2 min, 183.8 min, and 199.6 min, respectively, at 50 °C, and 0.4 min, 14.2 min, and 14.7 min, respectively, at 60 °C. At 50 °C, the t1/2 of the thermostable variants was increased by 85-fold for TMO-PWS and 92.4-fold for TMO-PWSNR compared to TMO-WT. At 60 °C, the t1/2 of the thermostable variants was increased by 31-fold for TMO-PWS and 33-fold for TMO-PWSNR compared to TMO-WT. These t1/2 values agree with the results from the Tm and residual activity measurement performed at various temperatures where the TMO-PWS and TMO-PWSNR showed the best level of thermostability.Thermostable variants’ performance at high temperature
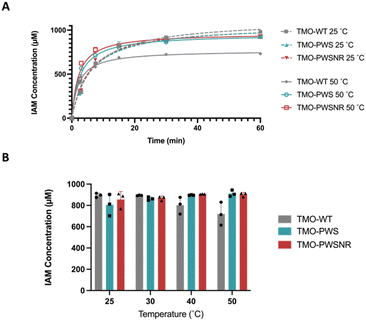
To demonstrate the performance of the thermostable variants compared with the TMO-WT, the enzyme variants were used for the bioconversion to produce the IAM in Fig. 8. Fig. 8A demonstrates the progress of IAM production compared between TMO-WT, TMO-PWS, and TMO-PWSNR variants at 25 °C and 50 °C. At 25 °C, three enzyme variants exhibited a similar trend of the IAM production, showing 100% conversion of 1 mM L-tryptophan substrate at 60 minutes. At 50 °C, the production by all enzymes was accelerated, reaching the maximum level of IAM faster than the bioconversion at 25 °C. However, the reaction of TMO-WT resulted in a lower level of IAM produced by approximately 20% because the TMO-WT was likely denatured after the reaction started for five minutes.We carried out another set of bioconversion experiments using the same conditions to compare the IAM production after 45 min at 25, 30, 40, and 50 °C. The results in Fig. 8B indicated that both TMO-PWS and TMO-PWSNR variants could maintain the ability to produce IAM well at all temperatures, while the TMO-WT showed reduced levels of IAM produced at 40 °C and 50 °C. Altogether, the results in Fig. 8 highlight the potential of TMO-PWS and TMO-PWSNR in future biotechnology applications.
MD simulations to understand the improved thermostability of TMO variants
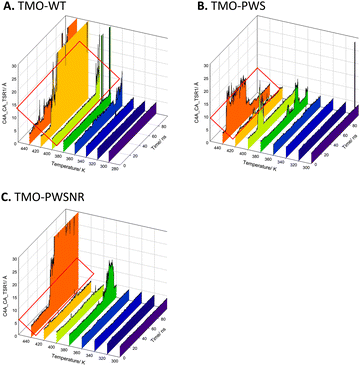
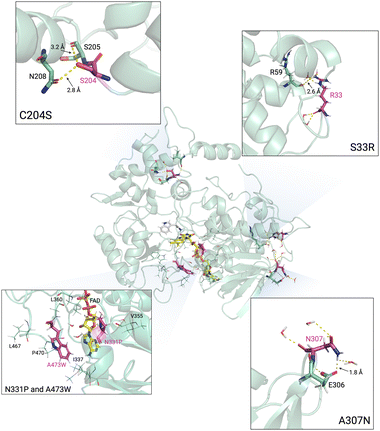
MD simulations of TMO-WT, TMO-PWS, and TMO-PWSNR were carried out to identify interactions important to enhancing the thermostability of TMO variants. Simulated structural models of TMO-WT, TMO-PWS, and TMO-PWSNR systems were prepared, minimized, and equilibrated at specified temperatures using the protocols described in the experimental procedures. MD simulations of all three enzyme systems were carried out for 100 ns. Distances between the FAD cofactor and IAM (TSR) product (C4AFAD-CATSR) at different temperatures (300–440 K) of TMO-WT, TMO-PWS and TMO-PWSNR variants were compared to indicate the fluctuation of simulated structural models (Fig. 9). The results indicated that the structural models of TMO-PWS and TMO-PWSNR variants were more rigid than that of TMO-WT. In TMO-WT, the distance between C4AFAD-CATSR showed large fluctuations starting from 400 K, while large fluctuations of TMO-PWS and TMO-PWSNR variants could be observed from 440 K. The ability of TMO-PWS and TMO-PWSNR to maintain the C4AFAD-CATSR distance and withstand high temperatures better than the TMO-WT indicates that the mutated residues facilitate stronger interactions among residues in protein structures.We further inspected specific interactions around mutated residues of TMO-PWS and TMO-PWSNR compared to TMO-WT. The results from the snapshot of the simulations after 100 ns at 400 K demonstrated that the mutated residues play a role in rigidifying the protein structural models as shown in Fig. 10. The C204S mutation introduced the hydrogen bonds from the hydroxyl group of the S204 side chain to interact with the carbonyl oxygen of the adjacent residue, S205 (3.2 Å), and the side chain of N208 (2.8 Å). The replacement of the sulfhydryl group by the hydroxyl group in C204 also resulted in stronger interactions between a polar hydrogen of the hydroxyl group and a partially negative oxygen of the side chain of N208 and the carbonyl oxygen of S205. Based on the structural model, shorter distances between the N208 side chain and the carbonyl oxygen of S205 to the oxygen atom of the S204 hydroxyl group could be observed (Fig. S6, ESI†).
The A307N mutation could possibly improve the thermostability of the enzyme by contributing to a more hydrophilic environment in the region. The mutated N307 could form a hydrogen bond with the side chain of E306 (1.8 Å), thus stabilizing the loop region where N307 is located.
The S33 position is located on the flexible loop. The S33R mutation, which possesses a longer side chain, could form a hydrogen bond with the carbonyl group of R59 (2.6 Å) located on the helix of another domain. The mutation might enhance the interactions between these two areas, possibly increasing the surface hydrophilicity, protein rigidity, and solubility.
The N331 and A473 positions are also located in the hydrophobic region. The N331P and A473W mutation could increase the hydrophobicity between local hydrophobic residues such as I337, V355, L360, L467, and P470. In addition, the A473W mutation could also introduce a bulky side chain around the entrance of the FAD binding region. The bulky side chain could minimize the access of water into the hydrophobic region, possibly strengthening the inner core hydrophobic interactions.
For the improvement in soluble protein expression, we speculate that the mutations in TMO-PWS and TMO-PWSNR may affect the overall charge of the exposed protein surface. For example, the change of interactions around the S33R and A307N mutations discussed above may play important roles in increasing the solubility of TMO, as significant improvements could be observed in the soluble yields of TMO-PWSNR as compared to TMO-PWS.
Comparison of the predicted results among the various computational tools used and the success of variants obtained from the experimental investigation
We noted that some TMO variants with successful improvement in thermostability and soluble expression were different from the predicted mutations suggested by the software. Table 4 shows the comparison between the predicted residues from FireProt, PROSS, and the variants obtained from the screening process. The N331P and A473W variants were the same variants as those predicted by the FireProt software, whereas in other positions, the predicted mutations and the best variant obtained were different.| Position | Software | Obtained mutation | |
|---|---|---|---|
| FireProt | PROSS | ||
| S33 | P | P | R |
| C204 | Y | V | S |
| A307 | S | G | N |
| N331 | P | L | P |
| A473 | W | Y | W |
It was interesting to note that the S33P variant was predicted by both FireProt and PROSS programs because the replacement of serine with a proline substitution would be expected to strengthen the flexible loop region. However, the experimental data from the screening process (Fig. 4) showed that the S33R mutation was the most thermostable one for this position. This may be due to the fact that S33R provides a longer side chain for creating interactions with residues from a different region.
For C204 and A307 positions, different amino acids were predicted between the two software programs. C204Y and C204V were suggested by FireProt and PROSS, respectively, while we obtained C204S as the most thermostable variant. Based on the analysis shown in Fig. 10, the serine residue may provide better hydrogen bond interactions with the residues, S205 and N208. We did not detect C204Y and C204V variants as thermostable enzymes. This might be due to nonproper alignment of these residues for hydrogen bond formation (Fig. S7, ESI†). For the variant A307N obtained from experimental screening, it was different from the predicted results from FireProt as A307S and PROSS as A307G. This may be due to the hydrogen bond formation between the A307N and the residue E306 (Fig. 10).
Conclusions
In this work, TMO was engineered to increase the thermostability and expression yield of soluble enzyme. Two main approaches were used including semi-rational design in combination with site-saturation mutagenesis and introduction of the disulfide pairs. The disulfide insertion strategy via Disulfide by Design 2.0 (DbD) resulted in insoluble TMO expression, whereas the semi-rational enzyme engineering approach via computational predictions, structural analysis, and library screening, resulted in two thermostable variants – TMO-PWS and TMO-PWSNR. The variants showed an increase in Tm by 17 °C as compared to TMO-WT. At 50 °C, the stabilities (t1/2) of TMO-PWS and TMO-PWSNR were 85-fold and 92.4-fold higher than TMO-WT, while their expression levels were 1.4-fold and 2.1-fold greater than TMO-WT, respectively. Steady-state kinetics analysis of the variants and TMO-WT showed similar catalytic properties. Molecular dynamic simulations illustrated that the structural models of the variants are more rigid than the wild-type enzyme, possibly resulting from additional hydrogen bonding and hydrophobic interactions with the mutated residues. Altogether, the thermostable variants possess biophysical and biochemical properties suitable for use as templates for further mechanistic studies or engineering efforts due to their distinct stability and solubility. The improved thermostability would benefit industrial applications, while the improved solubility could improve TMO applications in synthetic biology.Experimental procedures
Materials and analytical instruments
L-Tryptophan, indole-3-acetamide (IAM), and other standard chemicals were purchased from Tokyo Chemical Industry (TCI) Co. Ltd. Molecular biology reagents were from New England BioLabs® Inc. HPLC columns, the HPLC instruments, and the RapidFire 365 mass spectrometry systems were from Agilent Technologies Inc. The automated Explore G3 Integrated Workstation systems and colony picker systems were from PerkinElmer and the K6 Biosystems. The real-time PCR thermocycler was from Bio-Rad.Construction of plasmid, genes, and enzyme variants
The plasmid containing the gene encoding TMO linked with the N-terminal GFP11 linked (GFP11-TMO) was codon optimized and synthesized for E. coli BL21 (DE3) expression by the GenScript Biotech Corporation company. The GFP11-TMO fragment was subcloned into the pET15b vector at BamHI and NdeI sites to obtain the pET15b-GFP-TMO plasmid for overexpressing TMO with a 6× histidine tag. The constructed plasmids were transformed into E. coli XL1 blue for plasmid propagation and verified by DNA sequencing.Protein expression and purification of wild-type and TMO variants
The pET15b-GFP11-TMO plasmid and the pGro7 chaperone plasmid were co-transformed into E. coli BL21 (DE3) cells using a heat shock method. The transformants were selected by culturing cells on agar plates with a medium containing 50 μg mL−1 ampicillin and 20 μg mL−1 chloramphenicol. Protein expression was carried out using the auto-induction method.35 A single colony of the transformants was inoculated into 10 mL ZY starter medium containing 50 μg mL−1 ampicillin and 20 μg mL−1 chloramphenicol. The 10 mL starter culture was incubated overnight at 37 °C, 220 rpm. The starter overnight culture was inoculated (1% inoculation) into a 650 mL ZY-rich medium supplemented with the same antibiotics and 0.5 mg mL−1L-arabinose to induce expression of the GroEL-ES chaperone proteins together with TMO. The culture was incubated at 37 °C, 220 rpm until the OD600 reached 0.8–1.0. After OD600 reached 0.8–1.0, the temperature was adjusted to 25 °C. The culture was further incubated at 25 °C for 16–18 hours. The culture was then centrifuged to harvest cells at 4 °C, 8000 rpm for 15 min to obtain cell pellets. For protein purification, 200 mL of 50 mM Tris–HCl, pH 8.3 containing 10 mM imidazole, 0.1 mM PMSF, and 200 mM NaCl was added to the cell pellet for resuspension. The solution was ultrasonicated to lyse the cells. The lysate was centrifuged at 4 °C, 12![[thin space (1/6-em)]](https://www.rsc.org/images/entities/char_2009.gif) 000 rpm for 30 min. 10% polyethyleneimine (PEI) was then added to the supernatant to give a final solution of 0.1% PEI. The resulting pellet was discarded by centrifugation. The supernatant was then loaded onto a nickel-chelating affinity column (Ni-column) which was pre-equilibrated with 50 mM Tris–HCl buffer, pH 8.3 with 10 mM imidazole, and 200 mM NaCl. The protein solution for each variant was loaded onto the column, and the column was then washed with 50 mM Tris–HCl buffer, pH 8.3 plus 20 mM imidazole and 200 mM NaCl. Proteins were eluted with a 20–250 mM imidazole linear gradient solution. The fractions were analyzed by absorbance of the enzyme-bound FAD at 466 nm and of the total protein at 280 nm. Fractions judged purely by A466/A280 ratios and SDS-PAGE analysis were pooled and concentrated using a 10 kDa molecular weight cut-off Amicon stirred cell (MERCK). The concentrated purified protein sample was loaded onto a Sephadex G-25 column (GE Healthcare), which was pre-equilibrated with 50 mM Tris–HCl, pH 8.3 and 10% glycerol. The eluted purified proteins were stored at −80 °C for further use. Concentrations of wild-type and thermostable TMO variants were measured by calculations based on the absorbance at 466 nm and an extinction coefficient of the TMO-bound FAD of 11.4 mM−1 cm−1.7
000 rpm for 30 min. 10% polyethyleneimine (PEI) was then added to the supernatant to give a final solution of 0.1% PEI. The resulting pellet was discarded by centrifugation. The supernatant was then loaded onto a nickel-chelating affinity column (Ni-column) which was pre-equilibrated with 50 mM Tris–HCl buffer, pH 8.3 with 10 mM imidazole, and 200 mM NaCl. The protein solution for each variant was loaded onto the column, and the column was then washed with 50 mM Tris–HCl buffer, pH 8.3 plus 20 mM imidazole and 200 mM NaCl. Proteins were eluted with a 20–250 mM imidazole linear gradient solution. The fractions were analyzed by absorbance of the enzyme-bound FAD at 466 nm and of the total protein at 280 nm. Fractions judged purely by A466/A280 ratios and SDS-PAGE analysis were pooled and concentrated using a 10 kDa molecular weight cut-off Amicon stirred cell (MERCK). The concentrated purified protein sample was loaded onto a Sephadex G-25 column (GE Healthcare), which was pre-equilibrated with 50 mM Tris–HCl, pH 8.3 and 10% glycerol. The eluted purified proteins were stored at −80 °C for further use. Concentrations of wild-type and thermostable TMO variants were measured by calculations based on the absorbance at 466 nm and an extinction coefficient of the TMO-bound FAD of 11.4 mM−1 cm−1.7
Selection of candidate residues by computational prediction, structural analysis, and rational selection
Thermostable variants were predicted using FireProt,21,22 B-FITTER,23,36 PROSS,26 and Disulfide by Design 2.0 (DbD) software.25 The crystal structure of TMO (PDB ID: 4IV9) obtained from the Protein Data Bank (PDB) was used as an input for prediction in separate peptide chains. The hotspot residues suggested by FireProt, B-FITTER, and PROSS were compared and analyzed by structural analysis. The criteria for residue selection by each software are described in the details of the results section.Construction of TMO variants for screening
Degenerative NNK codon site-saturation mutagenesis was carried out via PCR amplification of the whole plasmid to generate a library of mutants. A pair of NNK overlapping primers on the selected residue was designed and used for the PCR reaction.34,37 The PCR product was treated with the DpnI restriction enzyme to degrade the plasmid template and was later purified using a PCR clean-up kit (Favogen) according to the manufacturer's protocol. Prior to library screening, the constructed library was transformed into E. coli BL21 (DE3) for DNA propagation and extracted using the plasmid purification kit (Favogen) for DNA sequencing. The nucleotide distribution of the constructed libraries was determined by the Qpool value. The library with Qpool ≥ 0.7 was used for further screening.34,38High-throughput screening of thermostable variants
The plasmid libraries (10 μL) from the above protocol were transformed into 100 μL of E. coli BL21 (DE3) with the pGro7 plasmid. Single colonies grown on the library agar plates were inoculated into 200 μL liquid LB medium containing 50 μg mL−1 ampicillin and 20 μg mL−1 chloramphenicol in 96-well plates using the K6 Biosystems colony picker. The Explore G3 Integrated Workstation systems were then used to operate the process of bacterial culture and protein expression. 6 μL of the overnight culture was inoculated into 194 μL of terrific broth (TB) medium containing the same antibiotics and 0.5 mg mL−1L-arabinose for expression of GroEL-GroES chaperones. The culture was grown for 12 h at 37 °C (OD600 0.5–0.8) before starting the induction by adding isopropyl β-D-1-thiogalactopyranoside (IPTG) at the final concentration of 0.5 mM. The culture was further incubated at 25 °C for another 16 h. The cell pellet of the induced culture was harvested by centrifugation and lysed with 100 μL lysis buffer containing 2 mg mL−1 lysozyme in each well. The resulting supernatant was split for positive control tests (no heat treatment) and heat treatment tests. The positive control tests involved GFP assays33,34 and activity assays in the reactions containing 500 μM L-tryptophan in 50 mM Tris–HCl, pH 8.3 buffer with 0.5 mM DTT and 1 mM EDTA. For the heat treatment test, the separated supernatant from cell lysis was incubated at the target temperatures for one hour. The precipitant was discarded by centrifugation, and the resulting supernatant was used for GFP assays and activity assays under the same conditions as the positive control tests. For Split-GFP assays, 20 μL of each enzyme sample from both positive control and heat treatment conditions was mixed with a solution of the GFP1-10 domain in 100 mM Tris–HCl and 100 mM NaCl and 10% glycerol, pH 7.4 buffer, and incubated overnight at 4 °C. All activity assays were set at 25 °C with shaking at 250 rpm for an hour and quenched by adding an equivalent volume of 1 M HCl. The samples were centrifuged at 4000 rpm, 4 °C for one hour to remove the precipitate, and the solution was filtered through a 0.22 μm nylon filter. The filtered samples were injected into a RapidFire 365 High-throughput mass spectrometry system (Agilent Technologies). The variants displaying higher than or similar activities to the wild-type or starting TMO template were defined as hit candidates. The hit candidates were further subjected to expression, purification, and thorough biochemical characterizations.Product analysis
A solution of 1 mM of L-tryptophan substrate was prepared in 50 mM Tris–HCl buffer with 0.5 mM DTT and 1 mM EDTA, pH 8.3. An enzymatic reaction assay was initiated by the addition of an enzyme to make the final concentration of 0.125 μM TMO with 1 mM L-tryptophan substrate. An equal volume of 1 M HCl was added to quench the reaction. Then, the quenched reaction was centrifuged at 12![[thin space (1/6-em)]](https://www.rsc.org/images/entities/char_2009.gif) 000 rpm, 4 °C for 30 min to remove the precipitated proteins, and the resulting solution was filtrated with a 0.22 μm Nylon filter. Then 2–10 μL of reaction sample was analyzed using a ZORBAX Eclipse Plus C18 (2.1 × 50 mm, 1.8 micron) column and HPLC (Agilent Technologies 1260 Infinity II) equipped with a diode array detector (DAD) and mass spectrometer (Agilent Technologies InfinityLab LC/MSD). Water with 0.5% formic acid (A) and acetonitrile (B) were used as the mobile phase solutions. The condition used for HPLC was as follows: the acetonitrile (B) percentage increasing from 5% to 50% within 5 min, then holding for 1 min, and increasing from 50% to 100%, and then holding for 1 min. The flow rate of the mobile phase was at 0.2 mL min−1 and kept constant throughout the analysis; the temperature at the sampler and column was controlled at 25 °C; UV absorbance was detected at 280 nm.
000 rpm, 4 °C for 30 min to remove the precipitated proteins, and the resulting solution was filtrated with a 0.22 μm Nylon filter. Then 2–10 μL of reaction sample was analyzed using a ZORBAX Eclipse Plus C18 (2.1 × 50 mm, 1.8 micron) column and HPLC (Agilent Technologies 1260 Infinity II) equipped with a diode array detector (DAD) and mass spectrometer (Agilent Technologies InfinityLab LC/MSD). Water with 0.5% formic acid (A) and acetonitrile (B) were used as the mobile phase solutions. The condition used for HPLC was as follows: the acetonitrile (B) percentage increasing from 5% to 50% within 5 min, then holding for 1 min, and increasing from 50% to 100%, and then holding for 1 min. The flow rate of the mobile phase was at 0.2 mL min−1 and kept constant throughout the analysis; the temperature at the sampler and column was controlled at 25 °C; UV absorbance was detected at 280 nm.
For product analysis during the screening process, samples were injected with a RapidFire machine equipped with triple-quadrupole mass spectrometry systems. The graphitic carbon RapidFire cartridge (Agilent Technologies) and the mobile phase solutions of water + 0.5% formic acid (A) and acetonitrile (B) were used. 100% of the aqueous mobile phase (A) was used in the loading and washing steps at the flow rate of 1.5 and 1.25 mL min−1, respectively. The elution was done with the mobile phase with an aqueous to organic mobile phase ratio (A![[thin space (1/6-em)]](https://www.rsc.org/images/entities/char_2009.gif) :
:![[thin space (1/6-em)]](https://www.rsc.org/images/entities/char_2009.gif) B) of 10
B) of 10![[thin space (1/6-em)]](https://www.rsc.org/images/entities/char_2009.gif) :
:![[thin space (1/6-em)]](https://www.rsc.org/images/entities/char_2009.gif) 90 at 0.4 mL min−1 flow rate. The multiple reaction monitoring (MRM) mode was used for the mass spectrometry detection in the positive ionization mode. The parental ion ([M + H]+), fragmentor voltage, product ion, and collision energy of L-tryptophan were 205.1, 80 V, 188.0, and 8 V, respectively. For IAM analysis, the parental ion ([M + H]+), fragmentor voltage, product ion, and collision energy were 175.1, 110 V, 130.0, and 16 V, respectively.
90 at 0.4 mL min−1 flow rate. The multiple reaction monitoring (MRM) mode was used for the mass spectrometry detection in the positive ionization mode. The parental ion ([M + H]+), fragmentor voltage, product ion, and collision energy of L-tryptophan were 205.1, 80 V, 188.0, and 8 V, respectively. For IAM analysis, the parental ion ([M + H]+), fragmentor voltage, product ion, and collision energy were 175.1, 110 V, 130.0, and 16 V, respectively.
Determination of TMO melting temperatures (Tm) using thermal shift assays
Purified TMO variants were mixed with 20× SYPRO Orange dye in 50 mM Tris–HCl, pH 8.3 buffer to make up a final concentration of 10 μM enzyme and 5× SYPRO Orange dye. The mixture was monitored using a real-time PCR machine to measure the fluorescent changes while the temperature increased. The temperature of the machine was increased from 25 °C to 95 °C with 1 °C per min increments.20,27Measuring TMO activities after heat treatment
The purified wild-type and TMO variants were incubated at different temperatures between 45 °C to 60 °C for one hour and centrifuged to discard the precipitated proteins. The protein solutions were measured for their remaining enzymatic activities using the assay reactions with 1 mM L-tryptophan previously described. The residual activities of each variant were calculated and compared to those of the wild-type TMO.Steady-state kinetics of TMO variants
The endpoint HPLC-based assay was used to determine steady-state kinetic parameters of TMO variants.2,12 The final concentration of 0.125 μM of the purified TMO variants was added to a L-tryptophan premixed substrate solution in 50 mM Tris–HCl with 0.5 mM DTT and 1 mM EDTA, pH 8.3 to start the reaction. The L-tryptophan substrate concentration was varied over a range of 0–1000 μM. The samples were quenched with an equal volume of 1 M HCl at various time points over 120 seconds, under the initial rate conditions. All samples were centrifuged at 12![[thin space (1/6-em)]](https://www.rsc.org/images/entities/char_2009.gif) 000 rpm, 4 °C for 30 min and filtered with a 0.22 μm Nylon filter. 10 μL of the sample was injected into HPLC-DAD/MS using a ZORBAX Eclipse Plus C18 (2.1 × 50 mm, 1.8 micron) column. The data was plotted with PRISM GraphPad/KaleidaGraph software.
000 rpm, 4 °C for 30 min and filtered with a 0.22 μm Nylon filter. 10 μL of the sample was injected into HPLC-DAD/MS using a ZORBAX Eclipse Plus C18 (2.1 × 50 mm, 1.8 micron) column. The data was plotted with PRISM GraphPad/KaleidaGraph software.
Bioconversion of TMO variants
Thermostable variants or wild-type TMO were added to the premix substrate solution to create a reaction with a final concentration of 1.5 μM TMO with 1 mM of L-tryptophan substrate in 50 mM Tris–HCl buffer, pH 8.3. The reactions were set at different temperatures from 25 °C to 50 °C for one hour with 250 rpm shaking. The samples were taken over one-hour intervals and analyzed using the method described in the product analysis section. For the IAM production comparison at different temperatures (results in Fig. 8B), the reactions were quenched after 45 minutes and the amount of IAM obtained from each variant and at each temperature were analyzed and compared.MD simulations
The tryptophan 2-monooxygenase (TMO) structure (PDB: 4IV9)39 was used for MD simulations. The structural models of TMO-PWS and TMO-PWSNR variants were prepared using CHARMM40 by mutating N331P, A473W, and C204S for TMO-PWS and N331P, A473W, C204S, A307N, and S33R for TMO-PWSNR. Hydrogen atoms of amino acid residues were added based on results from the PROPKA.41 The atom types in the topology files were assigned based on the CHARMM27 parameter set.42 For each system, the TMO structural model was solvated in a cubic box of transferable intermolecular potential 3P (TIP3P) water extending at least 15 Å in each direction from the solute. The dimensions of the solvated system was 97 × 109 × 121 Å. MD simulations were carried out using the NAMD program43 with simulation protocols adapted from our previous works27,34 and NAMD tutorials.44 The simulations were started by minimizing the hydrogen atom positions for 3000 steps, followed by water minimization for 6000 steps. The system water was heated to 300 K for 5 ps and then was equilibrated for 15 ps. The whole system was minimized for 10![[thin space (1/6-em)]](https://www.rsc.org/images/entities/char_2009.gif) 000 steps and heated to 300 K for 20 ps. After that, the whole system was equilibrated for 180 ps followed by the production stage for 100 ns. The MD simulations were carried out at 300–440 K to investigate temperature effects on the enzyme stability. Molecular modeling of TMO-WT, TMO-PWS, and TMO-PWSNR systems with FAD (cofactor) and IAM (product) as enzyme-bound ligands were investigated. Some distances of important residues were monitored during the MD simulations.
000 steps and heated to 300 K for 20 ps. After that, the whole system was equilibrated for 180 ps followed by the production stage for 100 ns. The MD simulations were carried out at 300–440 K to investigate temperature effects on the enzyme stability. Molecular modeling of TMO-WT, TMO-PWS, and TMO-PWSNR systems with FAD (cofactor) and IAM (product) as enzyme-bound ligands were investigated. Some distances of important residues were monitored during the MD simulations.
Author contributions
S. K. performed conceptualization, data curation, formal analysis, investigation, methodology, visualization, and writing of the original draft. N. L. performed MD simulations, data curation, formal analysis, resources, software, and writing of the original draft. D. T. performed conceptualization, formal analysis, methodology, visualization, resources, supervision, validation, and reviewing & editing. P. C. performed conceptualization, resources, funding acquisition, supervision, validation, project administration, writing of the original draft, and reviewing & editing.Data availability
The authors certify that all main and supporting data have been reported in the main manuscript and in the ESI.†Conflicts of interest
There are no conflicts to declare.Acknowledgements
This work was supported by grants from the Vidyasirimedhi Institute of Science and Technology (VISTEC) (to S. K. and P. C.), NSRF via the Program Management Unit for Human Resources & Institutional Development (PMU-B) Research and Innovation grant number B05F640089, Thailand Science Research and Innovation (TSRI) grant FRB670026/0457, and KasikornBank Public Company Limited (to P. Chaiyen). We thank Chiang Mai University for the support to N. Lawan.References
- S. Spaepen, J. Vanderleyden and R. Remans, FEMS Microbiol. Rev., 2007, 31, 425–448 CrossRef CAS PubMed.
- N. Menon, D. Richmond, M. R. Rahman and B. R. K. Menon, ACS Catal., 2022, 12, 2309–2319 CrossRef CAS.
- C. Hu, S. Wu, H. Pan and D. Guo, Biochem. Eng. J., 2023, 194, 108882 CrossRef CAS.
- A. A. Mitkas, M. Valverde and W. Chen, Nat. Chem. Biol., 2022, 18, 492–500 CrossRef CAS PubMed.
- A. L. Simonian, E. I. Rainina, P. F. Fitzpatrick and J. R. Wild, Biosens. Bioelectron., 1997, 12, 363–371 CrossRef CAS PubMed.
- J. J. Emanuele and P. F. Fitzpatrick, Biochemistry, 1995, 34, 3710–3715 CrossRef CAS PubMed.
- J. J. Emanuele, C. J. Heasley and P. F. Fitzpatrick, Arch. Biochem. Biophys., 1995, 316, 241–248 CrossRef CAS PubMed.
- E. C. Ralph, M. A. Anderson, W. W. Cleland and P. F. Fitzpatrick, Biochemistry, 2006, 45, 15844–15852 CrossRef CAS PubMed.
- H. M. Gaweska, A. B. Taylor, P. J. Hart and P. F. Fitzpatrick, Biochemistry, 2013, 52, 2620–2626 CrossRef CAS PubMed.
- G. Gadda, L. J. Dangott, W. H. Johnson, Jr., C. P. Whitman and P. F. Fitzpatrick, Biochemistry, 1999, 38, 5822–5828 CrossRef CAS PubMed.
- P. Sobrado and P. F. Fitzpatrick, Arch. Biochem. Biophys., 2002, 402, 24–30 CrossRef CAS PubMed.
- P. Sobrado and P. F. Fitzpatrick, Biochemistry, 2003, 42, 13826–13832 CrossRef CAS PubMed.
- P. Sobrado and P. F. Fitzpatrick, Biochemistry, 2003, 42, 13833–13838 CrossRef CAS PubMed.
- D. Trisrivirat, C. Sutthaphirom, P. Pimviriyakul and P. Chaiyen, ChemBioChem, 2022, 23, e202100666 CrossRef CAS PubMed.
- S. Kongjaroon, D. Trisrivirat and P. Chaiyen, presented in part at Pure and Applied Chemistry International Conference, Mae Fah Luang University, Chiang Rai, Thailand, April, 2023.
- Z. Xu, Y.-P. Xue, S.-P. Zou and Y.-G. Zheng, in Biomass, Biofuels, Biochemicals, ed. S. P. Singh, A. Pandey, R. R. Singhania, C. Larroche and Z. Li, Elsevier, 2020, pp. 67–89 DOI:10.1016/B978-0-12-819820-9.00005-3.
- A. Phintha and P. Chaiyen, Chem. Catal., 2022, 2, 2614–2643 CrossRef CAS.
- N. G. Nezhad, R. N. Z. R. A. Rahman, Y. M. Normi, S. N. Oslan, F. M. Shariff and T. C. Leow, Appl. Microbiol. Biotechnol., 2022, 106, 4845–4866 CrossRef CAS PubMed.
- S. M. Marques, J. Planas-Iglesias and J. Damborsky, Curr. Opin. Struct. Biol., 2021, 69, 19–34 CrossRef CAS PubMed.
- V. Pongsupasa, P. Anuwan, S. Maenpuen and T. Wongnate, Methods Mol. Biol., 2022, 2397, 159–178 CrossRef CAS PubMed.
- M. Musil, J. Stourac, J. Bendl, J. Brezovsky, Z. Prokop, J. Zendulka, T. Martinek, D. Bednar and J. Damborsky, Nucleic Acids Res., 2017, 45, W393–W399 CrossRef CAS PubMed.
- M. Musil, A. Jezik, J. Horackova, S. Borko, P. Kabourek, J. Damborsky and D. Bednar, Briefings Bioinf., 2023, 25 Search PubMed.
- M. T. Reetz and J. D. Carballeira, Nat. Protoc., 2007, 2, 891–903 CrossRef CAS PubMed.
- M. T. Reetz, J. D. Carballeira and A. Vogel, Angew. Chem., Int. Ed., 2006, 45, 7745–7751 CrossRef CAS PubMed.
- D. B. Craig and A. A. Dombkowski, BMC Bioinf., 2013, 14, 346 CrossRef PubMed.
- A. Goldenzweig, M. Goldsmith, S. E. Hill, O. Gertman, P. Laurino, Y. Ashani, O. Dym, T. Unger, S. Albeck, J. Prilusky, R. L. Lieberman, A. Aharoni, I. Silman, J. L. Sussman, D. S. Tawfik and S. J. Fleishman, Mol. Cell, 2016, 63, 337–346 CrossRef CAS PubMed.
- P. Pongpamorn, P. Watthaisong, P. Pimviriyakul, A. Jaruwat, N. Lawan, P. Chitnumsub and P. Chaiyen, ChemBioChem, 2019, 20, 3020–3031 CrossRef CAS PubMed.
- P. Watthaisong, P. Kamutira, C. Kesornpun, V. Pongsupasa, J. Phonbuppha, R. Tinikul, S. Maenpuen, T. Wongnate, R. Nishihara, Y. Ohmiya and P. Chaiyen, Angew. Chem., Int. Ed., 2022, 61, e202116908 CrossRef CAS PubMed.
- P. Watthaisong, P. Pongpamorn, P. Pimviriyakul, S. Maenpuen, Y. Ohmiya and P. Chaiyen, Angew. Chem., Int. Ed., 2019, 58, 13254–13258 CrossRef CAS PubMed.
- L. Pollegioni, P. Motta and G. Molla, Appl. Microbiol. Biotechnol., 2013, 97, 9323–9341 CrossRef CAS PubMed.
- Y. Peleg, R. Vincentelli, B. M. Collins, K.-E. Chen, E. K. Livingstone, S. Weeratunga, N. Leneva, Q. Guo, K. Remans, K. Perez, G. E. K. Bjerga, Ø. Larsen, O. Vaněk, O. Skořepa, S. Jacquemin, A. Poterszman, S. Kjær, E. Christodoulou, S. Albeck, O. Dym, E. Ainbinder, T. Unger, A. Schuetz, S. Matthes, M. Bader, A. de Marco, P. Storici, M. S. Semrau, P. Stolt-Bergner, C. Aigner, S. Suppmann, A. Goldenzweig and S. J. Fleishman, J. Mol. Biol., 2021, 433, 166964 CrossRef CAS PubMed.
- X. Cai, J. Hua, Z.-M. Lin, C.-Y. Sun, C.-H. Hu, X. Zhang, J.-D. Shen, H.-Y. Zhou, H.-Y. Wang, K.-Q. Chen, D.-S. Chen, X.-P. Cheng, M. Li, Z.-Q. Liu and Y.-G. Zheng, ACS Sustainable Chem. Eng., 2023, 11, 9858–9867 CrossRef CAS.
- J. Santos-Aberturas, M. Dörr and U. T. Bornscheuer, Methods Mol. Biol., 2018, 1685, 157–170 CrossRef CAS PubMed.
- K. Prakinee, A. Phintha, S. Visitsatthawong, N. Lawan, J. Sucharitakul, C. Kantiwiriyawanitch, J. Damborsky, P. Chitnumsub, K.-H. van Pée and P. Chaiyen, Nat. Catal., 2022, 5, 534–544 CrossRef CAS.
- F. W. Studier, Protein Expression Purif., 2005, 41, 207–234 CrossRef CAS PubMed.
- H. Yu, Y. Zhao, C. Guo, Y. Gan and H. Huang, Biochim. Biophys. Acta, Proteins Proteomics, 2015, 1854, 65–72 CrossRef CAS PubMed.
- U. Bornscheuer and M. Höhne, Protein Engineering: Methods and Protocols, 2018 Search PubMed.
- B. Sullivan, A. Z. Walton and J. D. Stewart, Enzyme Microb. Technol., 2013, 53, 70–77 CrossRef CAS PubMed.
- H. M. Gaweska, A. B. Taylor, P. J. Hart and P. F. Fitzpatrick, Biochemistry, 2013, 52, 2620–2626 CrossRef CAS PubMed.
- B. R. Brooks, C. L. Brooks, 3rd, A. D. Mackerell, Jr., L. Nilsson, R. J. Petrella, B. Roux, Y. Won, G. Archontis, C. Bartels, S. Boresch, A. Caflisch, L. Caves, Q. Cui, A. R. Dinner, M. Feig, S. Fischer, J. Gao, M. Hodoscek, W. Im, K. Kuczera, T. Lazaridis, J. Ma, V. Ovchinnikov, E. Paci, R. W. Pastor, C. B. Post, J. Z. Pu, M. Schaefer, B. Tidor, R. M. Venable, H. L. Woodcock, X. Wu, W. Yang, D. M. York and M. Karplus, J. Comput. Chem., 2009, 30, 1545–1614 CrossRef CAS PubMed.
- T. J. Dolinsky, J. E. Nielsen, J. A. McCammon and N. A. Baker, Nucleic Acids Res., 2004, 32, W665–W667 CrossRef CAS PubMed.
- A. D. MacKerell, D. Bashford, M. Bellott, R. L. Dunbrack, J. D. Evanseck, M. J. Field, S. Fischer, J. Gao, H. Guo, S. Ha, D. Joseph-McCarthy, L. Kuchnir, K. Kuczera, F. T. K. Lau, C. Mattos, S. Michnick, T. Ngo, D. T. Nguyen, B. Prodhom, W. E. Reiher, B. Roux, M. Schlenkrich, J. C. Smith, R. Stote, J. Straub, M. Watanabe, J. Wirkiewicz-Kuczera, D. Yin and M. Karplus, J. Phys. Chem. B, 1998, 102, 3586–3616 CrossRef CAS PubMed.
- J. C. Phillips, R. Braun, W. Wang, J. Gumbart, E. Tajkhorshid, E. Villa, C. Chipot, R. D. Skeel, L. Kalé and K. Schulten, J. Comput. Chem., 2005, 26, 1781–1802 CrossRef CAS PubMed.
- J. P. T. Isgro, M. Sotomayor, E. Villa, H. Yu, D. Tanner, Y. Liu, Z. Wu and D. Hardy, NAMD TUTORIAL Windows Version, https://www.ks.uiuc.edu/Training/Tutorials/namd/namd-tutorial-win-html/, accessed August 12, 2021.
Footnote |
| † Electronic supplementary information (ESI) available. See DOI: https://doi.org/10.1039/d4cb00102h |
| This journal is © The Royal Society of Chemistry 2024 |


