Facile one-step synthesis of mesoporous Pt-based alloy nanospheres for ethanol electrooxidation†
Ruyi
Wang
a,
Shichun
Gu
a,
Dexiang
Li
a,
Chaoman
Wang
a,
Chongyuan
Zhai
bc,
Yu
Sun
d,
Xue
Wang
*a,
Hui
Huang
bc,
Zhongcheng
Guo
bc and
Yapeng
He
 *bc
*bc
aFaculty of Chemistry and Chemical Engineering, Yunnan Normal University, Kunming 650500, China. E-mail: xwang@ynnu.edu.cn
bFaculty of Metallurgical and Energy Engineering, Kunming University of Science and Technology, Kunming 650093, China. E-mail: heyapeng@kmust.edu.cn
cKunming Hendera Technology Co. Ltd, Kunming 650106, China
dSchool of Advanced Materials and Nanotechnology, Xidian University, Xi’an 710126, China
First published on 15th November 2023
Abstract
Mesoporous Pt-based alloy nanospheres were prepared via a one-step soft-template strategy. The regulation of electronic structure, lattice contraction and abundant active sites endowed the mesoporous Pt-based catalysts with remarkable electrochemical activity towards ethanol oxidation reaction.
Noble metals (NMs) are chemically stable materials due to their extreme anti-corrosiveness and oxidation resistance.1,2 In recent years, numerous forms of NMs including spheres,3 particles,4 cages,5 and rods6 have been extensively investigated. The regularity of their structures ensures a homogeneity of their reactive sites, which benefits the analysis of the relationship between structure and activity.7 Of the various NMs, platinum-group metals (PGMs) are particularly comprehensively employed as industrial catalysts, electrode materials,8 and in the bio-medical field9 owing to their unfilled respective d-bands,10,11 varied chemical functions, and inertness.12,13 Specifically, PGMs with porous nanostructures could provide considerable access to guest species and facilitate mass transfer from exterior faces to the interior architecture,14 guaranteeing that all sides of the porous network are freely available to participate in (electro)catalysis.3 Besides, mesoporous structures offering abundant active surface sites are generally considered to exhibit better overall activity than non-porous materials.15
Common methods to produce mesostructured PGM catalysts include hard and soft-templating methods.16,17 However, the hard template eventually needs to be removed using high temperature or acid leaching, and these processes consume much time.18 In contrast, the soft-templating method is inexpensive, simple to perform, but the control of the synthesis process is difficult and particles size cannot be accurately adjusted.19 The wet chemical route is acknowledged as an eco-friendly strategy and can straightforwardly realize large-scale synthesis.20 Despite the above successful preparation of porous Pt nanomaterials, the construction of Pt catalysts with well-controlled dimensions and morphologies continues to be highly challenging.21 There is thus a strong desire to develop new options to overcome the tediousness and complexities of these synthetic methods. In addition, the development of electrocatalysts displaying good reactivity and robust reliability at low PGM loading to afford high performance in particular applications is also regarded as an urgent need. Accordingly, we demonstrated a facile one-step route involving a soft-template strategy for synthesizing a series of high-performance mesoporous Pt-based nanosphere electrocatalysts of ethanol oxidation with a controlled composition and excellent performance.
The process for synthesizing mesoporous Pt-based nanospheres was schematically illustrated in Scheme 1. The cationic surfactant cetyltrimethylammonium bromide (CTAB) was selected as the soft template and Pluronic F127 block copolymers as the assistant template in the synthesis procedures. First, CTAB and F127 were self-assembled into stable micelles. After adding K2PtCl6, the exteriors of the micelles could smoothly adsorb metal ions, with Br− combining with [PtCl6]2− in the solution to form [PtBr6]2−, leading to the generation of (CTA)2PtBr6 metallomicelles.22 Here, CTAB was posited to be functionally dominant in the generation of nanoparticles, with the lipophilic groups (CTA+) becoming encapsulated over the surface of the nanoparticles to produce quasi-spherical particles. Finally, well-dispersed mesoporous Pt spheres with a narrow size distribution could be achieved, and deliver reliable properties and outstanding electrochemical activity towards the ethanol oxidation reaction (EOR).
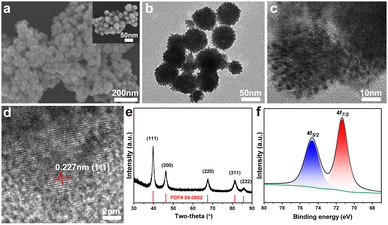
As shown in Fig. 1a, the mesoporous Pt nanospheres (m-Pt1) prepared with a CTAB/F127 mass ratio of 5![[thin space (1/6-em)]](https://www.rsc.org/images/entities/char_2009.gif) :
:![[thin space (1/6-em)]](https://www.rsc.org/images/entities/char_2009.gif) 1 were well-dispersed individual spheres with mesopores on the surface. TEM images (Fig. 1b and c) clearly revealed the abundant porosity of the uniformly-sized nanospheres. The average diameter of m-Pt1 was measured to be 58 nm and the surface area was determined to be 20.3 m2 g−1 (Fig. S1-2, ESI†). As shown in Fig. 1d, m-Pt1 displayed a lattice spacing of 0.227 nm, which could be attributed to the (111) crystal planes of Pt. The wide-angle XRD pattern exhibited five sharp diffraction peaks, which were in full accord with the (111), (200), (220), (311), and (222) planes of the face-centred cubic (fcc) structure (Fig. 1e).23 Based on the Pt 4f XPS data (Fig. 1f), the peaks observed at 74.6 eV and 71.2 eV could be attributed to the Pt 4f5/2 and Pt 4f7/2 species, respectively.24 These results clearly indicated that the synthesized m-Pt1 was exclusively composed of metallic platinum.
1 were well-dispersed individual spheres with mesopores on the surface. TEM images (Fig. 1b and c) clearly revealed the abundant porosity of the uniformly-sized nanospheres. The average diameter of m-Pt1 was measured to be 58 nm and the surface area was determined to be 20.3 m2 g−1 (Fig. S1-2, ESI†). As shown in Fig. 1d, m-Pt1 displayed a lattice spacing of 0.227 nm, which could be attributed to the (111) crystal planes of Pt. The wide-angle XRD pattern exhibited five sharp diffraction peaks, which were in full accord with the (111), (200), (220), (311), and (222) planes of the face-centred cubic (fcc) structure (Fig. 1e).23 Based on the Pt 4f XPS data (Fig. 1f), the peaks observed at 74.6 eV and 71.2 eV could be attributed to the Pt 4f5/2 and Pt 4f7/2 species, respectively.24 These results clearly indicated that the synthesized m-Pt1 was exclusively composed of metallic platinum.
 | ||
| Fig. 1 Structural and compositional characterization of m-Pt1. (a) SEM images, (b) low- and (c, d) high-resolution TEM images, (e) wide-angle XRD pattern, and (f) XPS spectrum of Pt 4f. | ||
Fig. S3 (ESI†) illustrates the mesoporous Pt nanospheres obtained with various mass ratios of templates. In the as-prepared m-Pt2 (only F127 as template) and m-Pt3 (only CTAB as template), mesoporous structures with diameters of about 20 nm and 46 nm, respectively, were observed. Interestingly, compared to m-Pt3, the prepared m-Pt2 appeared to consist of larger mesopores and smaller particle sizes, revealing that the addition of F127 increased the pore size. The results implied that both CTAB and F127 surfactants contributed to the formation of m-Pt nanospheres.22,25
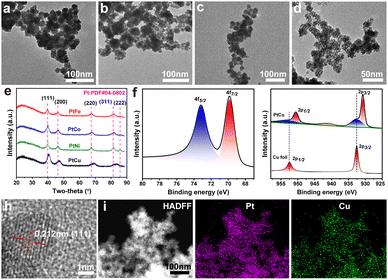
To prove the applicability of the approach for the preparation of Pt-based alloys, the mesoporous PtFe, PtCo, PtNi, and PtCu alloy nanospheres were synthesized under the same environmental condition (Fig. 2). The m-PtM (M = Cu, Fe, Co, and Ni) bimetallic alloy particles exhibited spherical morphologies and meso-structures. Based on a statistical analysis, each of the as-prepared nanoparticles exhibited a narrow size distribution (approximately 21–33 nm, Fig. S4, ESI†) and the order of particle size was PtCo > PtNi > PtCu > PtFe. XRD patterns of m-PtM samples (Fig. 2e) displayed a typical Pt-based fcc structure with incompletely symmetric peak positions, reflecting the formation of PtM alloy phases.26,27 Besides, the diffraction peaks of m-PtM shifted to higher angles compared to m-Pt1, which could be attributed to the lattice contraction arising from the substitution of Pt atoms with M atoms having smaller radii.27 As shown in Fig. 2f, Pt 4f doublet peaks were observed in the X-ray photoelectron spectrum of m-PtCu sample. Compared with the Pt 4f signals of m-Pt1, those of m-PtCu displayed a negative shift, to values of 73.2 eV and 69.8 eV for Pt 4f5/2 and Pt 4f7/2, respectively. The intense peaks at 950.6 eV and 930.7 eV, shown in Fig. 2g, corresponded to Cu 2p1/2 and Cu 2p3/2 peaks of metallic Cu, negatively shifted compared to the peaks of a reference Cu foil (952.5 eV and 932.6 eV corresponding to Cu 2p1/2 and Cu 2p3/2).28 Weak signals for Cu(II) (932.5, 941.5, and 952.7 eV) were also detected, suggesting a small amount of Cu present in the oxidized state.29 A decreased gap between the binding energy signal of Pt and that of Cu, from the compressive strain resulting from the lattice parameter difference, was demonstrated, and suggested a strong electronic interaction and charge transfer from Cu to Pt atoms.2 Besides, the results provided additional evidence for the formation of a PtCu alloy with an atomically mixed composition, lowering the energy of the electronic band structure that is a positive indicator for improved EOR kinetics.22,30
Fig. 2h shows the HRTEM image of the m-PtCu alloy. The lattice spacing here was estimated to be 0.212 nm, belonging to the (111) facet of the PtCu phase and confirming the lattice contraction compared to m-Pt1 (0.227 nm). This contraction was due to the compressive strain arising from the introduction of Cu atoms. The STEM, corresponding element mappings and EDX results revealed that Pt/Cu elements were homogeneously distributed in the m-PtCu nanoparticles (Fig. 2i and Fig. S5, ESI†), which further indicated that the element Cu was successfully incorporated into the nanoparticles, forming bimetallic m-PtCu. Based on ICP-OES measurements, the Pt/Cu atomic ratio in the m-PtCu alloy was 64![[thin space (1/6-em)]](https://www.rsc.org/images/entities/char_2009.gif) :
:![[thin space (1/6-em)]](https://www.rsc.org/images/entities/char_2009.gif) 36, slightly greater than the theoretical Pt/Cu ratio (1
36, slightly greater than the theoretical Pt/Cu ratio (1![[thin space (1/6-em)]](https://www.rsc.org/images/entities/char_2009.gif) :
:![[thin space (1/6-em)]](https://www.rsc.org/images/entities/char_2009.gif) 1), and which may be ascribed to the dissolution of unalloyed Cu during washing of the products. As shown in Fig. S6 (ESI†), when K2PtCl6 was not added into the synthetic system, the nanoparticles were not obtained.
1), and which may be ascribed to the dissolution of unalloyed Cu during washing of the products. As shown in Fig. S6 (ESI†), when K2PtCl6 was not added into the synthetic system, the nanoparticles were not obtained.
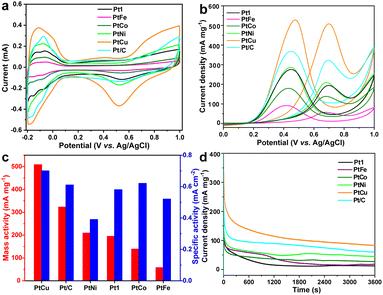
The calculated electrochemical surface area (ECSA) values (m2 g−1) exhibited an increasing trend from m-Pt3 (11.0) to m-PtFe (11.1), m-PtCo (22.5), m-Pt2 (32.6), m-Pt1 (33.2), Pt/C (52.5), m-PtNi (53.6), and finally to m-PtCu (72.3), as described in Fig. 3a, S7 and S8 (ESI†). The ECSA of m-PtM decreased slightly after alloying with any of the 3d transition metals Fe, Co, and Ni, which could be related to the resulting hindered active sites. The m-PtCu alloy could show more active sites and higher electrocatalytic activities than commercial Pt/C. As presented in Fig. 3b, an anodic peak was observed at about 0.68 V in the forward scan, and was indexed to the oxidation of ethanol; and the appearance of the second anodic peak at 0.42 V during the reverse scan could be ascribed to the removal of residual carbon or incompletely oxidized carbonaceous produced during the EOR process. The m-PtCu sample exhibited a higher EOR peak current and better catalytic capacity than commercial Pt/C catalyst. As shown in Fig. 3c, the addition of Cu into mesoporous Pt catalyst enhanced the activity of mesoporous PtCu catalysts of the EOR. Here, the mass and specific activity normalized to the Pt mass and real surface area, respectively, were 508.1 mA mg−1 and 0.703 mA cm−2, greater than those for Pt/C (322.7 mA mg−1 and 0.614 mA cm−2). Introduction of the Cu transition metals could lower the electronic binding energy in Pt, provide more oxygenated species at lower potentials, help limit poisoning of the surface, and improve catalytic performance. Besides, a mesoporous structure having a high surface area and porous channels could provide sufficiently high electrocatalytic activity and facilitate the transport of reactants, features conducive to cleavage of C–H bonds in the ethanol decomposition, thereby improving the catalytic properties.
The electrochemical impedance spectroscopy (EIS) in Fig. S9 (ESI†) further revealed the charge-transport properties of these catalysts. m-PtCu yielded the Nyquist plot with the smallest impedance diameter, implying the lowest charge transfer resistance and highest reaction rate on the catalyst surface. The Cu alloying could have lowered the d-band level of Pt and contribute to the adsorption of OH species. Furthermore, chronoamperometric (CA) curves of the samples (Fig. 3d) were acquired to investigate their durability and stability. The m-PtCu catalyst delivered a remarkable retention and high oxidation current. Here, the mesoporous structure apparently diminished the aggregation of electrocatalyst particles, resulting in high stability. Subsequently, the cycling stability levels of m-Pt1 and m-PtCu for the EOR were evaluated by repeating the LSV test for 100 cycles (Fig. S10, ESI†). The peak current density increased rapidly during the initial cycles due to the fast dispersion of ethanol in the catalyst. Then, with additional scans, the peak current density gradually decreased, perhaps due to adsorption of intermediate incompletely oxidized products that might have impeded the activity of the catalyst during the EOR. Then, the peak current density tended to equilibrate, indicating a preferable stability of m-Pt1 and m-PtCu catalysts in the later stages.
Besides, the oxidation peak current densities of m-Pt1 and m-PtCu increased linearly with the square root of the scan rate, showing that the EOR was under diffusion control. The slope of the plot for the m-PtCu nanospheres was substantially higher than that for m-Pt1, demonstrating higher diffusion efficiency of ethanol molecules inside the m-PtCu alloy than in m-Pt1. On the other hand, metallic precursor volume ratio of 1/1 for K2PtCl6/CuCl2 isconsidered to be the optimal value for synthesizing mesoporous Pt alloy nanospheres (Fig. S11 and S12, ESI†). The currents of m-Pt2Cu1 and m-Pt1Cu2 during the CA test were lower than that for m-PtCu over the entire time range.
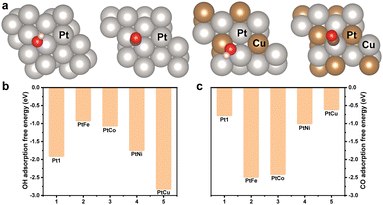
The adsorption free energy (AFE) of CO and OH are in general considered as essential descriptors for the EOR. Density functional theory calculations were performed to further illustrate the origin of the promoted EOR activity (Fig. 4a and Fig. S13, ESI†). These calculations demonstrated the detailed AFE of OH and CO, as depicted in Fig. 4b and c. The (111) surface of PtCu was clearly observed to deliver a lower AFE for OH and higher AFE for CO. This comparison suggested the occurrence of stronger Pt-OH bonding and weaker Pt-CO bonding in the m-PtCu alloy than m-Pt1 and other alloys. Promoted OH adsorption would be favourable for the formation of Pt-OH, and the reduced AFE towards CO could facilitate the removal of surface-bonded CO poisons, consequently improving the activity. The results were quite consistent with the mass activities of Pt-based electrocatalysts, shown in Fig. 3c. The Cu alloying was concluded to contribute to the adsorption of OH species. Moreover, the lattice contraction could also markedly improve the intrinsic catalysis behaviour of Pt-based electrocatalysts.
 | ||
| Fig. 4 (a) Adsorption configurations on (111) surface of Pt and PtCu. Adsorption free energy values of (b) OH and (c) CO on the (111) surface of various Pt-based alloys. | ||
In summary, a facile one-step soft-template method was developed to successfully prepare m-Pt and m-PtCu samples showing remarkable EOR performances. Compared to commercial Pt/C, m-PtCu nanospheres displayed significantly promoted electrocatalytic activity for the EOR in acidic medium, attributed to the alloying properties and mesoporous structure. The Cu alloying could lower the d-band level of Pt and contribute to the adsorption of OH species. More importantly, the electrochemical activity of the catalyst reached 508.1 mA mg−1, substantially superior to that of commercial Pt/C catalyst (322.7 mA mg−1). High activity and excellent stability make m-PtCu promising candidates as electrocatalysts for other fuel cells.
The work was financially supported by the National Natural Science Foundation of China (22002054), Yunnan Fundamental Research Projects (2019FD107, 202101AU070157).
Conflicts of interest
There are no conflicts to declare.References
- Y. Yamauchi, A. Tonegawa, M. Komatsu, H. Wang, L. J. Wang, Y. Nemoto, N. Suzuki and K. Kuroda, J. Am. Chem. Soc., 2012, 134, 5100–5109 CrossRef CAS PubMed.
- A. S. Nugraha, M. Han, A. Ashok, Y. Kang, J. Kim, S. M. Alshehri, T. Ahamad, Y. Bando and Y. Yamauchi, Nano Energy, 2023, 116, 108770 CrossRef CAS.
- H. Lv, D. D. Xu, J. Henzie, J. Feng, A. Lopes, Y. Yamauchi and B. Liu, Chem. Sci., 2019, 10, 6423–6430 RSC.
- P. C. Zhao, Q. G. Cao, W. Yi, X. D. Hao, J. G. Li, B. S. Zhang, L. Huang, Y. J. Huang, Y. B. Jiang, B. S. Xu, Z. W. Shan and J. L. Chen, ACS Nano, 2022, 16, 14017–14028 CrossRef CAS PubMed.
- L. Y. Li, Y. X. Li, L. Jiao, X. S. Liu, Z. T. Ma, Y. J. Zeng, X. S. Zheng and H. L. Jiang, J. Am. Chem. Soc., 2022, 144, 17075–17085 CrossRef CAS.
- E. Fidiani, G. Thirunavukkarasu, Y. Li, Y. L. Chiu and S. F. Du, J. Mater. Chem. A, 2021, 9, 5578–5587 RSC.
- C. L. Yang, L. N. Wang, P. Yin, J. Y. Liu, M. X. Chen, Q. Q. Yan, Z. S. Wang, S. L. Xu, S. Q. Chu, C. H. Cui, H. X. Ju, J. F. Zhu, Y. Lin, J. L. Shui and H. W. Liang, Science, 2021, 374, 459–464 CrossRef CAS.
- J. W. Zhu, L. Xu, Z. H. Lyu, M. H. Xie, R. H. Chen, W. Q. Jin, M. Mavrikakis and Y. N. Xia, Angew. Chem., Int. Ed., 2021, 60, 10384–10392 CrossRef CAS PubMed.
- S. H. Sunwoo, S. I. Han, D. Jung, M. Kim, S. Nam, H. Lee, S. Choi, H. Kang, Y. S. Cho, D. H. Yeom, M. J. Cha, S. Lee, S. P. Lee, T. Hyeon and D. H. Kim, ACS Nano, 2023, 17, 7550–7561 CrossRef CAS.
- M. Iqbal, Y. Kim, A. G. Saputro, G. Shukri, B. Yuliarto, H. Lim, H. Nara, A. A. Alothman, J. Na, Y. Bando and Y. Yamauchi, ACS Appl. Mater. Interfaces, 2020, 12, 51357–51365 CrossRef CAS PubMed.
- M. Han, K. Kani, J. Na, J. Kim, Y. Bando, T. Ahamad, S. M. Alshehri and Y. Yamauchi, Adv. Funct. Mater., 2023, 33, 2301831 CrossRef CAS.
- H. J. Wang, L. Wang, T. Sato, Y. Sakamoto, S. Tominaka, K. Miyasaka, N. Miyamoto, Y. Nemoto, O. Terasaki and Y. Yamauchi, Chem. Mater., 2012, 24, 1591–1598 CrossRef CAS.
- J. Chen, M. Aliasgar, F. B. Zamudio, T. Zhang, Y. Zhao, X. Lian, L. Wen, H. Yang, W. Sun, S. M. Kozlov, W. Chen and L. Wang, Nat. Commun., 2023, 14, 1711 CrossRef CAS.
- B. Jiang, Y. N. Guo, J. Kim, A. E. Whitten, K. Wood, K. Kani, A. E. Rowan, J. Henzie and Y. Yamauchi, J. Am. Chem. Soc., 2018, 140, 12434–12441 CrossRef CAS.
- Y. Q. Kang, Y. N. Guo, J. J. Zhao, B. Jiang, J. R. Guo, Y. Tang, H. X. Li, V. Malgras, M. A. Amin, H. Nara, Y. Sugahara, Y. Yamauchi and T. Asahi, Small, 2022, 18, 2203411 CrossRef CAS PubMed.
- H. J. Wang, H. Y. Jeong, M. Imura, L. Wang, L. Radhakrishnan, N. Fujita, T. Castle, O. Terasaki and Y. Yamauchi, J. Am. Chem. Soc., 2011, 133, 14526–14529 CrossRef CAS.
- B. Jiang, C. Li, O. Dag, H. Abe, T. Takei, T. Imai, M. S. A. Hossain, M. T. Islam, K. Wood, J. Henzie and Y. Yamauchi, Nat. Commun., 2017, 8, 15581 CrossRef CAS.
- V. Malgras, H. Ataee-Esfahani, H. J. Wang, B. Jiang, C. L. Li, K. C. W. Wu, J. H. Kim and Y. Yamauchi, Adv. Mater., 2016, 28, 993–1010 CrossRef CAS PubMed.
- Y. J. Ko, H. Kim, W. H. Lee, M. H. Han, C. Oh, C. H. Choi, W. Kim, J. M. Baik, J. Y. Choi, P. Strasser and H. S. Oh, J. Mater. Chem. A, 2023, 11, 5864–5872 RSC.
- L. Wang and Y. Yamauchi, Chem. Mater., 2009, 21, 3562–3569 CrossRef CAS.
- Q. Lenne, A. Mattiuzzi, I. Jabin, L. Troian-Gautier, J. Hamon, Y. R. Leroux and C. Lagrost, ChemSusChem, 2023, 16, e202201990 CrossRef CAS PubMed.
- L. J. Li, Y. C. Zhao, Z. T. Lei and C. H. Yang, New J. Chem., 2022, 46, 20260–20268 RSC.
- Y. Kang, M. Li, Y. Cai, M. Cargnello, R. E. Diaz, T. R. Gordon, N. L. Wieder, R. R. Adzic, R. J. Gorte, E. A. Stach and C. B. Murray, J. Am. Chem. Soc., 2013, 135, 2741–2747 CrossRef CAS.
- Z. Q. Zeng, S. Küspert, S. E. Balaghi, H. E. M. Hussein, N. Ortlieb, M. Knäbbeler-Buß, P. Hügenell, S. Pollitt, N. Hug, J. Melke and A. Fischer, Small, 2023, 19, 202205885 Search PubMed.
- C. J. Li, Y. Xu, K. Deng, S. L. Yin, Z. Q. Wang, H. R. Xue, X. N. Li, L. Wang and H. J. Wang, J. Mater. Chem. A, 2019, 7, 3910–3916 RSC.
- X. Yu, D. Wang, Q. Peng and Y. Li, Chem. – Eur. J., 2013, 19, 233–239 CrossRef CAS PubMed.
- L. Xiong and A. Manthiram, J. Electrochem. Soc., 2005, 152, A697–A703 CrossRef CAS.
- Z. Y. Shih, C. W. Wang, G. B. Xu and H. T. Chang, J. Mater. Chem. A, 2013, 1, 4773–4778 RSC.
- H. J. Qiu, H. T. Xu, X. Li, J. Q. Wang and Y. Wang, J. Mater. Chem. A, 2015, 3, 7939–7944 RSC.
- H. H. Li, Q. Q. Fu, L. Xu, S. Y. Ma, Y. R. Zheng, X. J. Liu and S. H. Yu, Energy Environ. Sci., 2017, 10, 1751–1756 RSC.
Footnote |
| † Electronic supplementary information (ESI) available. See DOI: https://doi.org/10.1039/d3cc04416e |
| This journal is © The Royal Society of Chemistry 2024 |


