NMR-guided refinement of crystal structures using 15N chemical shift tensors†
Ryan
Toomey
a,
Luther
Wang
 a,
Emily C.
Heider
 b,
Joshua D.
Hartman
 c,
Alexander J.
Nichols
d,
Dean A. A.
Myles
e,
Anna S.
Gardberg
e,
Garry J.
McIntyre
f,
Matthias
Zeller
g,
Manish A.
Mehta
*d and
James K.
Harper
 *a
*a
aBrigham Young University, Department of Chemistry and Biochemistry, Provo, UT 84602, USA. E-mail: jkharper@chem.byu.edu
bUtah Valley University, Department of Chemistry, Orem, UT 84058, USA
cUniversity of California, Riverside, Department of Chemistry, Riverside, CA 92521, USA
dOberlin College and Conservatory, Department of Chemistry and Biochemistry, Oberlin, OH 44074, USA
eOak Ridge National Laboratory, Oak Ridge, TN 37831, USA
fAustralian Nuclear Science and Technology Organization, Lucas Heights, NSW 2234, Australia
gPurdue University, Department of Chemistry, West Lafayette, IN 47907, USA
First published on 3rd June 2024
Abstract
An NMR-guided procedure for refining crystal structures has recently been introduced and shown to produce unusually high resolution structures. Herein, this procedure, is modified to include 15N shift tensors instead of the 13C values employed previously. This refinement involves six benchmark structures and 45 15N tensors. All refined structures show a statistically significant improvement in NMR fit over energy based refinements. Metrics other than NMR agreement indicate that NMR refinement does not introduce errors with no significant changes observed in atom positions or diffraction patterns. However, refinement does change bond lengths by more than experimental uncertainty with most bond types become shorter than diffraction values. Although this decrease is small (1–4 pm), it significantly alters computed 15N tensors. The NMR refinement was further evaluated by refining two tripeptides. These structures rapidly converged and achieved an NMR agreement equivalent to benchmark values. To ensure accurate comparisons, a complete atomic structure of the tripeptide AGG was determined by single crystal neutron diffraction at 0.58 Å resolution, allowing unambiguous determination of all hydrogen positions. To verify that all NMR refinements represent genuine improvements rather than artifacts of DFT methods, an independent approach was included to evaluate the final NMR refined coordinates. This analysis employs cluster methods and the PBE0 functional. The unusually small 15N NMR root-mean-square error of the final refined structures (3.6 ppm) supports the conclusion that the changes made represent improvements over both diffraction coordinates and lattice-including DFT energy refined coordinates.
Introduction
Recent NMR crystallography studies have demonstrated that secondary refinements of crystal structures can create unusually high-resolution structures.1–8 This improved resolution usually comes from a geometry refinement step that is based on energy and typically includes lattice fields. NMR data are included after relaxation to evaluate the structures and the outcome depends on the type of solid-state NMR (SSNMR) data evaluated. Some of the most accurate structures have been found to come from refinements that include tensor measurements. Both electric field gradient1,2,6 and chemical shift tensors3–10 have been employed in these refinements and have been shown to provide more accurate structures than those obtained from NMR distance measurements from dipole coupling studies.4,8 Although most studies compare refined structures to those obtained from X-ray diffraction, structural differences have been consistently observed between NMR and neutron diffraction structures, including differences at hydrogen positions.11 These studies suggest that including SSNMR as a tool in refining crystal structures will complement more conventional diffraction methods.In recent work, several studies have explored a more direct NMR-guided refinement. These studies evaluate the quality of a refinement based primarily on agreement between computed and experimental NMR data and have focused on structures including the zeolite Sigma-2 (ref. 4) and the inorganic structures Na2Al2B2O7, Na4P2O7 and Na3HP2O7·H2O.6,12 For each of these structures, a refinement scheme was employed that involved manually moving all atoms to a number of new positions centered around the original X-ray-determined coordinates. In most cases, these movements were small, involved average displacements of only a few picometers. For all new structures created by these changes, NMR parameters were computed using DFT methods that included lattice fields. Comparison of the computed values with experimental data identified a best-fit structure. In all of the studies cited above,4,6,12 the final structures differed from the initial coordinates by less than the reported error in the diffraction studies at most atom positions. In fact, the average differences between the initial and refined structures were smaller than the diffraction limit for the radiation used and would therefore be undetectable by diffraction. In contrast, the differences in the computed NMR parameters before and after refinement were larger than the expected errors in experimental data. The ability to refine crystal structures using NMR has also been demonstrated using semi-empirical methods, and these studies have focused primarily on refinement of protein structures.3,5,13 This work has resulted in unusually high resolution structures.13,14 Notably, these semi-empirical refinements employ force fields that make them most applicable to proteins.15
In recent work,16 we have proposed a methodology aimed at building upon and extending these early NMR refinement studies. This work involved the creation of a new software tool capable of generating new atom positions for any number of atoms via a Monte Carlo sampling scheme. All new structures generated by this near automated process are subsequently subjected to a DFT calculation of an NMR parameter in an environment that includes lattice fields. These computational results are compared to experimental data to identify best-fit structures. This approach is now feasible due to significant improvements in computations that allow hundreds of candidate structures to be evaluated in reasonable times. This scheme relies on diffraction coordinates from any source as starting points and employs a two-step relaxation process to create a new set of coordinates. The final step in this analysis is a Monte Carlo sampling of the space around each atom to identify atom positions that best agree with NMR data. This process involves multiple iterations to achieve convergence and provides coordinates representing a time and ensemble-averaged structure. A more detailed description of this process is given elsewhere.16 In our original study this process was described as “DFT-D2*/Monte Carlo”. Herein, we refer to this procedure as the “![[G with combining low line]](https://www.rsc.org/images/entities/char_0047_0332.gif) eneral
eneral ![[R with combining low line]](https://www.rsc.org/images/entities/char_0052_0332.gif) efinement of
efinement of ![[A with combining low line]](https://www.rsc.org/images/entities/char_0041_0332.gif) ll
ll ![[N with combining low line]](https://www.rsc.org/images/entities/char_004e_0332.gif) uclear
uclear ![[T with combining low line]](https://www.rsc.org/images/entities/char_0054_0332.gif) ypes” (GRANT). At present, this approach has been demonstrated using 13C chemical shift tensor data. A potentially more interesting nucleus is 15N due to its higher sensitivity to local structure. Prior work has found that 15N shift tensors are several times more sensitive than 13C to structural changes.13,17 This enhanced sensitivity is a partly a reflection of the presence of a polarizable lone electron pair at 15N sites. These electrons are strongly influenced by the local electronic environment and can delocalize significantly when an 15N is directly attached to an aromatic moiety. Nitrogen-15 can also be involved in hydrogen bonds and these interactions further vary measured shift tensors. Overall, it has been reported that 15N shift tensors exhibit a variation more than six times larger than 13C sites.18
ypes” (GRANT). At present, this approach has been demonstrated using 13C chemical shift tensor data. A potentially more interesting nucleus is 15N due to its higher sensitivity to local structure. Prior work has found that 15N shift tensors are several times more sensitive than 13C to structural changes.13,17 This enhanced sensitivity is a partly a reflection of the presence of a polarizable lone electron pair at 15N sites. These electrons are strongly influenced by the local electronic environment and can delocalize significantly when an 15N is directly attached to an aromatic moiety. Nitrogen-15 can also be involved in hydrogen bonds and these interactions further vary measured shift tensors. Overall, it has been reported that 15N shift tensors exhibit a variation more than six times larger than 13C sites.18
A focus on 15N has the further advantage of being relevant to protein structural refinement. Proteins are target structures of high interest because their experimental crystal structures are often much lower in resolution than comparable studies on small molecules. Moreover, the protein backbone is densely and uniformly populated with nitrogen, making proteins ideal targets. We note that although our NMR refinement focuses on only a single type of nucleus, all atom types within a molecule are, in fact, also refined if the site density of 13C or 15N is sufficiently high. This is because movement of other atom types strongly influences the nearby 13C or 15N sites being monitored.
It is noteworthy that measurement of 15N shift tensors can be quite challenging because 15N has a natural abundance of only 0.37%. Further decreasing sensitivity is the fact that 15N has a small gyromagetic ratio, creating low population differences between energy levels. Taken together these factors result in a receptivity of 15N that is over 45 times lower than natural abundance 13C.19 Despite these difficulties, this low sensitivity is unlikely to be problematic in studies involving proteins. This is because methods for 15N labeling of proteins at >98% are well developed and routinely employed in the vast majority of 15N NMR studies involving proteins.
A challenge in relying on computed shift tensors to refine structures is that several prior studies have been unsuccessful in accurately calculating 15N tensors. Accordingly, the modeling of tensors at 15N sites has long been viewed as a formidable challenge.20–23 Fortunately, recent work by several groups has largely resolved these challenges and has demonstrated that 15N shift tensors for nearly any functional group can now be computed with an accuracy that is only two to three times larger than the uncertainty of 13C data.1,17,24–26
In the following, a set of six 15N containing benchmark compounds are proposed as targets for GRANT refinement. The 15N NMR-guided refinement of these compounds is described to demonstrate that all 15N-containing functional groups are modeled with equivalent statistical accuracy and belong to the same population. To ensure that the proposed refinement does not introduce unexpected errors, other metrics are evaluated including movement of atom positions, changes in bond lengths and differences in X-ray powder diffraction patterns. Finally, two tripeptides are refined to assess the suitability of our methods in treating peptides and, potentially, proteins.
Experimental
All experimental NMR shift tensor values reported herein (Table 1) were acquired previously and descriptions of data acquisition and processing are provided elsewhere.17,23,27 The microcrystalline powders studied herein correspond to materials having the following refcodes in the Cambridge Structural Database (CSD): CIMETD03 (cimetidine, form A),28 GLYCIN18 (glycine, γ-phase),29 HISTCM01 (histidine HCl H2O),30 THYMIN01 (thymine),31 HXACAN26 (acetaminophen),32 GLCICH01 (glycyl glycine HCl H2O),33 CUWRUH (GGV dihydrate).34 For analysis of AGG, a new neutron diffraction structure for AGG dihydrate was obtained and employed for the analysis described herein.| Compound | Position | δ 11 | δ 22 | δ 33 | δ iso |
|---|---|---|---|---|---|
| a Acquisition parameters and other details involving measurement of experimental principal values are reported elsewhere.17,23 | |||||
| Cimetidine (form A) | N1 | 248.2 | 176.2 | 86.5 | 170.3 |
| N3 | 312.2 | 252.9 | 4.0 | 189.7 | |
| N10 | 160.2 | 64.4 | 64.4 | 96.3 | |
| N12 | 157.7 | 58.3 | 33.3 | 83.1 | |
| N15 | 129.3 | 81.3 | 46.0 | 85.5 | |
| N17 | 410.3 | 315.1 | 32.9 | 252.8 | |
| Histidine HCl H2O | Nδ1 | 287.8 | 217.5 | 64.0 | 189.9 |
| Nε2 | 276.6 | 195.1 | 57.8 | 176.5 | |
| NH3+ | 58.5 | 45.3 | 39.2 | 47.7 | |
| Thymine | N1 | 211.4 | 115.1 | 55.6 | 127.4 |
| N3 | 225.8 | 146.9 | 98.5 | 157.1 | |
| Glycine (γ-phase) | N | 42.3 | 34.3 | 23.7 | 33.4 |
| Acetaminophen | N | 240.5 | 85.4 | 85.3 | 137.1 |
| Glycylglycine HCl H2O | N3 | 213.6 | 66.0 | 59.7 | 113.1 |
| N6 | 43.8 | 37.6 | 28.8 | 36.7 | |
The AGG tripeptide was purchased from Bachem (Bubendorf, Switzerland) and used without further purification. Crystalline samples were grown by slow evaporation from water at room temperature. Neutron data collection and processing were performed with a crystal of AGG with approximate dimensions 1.7 × 1.4 × 1.0 mm3. The crystal was dipped in Fomblin oil, wrapped in thin aluminium foil, mounted on a thin V pin, and rapidly cooled to 150 K in a cryorefrigerator. Data were collected on the Very-Intense Vertical-Axis Laue Diffractometer (VIVALDI)35,36 at the Institut Laue-Langevin, Grenoble, France. A total of 10 Laue diffraction patterns were collected on a neutron-sensitive cylindrical image-plate detector at 20° intervals in a rotation of the crystal perpendicular to the incident beam with exposure time of 45 minutes per frame. The reflections were indexed, matched to a wavelength range of 0.9–3.1 Å and to a dmin of 0.55 Å, using the program LAUEGEN37 and integrated using the program ARGONNE_BOXES which is based on a 2D implementation of the 3D minimum σ(I)/I algorithm.38 Correction for absorption was unnecessary due to the small, nearly isotropic, sample volume. The integrated reflections were wavelength normalized and scaled using the program LSCALE.39 A total of 5531 reflections were recorded (1815 independent) for data in the range 4.9 to 0.58 Å, and merged with an overall Rpim 0.063 and 0.108 in the outer shell using SCALA.40 Data collection, processing, and refinement statistics are provided in ESI† as Table S2.
Since only the ratios between unit-cell dimensions are accurately determined in the white-beam Laue technique, the cell dimensions were obtained by monochromatic X-ray diffraction at ∼150 K (i.e. P2(1), a = 7.7750, b = 5.3753, c = 12.1491, α = 90.0000°, β = 102.836°, γ = 90.0000°) and these were used to index the neutron data. Analysis refinement against Fo2 values was performed using SHELXL2014.41 Neutron atomic scattering lengths were from Sears.42 Least-squares refinement of all atomic coordinates and anisotropic temperature factors resulted in a final agreement factor of R1(F2) = 0.0529 for 915 independent reflections with F > 4σ(F). The final maps and ellipsoid plots were of high quality and are provided as Fig. S1 in ESI.† Other relevant crystallographic data are summarized in Table S2 in ESI.†
The GRANT refinement procedure is described elsewhere16 and was modified in the present study by including the PW91 functional rather than the PBE functional employed previously. In most of the compounds evaluated herein, the refinement converged in five steps or fewer.
For NMR computations performed using fragment and planewave-corrected methods, all crystal structures were subjected to both all-atom and hydrogen-only geometry optimization using dispersion corrected planewave DFT methods. Geometry optimization was carried out using the open-source Quantum Espresso43 software package, dispersion corrected DFT with the D3 dispersion correction,44 the Perdew–Burke–Ernzerhof (PBE) density functional, a maximum k-point spacing of 0.005 Å−1, and an 80 Ry planewave cutoff. The following ultrasoft pseudopotentials were used: H.pbe-rrkjus.UPF, C.pbe.rrkjus.UPF, N.pbe-rrkjus.UPF, O.pbe.rrkjus.UPF. All pseudopotentials used in the present work may be obtained online at http://www.quantum-espresso.org. Chemical shielding calculations were performed on the optimized geometries using planewave DFT, two-body fragment methods, and recently developed planewave-corrected techniques.45,46 Planewave DFT calculations were carried out using CASTEP with the PBE density functional and ultrasoft pseudopotentials generated on-the-fly, as described previously.44 Single molecule and dimer calculations used in the fragment and planewave-corrected calculations were performed using Gaussian16 with the PBE0 hybrid density functional, a large DFT integration grid consisting of 150 radial and 974 Lebedev angular points, and the Pople basis set 6-311+G(2d,p). Two-body fragment calculations were performed using a polarized continuum embedded with dichloromethane as the solvent. A 4.0 Å two-body cutoff was used in the fragment calculation to capture all nearest-neighbor two-body contributions. Details of the chemical shift tensor calculations have been described elsewhere.44,47
Results and discussion
Proposed benchmark structures and their 15N tensor values
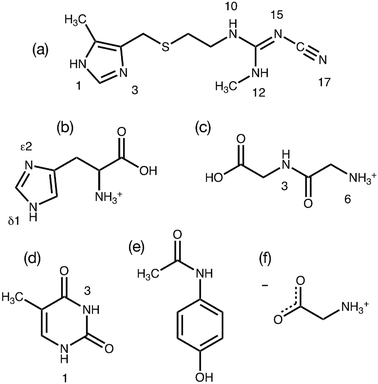
The GRANT method evaluates a refinement's accuracy by monitoring the quality of the agreement between computed and experimental 15N chemical shift tensors. It is therefore of critical importance that the most accurate experimental NMR data available are employed in this initial benchmark study. Prior work has demonstrated that a modified version17 of the FIREMAT slow spinning method provides 15N shift tensor principal values that are equal in accuracy to those obtained by single crystal NMR studies.17,23 Single crystal data are a relevant reference point because experimental errors in such studies can be less than ±1.0 ppm.48,49 Accordingly, 15N data from six compounds obtained previously from FIREMAT were included as benchmark data. These compounds include cimetidine (form A), zwitterionic glycine (gamma phase), histidine HCl H2O, thymine, acetaminophen and glycylglycine HCl H2O (Fig. 1).17,23 These compounds provide 45 15N tensors covering a shift range of 406 ppm and include a wide range of functional groups. The proposed compounds include a dipeptide and two amino acids, providing potential insight into the suitability of the methods for protein refinement. All experimental 15N shift tensor principal values are provided in Table 1.GRANT refinement of benchmark structures using 15N as a target function
The GRANT refinement employs a two-step process that first relaxes candidate crystal structures using a lattice-including DFT method followed by finer level adjustments using a Monte Carlo sampling procedure.16 Here the first step was performed using the DFT-D2* method proposed by Holmes et al.1 This step improves the agreement between experimental and computed shift tensors and allows the subsequent Monte Carlo NMR-guided refinement to converge in fewer iterations. Although the largest improvements are usually observed in hydrogen positions, the best agreement is only achieved when the coordinates of non-hydrogen atoms are also allowed to move.16 A plot of the agreement between experimental and computed shift tensors is illustrated in Fig. 2. This figure compares tensors computed after DFT-D2* adjustment and after the DFT-D2*/Monte Carlo (i.e. GRANT) refinement. The root-mean-square difference (rmsd) in the computed DFT-D2* data is 5.2 ppm, while the GRANT refined structures have an uncertainty of 4.5 ppm, a difference of 14%. These two uncertainties differ statistically from one another by more than one standard deviation (i.e. ±1.3σ).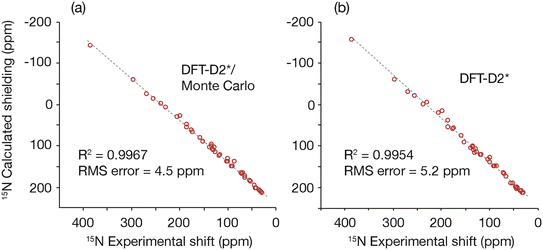 | ||
| Fig. 2 A plot comparing (a) 15N shift tensors obtained from the DFT-D2*/Monte Carlo (i.e. GRANT) NMR-guided refinement method and (b) the DFT-D2* refinement method.1 | ||
The computed tensors, shown in Fig. 2, are shielding values and must be converted into shifts in order to be compared to experimental data. A least-squares fit to each data set in Fig. 2 provides the optimal equation for converting shielding values to shifts. A first-order polynomial provides the best fit to the data, and Table 2 provides the rmsd and fitting parameters for the computed data obtained for the benchmark compounds using room-temperature lattice parameters. Included in Table 2 are rmsd and fitting parameters for the computed data obtained for the benchmark compounds using unrefined diffraction coordinates. Notably, the NMR refined data include a slope that is closer to the ideal value of 1.0 and improve upon the DFT2-D2* slope by 3.6%. All data shown have been converted into the icosahedral representation50 where a more accurate analysis is obtained.
| Treatment | rmsd (ppm) | Slope | Intercept | R 2 |
|---|---|---|---|---|
| No refinement | 16.6 | −1.158 | 267.77 | 0.9578 |
| DFT-D2* | 5.2 | −1.049 | 244.16 | 0.9954 |
| DFT-D2*/Monte Carlo | 4.5 | −1.011 | 239.92 | 0.9967 |
Evaluating the influence of GRANT refinement on non-NMR metrics
The GRANT refinement relies primarily on 15N NMR agreement to assess the quality of a refinement. It is therefore important to evaluate metrics unrelated to NMR to verify that these refinements do not introduce structural errors. Here, the metrics considered are movements in atom positions, changes in bond lengths, and differences in simulated powder diffraction patterns. In most cases, only minor differences within the expected uncertainty are observed. However, bond lengths change by more than the expected errors in diffraction data. Only a brief discussion of lattice energies before and after GRANT refinement is included here because the changes are minor and a suitable discussion is beyond the scope of the current manuscript.One of the most widely employed figures of merit for comparing crystal structures is the root-mean-square difference in atom positions. In small molecules, two crystal structures solved independently and having similar R-factors typically have rms differences in their atomic positions in the range of 0.01 to 0.1 Å.16 Another standard for identifying meaningful differences between two crystal structures of the same molecule and phase was proposed by van de Streek and Neumann.51 By this standard, potential errors are indicated when the rmsd in non-hydrogen atomic positions is greater than ±0.25 Å.
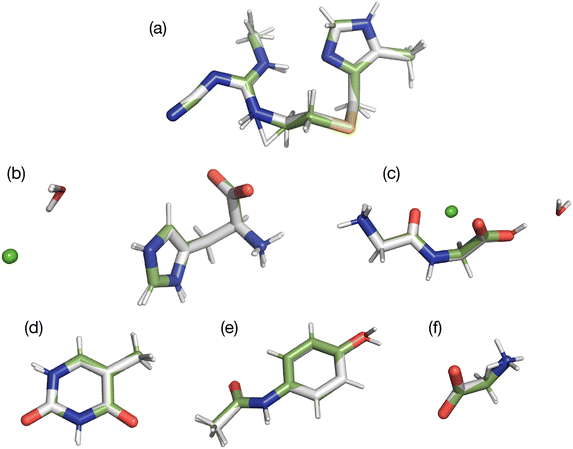
In the present study, two of the benchmark structures include a feature not found in our prior 13C study. Specifically, histidine and glycylglycine are both hydrates with water included in the unit cell. Since these waters experience relatively weak hydrogen bonding (ca. 10 kJ mol−1),52 they have the possibility of moving relative to the main structure. In addition, both structures are salts that include a chloride atom. All atoms were refined to determine if these new structural features were adequately refined. A visual comparison of the differences observed is provided in Fig. 3 by overlaying the structures obtained before (green bonds) and after refinement (grey bonds). A more quantitative comparison of each structure is given in Table 3.
| Structure | rms difference (Å) | |
|---|---|---|
| Non-hydrogen | All atoms | |
| Glycine | 0.011 | 0.575 |
| Thymine | 0.028 | 0.109 |
| Acetaminophen | 0.055 | 0.360 |
| Cimetidine | 0.071 | 0.412 |
| Glycylglycine w/HCl H2O | 0.036 | 0.053 |
| No HCl or H2O | 0.051 | 0.051 |
| Histidine w/HCl H2O | 0.041 | 0.098 |
| No HCl and H2O | 0.029 | 0.103 |
In all structures, movements of hydrogen atoms represent the largest changes. This is because much of the diffraction data was obtained from X-ray studies, where hydrogen positions are less accurately known. Movements of non-hydrogen atoms are much smaller ranging from 0.011–0.071 Å. This magnitude of non-hydrogen atom movement is within the expected error of the diffraction structures. Thus, we conclude that the GRANT refinement does not introduce errors in atom positions.
Fig. 3 illustrates that the movement of the waters of hydration are no larger than the movement of other non-hydrogen atoms. This is probably because the waters are hydrogen bonded to 15N sites in both molecules studied and thus cannot move significantly without influencing the 15N tensors. This outcome demonstrates that it is possible to refine positions of hydrate and solvate molecules in cases where these structures are in close proximity to or interacting with the nuclide employed in the refinement. Similar results were obtained for the chloride atoms where only small movements were observed.
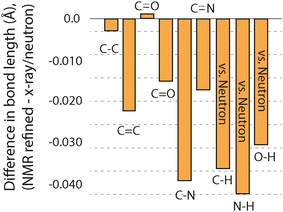
Another metric that can be compared to see if GRANT refinements introduce errors is changes in bond lengths. Such a comparison was made by considering each bond type separately, and the outcome is illustrated in Fig. 4. This plot includes only those bonds where three or more of a given bond type were available. All data for bonds that include hydrogen are taken only from neutron diffraction data. Bond lengths between non-hydrogen atoms combine both X-ray and neutron diffraction values. A more complete comparison is given in Table 4, where all bond types are compared even when only one of a particular type of bond is available.
| Bond type | Source | Average | St. dev. | Max. | Min. |
|---|---|---|---|---|---|
| a Bond order. b The number of bonds included in the comparison. c Includes only bond lengths from the structures where neutron diffraction data are reported. d All O–H bonds are taken from water sites. | |||||
| C–C (1.0a) | Diffraction | 1.508 | 0.024 | 1.548 | 1.479 |
| (n = 12)b | GRANT | 1.505 | 0.025 | 1.541 | 1.459 |
| C–C (2.0a) | Diffraction | 1.352 | 0.009 | 1.358 | 1.342 |
| (n = 3) | GRANT | 1.330 | 0.025 | 1.350 | 1.302 |
| C–O (1.0a) | Diffraction | 1.359 | 0.061 | 1.402 | 1.316 |
| (n = 2) | GRANT | 1.326 | 0.028 | 1.345 | 1.306 |
| C–O (1.5a) | Diffraction | 1.249 | 0.015 | 1.267 | 1.228 |
| (n = 4) | GRANT | 1.250 | 0.016 | 1.262 | 1.227 |
| C–O (2.0a) | Diffraction | 1.229 | 0.011 | 1.244 | 1.204 |
| (n = 5) | GRANT | 1.214 | 0.021 | 1.235 | 1.179 |
| C–N (1.0a) | Diffraction | 1.478 | 0.048 | 1.557 | 1.411 |
| (n = 7) | GRANT | 1.439 | 0.030 | 1.479 | 1.392 |
| C–N (1.5a) | Diffraction | 1.354 | 0.041 | 1.443 | 1.269 |
| (n = 16) | GRANT | 1.337 | 0.033 | 1.398 | 1.286 |
| C–N (2.0a) | Diffraction | 1.421 | 0.015 | 1.431 | 1.410 |
| (n = 2) | GRANT | 1.311 | 0.031 | 1.333 | 1.289 |
| C–N (3.0a) | Diffraction | 1.126 | — | — | — |
| (n = 1) | GRANT | 1.163 | — | — | — |
| C–Hc | Diffraction | 1.086 | 0.020 | 1.104 | 1.033 |
| (n = 11) | GRANT | 1.050 | 0.023 | 1.086 | 1.005 |
| N–Hc | Diffraction | 1.040 | 0.015 | 1.070 | 1.022 |
| (n = 12) | GRANT | 0.998 | 0.016 | 1.027 | 0.977 |
| O–Hc,d | Diffraction | 0.963 | 0.008 | 0.972 | 0.954 |
| (n = 4) | GRANT | 0.934 | 0.005 | 0.941 | 0.930 |
Our prior study of GRANT refinement using 13C data also found that bonds involving non-hydrogen atoms decreased in length.16 This reduction was also observed when DFT-D2* refinement was employed;1 however, GRANT refinement caused smaller decreases than those observed with DFT-D2*. An unexpected outcome is that bonds containing hydrogen atoms also decrease in length by 0.03–0.04 Å. Moreover, the magnitude of the changes in bond lengths involving hydrogen represents three of the four largest changes observed. Prior studies evaluating bond lengths have found that most hydrogen-containing bonds increase in length.1,16 This is observed even when only neutron diffraction data are evaluated and hydrogen atoms are expected to be located with an accuracy comparable to non-hydrogen sites where typical errors in bond length are in the range of ±0.005 Å to ±0.015 Å.8 Thus, the observation of a decrease in bond lengths of the magnitude observed in bonds that include hydrogen is unexpected. One possible explanation is that this decrease arises from the application of a different functional (i.e. PW91) than was employed in our initial 13C refinement study where PBE was employed. Support for the conclusion is found in a prior study employing PW91 (ref. 1) where it was found that N–H bond lengths decreased with DFT-D2* refinement.
To further evaluate the influence of changing the functional on GRANT refinement, the bond lengths obtained from PW91 and PBE refinements were examined. The standard deviation of the C–H, O–H, and N–H bond lengths from PW91 are found to be nearly identical to the standard deviations observed in neutron diffraction data from the same bonds. Moreover, the range of bond lengths obtained from PW91 is very similar to the range found in neutron diffraction data. In contrast, the PBE C–H and O–H bond lengths have a standard deviation nearly twice as large as that observed in neutron diffraction data and a range of bond lengths that is up to 4.3 times larger than the same data obtained from neutron diffraction.16 This more detailed comparison shows that PW91 provides data more consistent with neutron diffraction values and supports the conclusion that the differences observed may arise due to our change of functional. Nevertheless, other factors may also contribute and further study of this difference is warranted.
The comparisons described above provide sufficient data to answer the question of whether the bond length changes created by GRANT refinements produce structures that differ from the original diffraction coordinates by more than the expected errors in the diffraction structures. The errors in bond lengths from diffraction methods at bonds involving non-hydrogen atoms are estimated to range from ±0.005 to ±0.015 Å.8 Because single crystal neutron data was used to compare bonds involving hydrogen atoms, the uncertainty of these bonds is anticipated to be about the same as for non-hydrogen containing bonds. Fig. 4 shows that seven of the nine bond types changed in length by more than the expected error. In the case of C–N, C–H, N–H, and O–H bonds, the change of 0.03–0.04 Å is significantly larger than the error. Thus, the bond length changes represent statistically distinguishable differences between the original diffraction structures and the GRANT-adjusted coordinates.
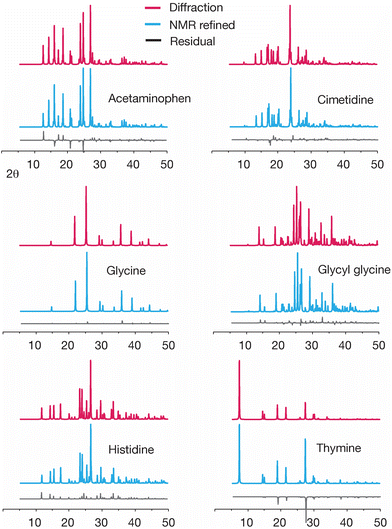
Another way to evaluate changes created by GRANT structural refinement is to examine the predicted powder diffraction patterns. Such a comparison is shown in Fig. 5. An inspection of the powder patterns predicted from diffraction data minus the patterns obtained from the GRANT refined coordinates (i.e. the residuals) indicates that no significant changes to these patterns have been created by the GRANT refinements.
A comparison of lattice energies before and after GRANT refinement could, potentially, also be made but such an analysis is not included here because a careful analysis is lengthy. A detailed discussion of lattice energy calculations will therefore be given elsewhere. However, we note that preliminary calculations verify that these energies don't change significantly due to NMR-guided refinement (i.e. <0.1%). This is consistent with our prior work where it was shown that, although NMR refinement consistently increased lattice energy, the difference was less than 0.02% relative to neutron diffraction structures. It is noteworthy that our previous 13C NMR-guided refinements resulted in structures that were more consistent with the energies of neutron diffraction structures than they were with energies of single crystal X-ray diffraction structures. Indeed, where single crystal X-ray and neutron diffraction structures were both available for a given structure, the neutron structure consistently was found to have a higher lattice energy.
Are GRANT 15N refinements suitable for refining proteins? Analysis of two tripeptides
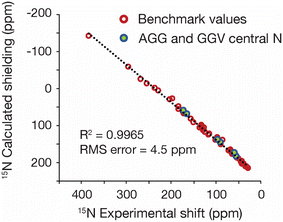
One of the advantages of refining with 15N data is that such information potentially provides a tool for refining proteins and other nitrogen-containing biomolecules. To assess the feasibility of using GRANT for protein refinement, two tripeptides were evaluated. The peptides chosen were AGG hydrate and GGV dihydrate. These structures were selected because highly accurate 15N shift tensor data have been previously reported from single crystal NMR measurements.25 These data are limited to a single 15N labeled site at the central G residue in both structures. Only the three principal values were employed in the refinement to ensure consistency with the benchmark study. Both tripeptides studied have known crystal structures from X-ray diffraction.32,53 However, hydrogen positions in these structures are less accurately known than non-hydrogen positions. To correct this deficiency, a single crystal neutron diffraction structure of AGG was acquired for use in the present study. A detailed description of diffraction data collection and refinement is given in Experimental and as ESI.†Refinement of both peptides was performed using the GRANT method as employed for the benchmark data with all atoms allowed to move. A plot of computed and experimental data after refinement is shown in Fig. 6. The 15N data from the refined tripeptides are statistically indistinguishable from the refined benchmark data. The trendline in Fig. 6 represents a least-squares fit solely to benchmark data while the R2 and RMS error correspond to a combined dataset that includes both benchmark and tripeptide tensor values.
As with the benchmark data, non-NMR metrics were also evaluated for each tripeptide to determine if GRANT refinements introduce errors. A comparison of atom positions in AGG with water omitted showed that only small atom movements occurred upon refinement that were similar in magnitude to those observed in the benchmark data. The inclusion of water revealed that the oxygen atom was essentially unmoved but that larger changes are found in hydrogen positions. All differences are reported in Table 5.
| Structure | rms difference (Å) | |
|---|---|---|
| Non-hydrogen | All atoms | |
| AGG no H2O | 0.049 | 0.069 |
| AGG with H2O | 0.062 | 0.082 |
| GGV no H2O | 0.133 | 0.187 |
| GGV with 2 H2O | 0.136 | 0.268 |
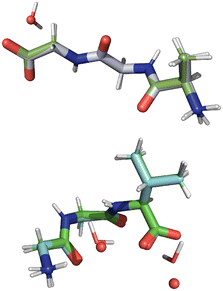
The refined structure of GGV dihydrate showed atom movements more than two times larger than those in AGG. The magnitude these movements is listed in Table 5 where atom positions are compared when water is omitted and included. The inclusion of water increases the errors and demonstrates that the largest movements occur in the water positions. Indeed, one of the waters moves nearly 1 Å upon refinement. Despite these differences, the average changes to non-hydrogen atoms do not deviate enough to be consider in error according to the standard proposed by van de Streek and Nuemann49 (i.e. rmsd > ±0.25 Å). Indeed, it is unlikely that most analysts would consider the refined and unrefined structures to have meaningful differences based on atom positions. An overlay of both tripeptides before and after refinement is given in Fig. 7 where the original diffraction structures are shown with green bonds and the GRANT refined molecules with grey bonds.
It is interesting to speculate on the origin of the larger changes found in GGV versus the benchmark data and AGG. The refinement of GGV dihydrate represents an attempt to refine a structure of 16 non-hydrogen atoms and two waters using only experimental information from a single centrally located 15N site. Specifically, GGV includes only 0.3 15N sites per 100 Å3 while the 15N benchmark dataset included 1.2 15N sites per 100 Å3, on average. The previously reported 13C benchmark data averaged 4.0 13C sites per 100 Å3. The higher density of 1.2 15N sites per 100 Å3 appears to be adequate for higher-quality refinements. Since the chemical shift tensors primarily reflect local structure, the lower 15N site density in GGV is insufficient to constrain the refinement to the degree observed in the benchmark structures. Nevertheless, the structural differences would likely not be considered to be significant by conventional crystallographic metrics49,54 and this comparison demonstrates that the 15N data still act as a constraint, albeit a less rigid one. Because of this difference in site density, the unusually high resolution sought by this approach is only found near the 15N site for which sufficient NMR information density is available. Low site density is much less of a limitation in AGG where three fewer non-hydrogen atoms are present in the peptide moiety and one few water molecule is found. All these differences leave the sole 15N site in AGG within a few Å of nearly all intramolecular atoms and within 4 Å of the water. Overall, these results indicate that when the density of sites providing NMR information is low, this information should only be employed to refine the region local to that site (e.g. within a few Å).
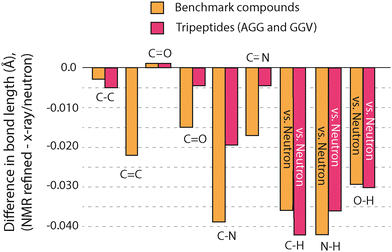
The GRANT refinements of AGG and GGV were further evaluated by examining changes to bond lengths. In nearly all cases, refinements resulted in a decrease in bond lengths involving non-hydrogen atoms. All changes to bond lengths are illustrated in Fig. 8, where a comparison to benchmark compounds is included for comparison. All data for bonds that include hydrogen are taken solely from neutron diffraction data. Bond lengths between non-hydrogen atoms combine both X-ray and neutron diffraction values. A more quantitative comparison is provided in Table 6. Changes to these bonds are consistently in the same direction as was observed in the benchmark structures but are usually smaller in magnitude. In fact, for bonds involving non-hydrogen atoms, only the adjustments to C–N bonds are clearly larger than the estimated error in the diffraction data. It is noteworthy that the reduced 15N site density in the tripeptides results in less movement of non-hydrogen sites rather than larger movements. One interpretation of this favorable outcome is that when an adjustment cannot improve the agreement to experimental NMR data, the sites are not moved significantly.
| Bond type | Source | Average | St. dev. | Max. | Min. |
|---|---|---|---|---|---|
| a Number following bond type denotes bond order. b Number of bonds of the given type included in the comparison. c Includes only bond lengths from the structures where neutron diffraction data were reported. d All O–H bonds reported are taken from water sites. | |||||
| C–C (1.0a) | Diffraction | 1.522 | 0.012 | 1.545 | 1.508 |
| (n = 10)b | GRANT | 1.517 | 0.010 | 1.533 | 1.501 |
| C–C (2.0a) | None present | ||||
| C–O (1.0a) | None present | ||||
| C–O (1.5a) | Diffraction | 1.253 | 0.014 | 1.263 | 1.238 |
| (n = 4)b | GRANT | 1.254 | 0.011 | 1.259 | 1.242 |
C![[double bond, length as m-dash]](https://www.rsc.org/images/entities/char_e001.gif) O (2.0a) O (2.0a) |
Diffraction | 1.229 | 0.010 | 1.243 | 1.221 |
| (n = 4)b | GRANT | 1.225 | 0.007 | 1.231 | 1.216 |
| C–N (1.0a) | Diffraction | 1.462 | 0.020 | 1.486 | 1.442 |
| (n = 6)b | GRANT | 1.443 | 0.018 | 1.469 | 1.425 |
| C–N (1.5a) | Diffraction | 1.325 | 0.010 | 1.337 | 1.316 |
| (n = 4)b | GRANT | 1.321 | 0.006 | 1.328 | 1.314 |
| C–N (2.0a) | None present | ||||
| C–N (3.0a) | None present | ||||
| C–Hc | Diffraction | 1.091 | 0.011 | 1.113 | 1.079 |
| (n = 9)b | GRANT | 1.048 | 0.008 | 1.066 | 1.041 |
| N–Hc | Diffraction | 1.023 | 0.029 | 1.050 | 0.976 |
| (n = 5)b | GRANT | 0.984 | 0.009 | 0.998 | 0.972 |
| O–Hc,d | Diffraction | 0.963 | 0.006 | 0.967 | 0.959 |
| (n = 4)b | GRANT | 0.933 | 0.003 | 0.935 | 0.931 |
In contrast to the small changes in bond lengths that do not involve hydrogen, bonds that include hydrogen atoms change by nearly the same magnitude as benchmark structures. This comparison includes only bonds from AGG where a neutron diffraction structure was available (see Experimental). All reported O–H bonds are obtained from the H2O in AGG and allow for analysis of structure in a non-bonded moiety. It is interesting to speculate on why bonds that include hydrogen experience larger adjustments than bonds between non-hydrogen atoms. Hydrogen atoms naturally occur on the periphery of molecules and will therefore be most likely to experience clashes with neighboring sites during a refinement. We posit that this greater proximity to both intramolecular and intermolecular moieties creates the larger changes observed at hydrogen positions.
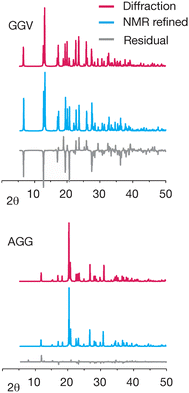
Differences in the simulated powder patterns due to GRANT refinement were also evaluated for AGG and GGV. A comparison of these patterns obtained from the reported X-ray diffraction structure versus the NMR refined structure is given in Fig. 9. The pattern obtained from the refined AGG structure exhibits no significant differences from that obtained from the crystal structure. In contrast, the patterns from refined GGV deviate in peak intensity at numerous peaks. Overall, this comparison indicates that no errors have been created by refinement of AGG, but that the refined GGV shows evidence of errors.
Does improved NMR agreement indicate structural improvements?
One of the basic assumptions in the GRANT refinement is that improvement in the NMR agreement between experimental and computed 15N shift tensors indicates improvement in molecular structure. Although the non-NMR analyses described above indicate that this assumption is valid, it is particularly important to further consider this assumption since all computational methods have errors and it is possible that NMR-guided refinements are simply creating better agreement to a given computational method rather than achieving genuine structural improvements.Early evidence that improved NMR agreement indicates better structural accuracy comes from studies where hydrogen positions were adjusted using computational methods. Refinement of hydrogen positions from single crystal X-ray diffraction studies was justified in this case because coordinates from neutron diffraction studies were available for the same structures and showed that X–H bond lengths from X-ray diffraction were consistently too short by 10–13%.55 An ab initio geometry optimization of only hydrogen positions resulted in X–H bond lengths that matched those from neutron diffraction data within 1%. Notably, the NMR agreement also improved with this structural adjustment. This study thus established a correlation between improvement in NMR agreement and structural improvement.
A second relevant study expanded this type of comparison to include non-hydrogen atoms.8 In this work, structures obtained from X-ray powder diffraction were compared to X-ray single crystal coordinates of the same compounds. This comparison is relevant because coordinates from single crystal data are usually more accurate than those obtained from powder diffraction data. Before structural refinements were performed, the errors in computed 13C shift tensors computed form X-ray powder coordinates had a significantly worse agreement with experimental data than tensor computed from single crystal coordinates. However, a lattice-including computational geometry refinement of powder coordinates resulted in atom positions that more closely matched those from single crystal diffraction. Of equal importance, the NMR agreement for the refined powder diffraction data improved to the point that it was statistically indistinguishable from tensors computed from X-ray single crystal coordinates. This analysis again demonstrates that as atomic positions become more similar to highly accurate values, the NMR agreement improves. Importantly, this analysis explicitly demonstrated that adjustment of the positions of non-hydrogen atoms was a significant contributor to the improved agreement.
Since these initial studies, it has been repeatedly demonstrated that lattice-including geometry refinements that are based on energy minimization consistently improve NMR agreement.1,2,7,8,17 Some of these analyses have also demonstrated that such refinements create structures with coordinates that are more consistent with single crystal neutron diffraction coordinates.7,8,11 Overall, the studies summarized above have established that there is a strong correlation between NMR agreement and structural improvement when energy is used as a metric. At the present time, less is known about the accuracy of structures when NMR agreement is used to refine structures. One useful metric for NMR refined structures is a comparison of the final coordinates to highly accurate structures for the same molecule when such structures are known from an independent diffraction study. For example, our prior study using 13C shift tensors to refine small organic structures found rms differences of 0.056 Å for non-hydrogen positions between NMR derived structures and single crystal diffraction structures.16 This difference is comparable to that observed when the same crystalline phase has been independently solved by multiple analysts using a single crystal. Others have found similar small differences when refining structures using NMR methods.3–6,16 Considering all factors summarized above, it can be concluded that improved agreement between experimental and computed NMR parameters is correlated with structural improvements.
As a final check that GRANT refinement improves structures, the GRANT refined atom positions were employed in a calculation of NMR parameters using a different functional than was employed herein. This comparison is relevant because the new NMR computations use a functional with different errors and a completely different approach to include lattice-fields. Thus, high accuracy in the computed NMR tensors from this second method can be considered to be independent evidence that the GRANT coordinates represent structural improvement.
An independent evaluation of the accuracy of GRANT refined structures
The comparison of bond lengths, movements in atom positions, predicted powder patterns and other factors described above provides compelling evidence for the utility and accuracy of NMR-guided structure refinement. Nevertheless, a further test was performed to verify that crystal structures obtained from GRANT refinement are not impacted by systematic errors in the underlying NMR calculations. Specifically, the influence of systematic errors can be evaluated by performing energy-based geometry optimizations using a dispersion-corrected DFT method different from the PW91 approach used herein (vida supra). The accuracy of computed NMR shift tensors for these relaxed structures can be compared to PW91 data obtained from lattice-including methods. This new evaluation employs a cluster-based method known to be highly accurate and provides an independent metric for evaluating the accuracy of GRANT-refined crystal structures.Highly accurate shift tensors for molecular crystals can be computed at low computational cost using recently developed fragment22,45 and planewave-corrected43,44,56 methods. When hybrid density functionals are included in these computations, the accuracy of the predicted 15N tensors principal components are improved by over 20% relative to conventional planewave techniques.44 Here, we assess the accuracy of both energy optimized and GRANT-refined structures using planewave-corrected and two-body fragment calculations with the PBE0 hybrid density functional. Predicted principal values from GRANT derived structures are compared to tensors obtained from energy-optimization using planewave DFT with the PBE functional and Grimme's D3 dispersion correction.42
Fig. 10 illustrates the rms errors in computed 15N shift tensor principle components for the six benchmark structures. Three refinements are compared including a refinement where only hydrogen atom positions were adjusted, a computation involving refinement of all atoms and a final comparison using the final coordinates from GRANT refinements. The hydrogen-only and all atom adjustments employed planewave DFT (PBE) with D3 dispersion correction in an energy-based calculation. In all cases, geometry optimization was carried out using fixed experimental room temperature lattice parameters to account for thermal expansion effects. The rms errors obtained from traditional planewave calculations (GIPAW/PBE) are shown in red, planewave-corrected results (GIPAW + MC/PBE0) in blue, and two-body fragment results obtained using PCM embedding (Frag./PCM with PBE0) in green.
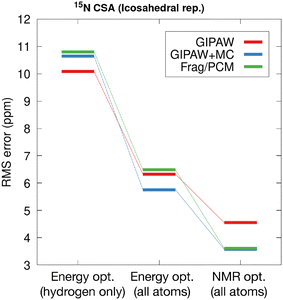 | ||
| Fig. 10 The rms errors for chemical shift tensor principal components for the six benchmark structures listed in Table 1. In the left and center columns, energy-based refinements were performed using DFT (PBE) with D3 dispersion correction, relaxing only hydrogen positions (left), and all atom positions (center). At the right, structures obtained from GRANT NMR-guided refinement are shown. The 15N shift tensors for the planewave-corrected (GIPAW + MC, blue) and fragment-based (Frag./PCM, green) were computed using the PBE0 hybrid density functional. The GIPAW shift tensors were computed using PBE. Fragment/PCM calculations were performed using a 4.0 Å two-body cutoff. | ||
Comparing the rms error for the hydrogen-only optimization (10.1 ppm) in Fig. 10 with the rms error reported in Table 2 using experimental geometries (16.6 ppm) highlights the impact that optimizing hydrogen atoms has on predicted NMR parameters. However, relaxing only hydrogen positions does not improve the predicted tensor values obtained from higher accuracy fragment and planewave-corrected shift tensor calculations. To substantially reduce the error in predicted 15N principal values over hydrogen-only optimization, an all-atom structure refinement (DFT-D3) is required. Interestingly, GIPAW tensor calculations performed on the all-atom DFT-D3 optimized structures using the PBE functional yields a larger error (6.3 ppm) than tensor calculations performed on the DFT-D2* structures obtained using the PW91 density functional (5.2 ppm, see Table 2).
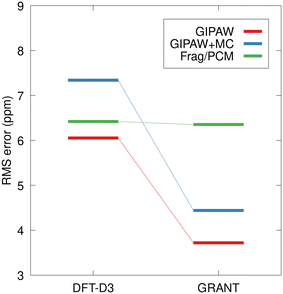
At the right of Fig. 10, it can be seen that GIPAW computed shift tensors for coordinates obtained from GRANT refined structures have a 28% lower rms error than structures obtained using conventional planewave energy-based refinement (DFT-D3). The improvement is even more pronounced for planewave-corrected and fragment-based calculations, with a 35% and 44% reduction in rms error, respectively. The percent improvement in accuracy for fragment and planewave-corrected methods relative to planewave is comparable in magnitude to previous findings.44 However, the 3.6 ppm test set rms error obtained for the GRANT-optimized structures represents a 37% improvement in accuracy relative to previous work. It is notable that NMR tensors computed in the lower right of Fig. 10 represent GRANT coordinates but include 15N tensors obtained with the PBE0 functional. In the original refinement, the PW91 tensor computations gave an error of 4.5 ppm (Table 2). The fact that a different functional (PBE0) with different systematic errors than PW91 is also found to have a decreased error (3.6 ppm) relative to energy-refined coordinates is consistent with the conclusion that structure has improved. This conclusion is based on prior work where a decrease in error has been found to correspond to structural improvement.8,17 This result suggests that at least part of the difficulty in computing highly accurate 15N shift tensors is due to inaccuracies in the structures. This is effect is less noticeable in 13C tensors due their lower sensitivity to structure.17
The present study focuses on well-established benchmark structures and broader applications of GRANT structural refinement rely on the transferability of linear regression parameters (e.g.Table 2) to structures not included in the benchmark data. The tripeptides AGG and GGV provide excellent test cases to evaluate the transferability of regression parameters and the relative performance of the alternative methods. Fig. 11 compares the rms error in predicted shift tensor values for the 15N in the central amino acid for the AGG and GGV tripeptides. The rms errors for structures not included in the benchmark dataset have the potential to be larger than those observed for benchmark data. In the case of the all-atom energy-optimized structures (DFT-D3), the error for the tripeptides agrees with the test set rms error (Fig. 10) within the experimental uncertainty for both planewave and fragment-based calculations. The errors observed for planewave-corrected calculations are larger for the tripeptide, but within the expected range.
In the case of the GRANT-optimized structures, the rms errors for the calculations involving the tripeptides using planewave DFT (GIPAW) and the planewave-corrected approach agree with the training set values within the experimental uncertainty. Interestingly, the rms error for the fragment/PCM calculations on the tripeptides is 2.7 ppm larger than the corresponding error for the training set. Nevertheless, Fig. 11 clearly demonstrates that GRANT optimization yields predicted tensor values for the tripeptides that either match (Frag./PCM) or improve upon (GIPAW, GIPAW + MC) the accuracy of previous 15N benchmark studies. Although the tripeptide rms errors are largest for Frag./PCM calculations (6.3 ppm), these errors are well within expectations, and they are particularly promising given that Frag./PCM calculations may be applied to both periodic and non-periodic systems such as proteins.
Conclusions
The NMR benchmark refinements considered herein demonstrate that, although 15N sites are typically less densely represented than 13C positions, their higher sensitivity results in the ability to effectively guide crystal structure refinements. In the structures considered, GRANT 15N refinement with conventional GIPAW computed tensors reduces error in computed tensors by 14% versus the DFT-D2* method alone, an approach regarded as highly accurate. This result is particularly notable because GRANT refinement differs from the DFT-D2* approach only in that it considers several new atom positions versus those obtained from an initial DFT-D2* geometry optimization. Notably, there is no difference how tensors are computed in GRANT and DFT-D2*. Thus, the improvements in NMR agreement suggest that at least some of the error in computed 15N data comes from inaccurate coordinates and that this shortcoming is correctable. When different lattice-including tensor computation methods (i.e. fragment or GIPAW with molecular correction) are considered, the improvement is even larger with improvement of 44% in the best case.As with our prior 13C refinements,16 other metrics were also considered to assess the structural changes from refinement and these measures generally support the conclusion that GRANT refinements do not introduce errors. Specifically, for the benchmark structures, atom movements from refinement are small with the average change to non-hydrogen atom positions of 0.040 Å. This closely matches atom movements from 13C-based refinement where non-hydrogen sites moved by 0.056 Å. Both of these values are below the diffraction limit for typical X-ray radiation and thus would not be detectable by diffraction. Changes in simulated X-ray powder diffraction patterns from the GRANT refinement of benchmark structures are also negligible.
Intriguingly, the changes in bond lengths in both non-hydrogen-containing bonds and bonds that include hydrogen both decrease by an amount larger than the expected error in diffraction data. Moreover, bonds containing hydrogen atoms decrease by nearly twice the amount of bonds between non-hydrogen sites. In most cases, the bond lengths predicted by GRANT represent a different statistical population than those reported from diffraction studies. Accordingly, bond length changes represent a significant, but small, change from the diffraction structures, and further study is needed to determine whether this difference represents introduction of a systematic error or a needed correction to bond lengths.
One notable conclusion from the present study is that the GRANT refinements do not result in any significant structural changes. Accordingly, it is important to ask if these methods are capable of correcting structural errors when they occur. This issue has been examined elsewhere16 where it was demonstrated that NMR refinement methods, similar to those employed here, have been utilized to correct structural errors in several crystal structures. In the present study, no significant structural errors were present in benchmark structures because it was deemed necessary to select well-established and highly accurate diffraction structures in order to evaluate the proposed methodology. In the more general case where structural errors in crystal structures are possible, prior work indicates that it is feasible to detect and correct structural errors.
An application of the GRANT refinement to the tripeptides AGG and GGV was explored to evaluate the feasibility of eventually refining proteins with these methods. Refinement of both AGG and GGV followed the same patterns as benchmark data (e.g. number of iterations) and resulted in a close agreement between experimental and computed 15N tensors that was statistically indistinguishable from benchmark structures. However, the 15N site density in AGG and GGV is four times lower than the density found in the benchmark compounds because of the unusual 15N labeling scheme employed.25 This difference resulted in larger atom movements and greater discrepancies in the powder pattern of GGV than were observed in the benchmark compounds. This site density limitation is likely less relevant in uniformly 15N labeled proteins if only backbone atoms are considered. In this case, site density will be closer to the benchmark compounds, and applications of the proposed methodology to protein backbones appear to be within the scope of the GRANT method.
Finally, the GRANT-optimized structures were evaluated using recently developed high-accuracy methods for computing shift tensors in both periodic and non-periodic systems.44 The GRANT optimization is shown to improve agreement between predicted and computed 15N tensor values when compared to 15N tensors computed using both experimental geometries and energy-based structure optimization. This outcome lends further support to the conclusion that GRANT refinement represents genuine structural improvements. In addition, the transferability of the linear regression parameters obtained using GRANT optimization was established using the tripeptides AGG and GGV. Overall, combining NMR-based structure refinements with fragment-based NMR calculations represents a promising path toward future applications involving protein structural refinement.
Conflicts of interest
There are no conflicts to declare.Acknowledgements
We gratefully acknowledge the Institut Laue Langevin for the provision of beam time. Research at Oak Ridge National Laboratory was supported by the Scientific User Facilities Division, Office of Basic Energy Sciences, U.S. Department of energy. The work was supported, in part, by the National Science Foundation under CHE-2016185 to J. K. H. and CHE-2100582 to M. A. M.References
- S. T. Holmes, R. J. Iuliucci, K. T. Mueller and C. Dybowski, J. Chem. Phys., 2017, 146, 064201 CrossRef PubMed.
- D. A. Hirsh, S. T. Holmes, P. Chakravarty, A. A. Peach, A. G. DiPasquale, K. Nagapudi and R. W. Schurko, Cryst. Growth Des., 2019, 19, 7349–7362 CrossRef CAS.
- U. Sternberg and R. Witter, J. Biomol. NMR, 2019, 73, 727–741 CrossRef CAS PubMed.
- D. H. Brouwer, J. Am. Chem. Soc., 2008, 130, 6306–6307 CrossRef CAS PubMed.
- B. J. Wylie, C. D. Schwieters, E. Oldfield and C. M. Rienstra, J. Am. Chem. Soc., 2009, 131, 985–992 CrossRef CAS PubMed.
- F. A. Perras and D. L. Bryce, J. Phys. Chem. C, 2012, 116, 19472–19482 CrossRef CAS.
- J. C. Johnston, R. J. Iuliucci, J. C. Facelli, G. Fitzgerald and K. T. Mueller, J. Chem. Phys., 2009, 131, 144503 CrossRef PubMed.
- J. K. Harper, R. Iuliucci, M. Gruber and K. Kalakewich, CrystEngComm, 2013, 15, 8693–8704 RSC.
- S. T. Holmes, O. G. Engl, M. N. Srnec, J. D. Madura, R. Quinones, J. K. Harper, R. W. Schurko and R. J. Iuliucci, J. Phys. Chem. A, 2020, 124, 3109–3119 CrossRef CAS PubMed.
- J. Powell, K. Kalakewich, F. J. Uribe-Romo and J. K. Harper, Phys. Chem. Chem. Phys., 2016, 18, 12541–12549 RSC.
- L. Wang, F. J. Uribe-Romo, L. J. Mueller and J. K. Harper, Phys. Chem. Chem. Phys., 2018, 20, 8475–8487 RSC.
- F. A. Perras, I. Korobov and D. L. Bryce, CrystEngComm, 2013, 15, 8727–8738 RSC.
- I. Jakovkin, M. Klipfel, C. Muhle-Goll, A. S. Ulrich, B. Luy and U. Sternberg, Phys. Chem. Chem. Phys., 2012, 14, 12263–12276 RSC.
- B. J. Wylie, L. J. Sperling, A. J. Nieuwkoop, W. T. Franks, E. Oldfield and C. M. Reinstra, Proc. Natl. Acad. Sci. U. S. A., 2011, 108, 16974–16979 CrossRef CAS PubMed.
- U. Sternberg and R. Witter, J. Biomol. NMR, 2015, 63, 265–274 CrossRef CAS PubMed.
- L. Wang and J. K. Harper, CrystEngComm, 2021, 23, 7061–7071 RSC.
- K. Kalakewich, R. Iuliucci, K. T. Mueller, H. Eloranta and J. K. Harper, J. Chem. Phys., 2015, 143, 194702 CrossRef PubMed.
- L. Wang, A. B. Elliott, S. D. Moore, G. J. O. Beran, J. D. Hartman and J. K. Harper, ChemPhysChem, 2021, 22, 1008–1017 CrossRef CAS PubMed.
- R. K. Harris and B. E. Mann, NMR and the Periodic Table, Academic Presss, University of Michigan, 1978 Search PubMed.
- E. Oldfield, Annu. Rev. Phys. Chem., 2002, 53, 349–378 CrossRef CAS PubMed.
- E. Oldfield, J. Biomol. NMR, 1995, 5, 217–225 CrossRef CAS PubMed.
- H. B. Lee and E. Oldfield, J. Phys. Chem., 1996, 100, 16423–16428 CrossRef.
- J. Kraus, R. Gupta, M. Lu, A. M. Gronenborn, M. Akke and T. Polynova, ChemPhysChem, 2020, 21, 1436–1443 CrossRef CAS PubMed.
- J. D. Hartman and G. J. O. Beran, Solid State NMR, 2018, 96, 10–18 CrossRef CAS PubMed.
- S. E. Soss, P. F. Flynn, R. J. Iuliucci, R. P. Young, L. J. Mueller, J. Hartman, G. J. O. Beran and J. K. Harper, ChemPhysChem, 2017, 18, 2225–2232 CrossRef CAS PubMed.
- L. Wang, A. B. Elliott, S. D. Moore, G. J. O. Beran, J. D. Hartman and J. K. Harper, ChemPhysChem, 2021, 22, 1008–1017 CrossRef CAS PubMed.
- K. W. Waddel, E. Y. Chekmenev and R. J. Wittebort, J. Am. Chem. Soc., 2005, 127, 9030–9035 CrossRef PubMed.
- R. J. Cernik, A. K. Cheetham, C. K. Prout, D. J. Watkin, A. P. Wilkinson and B. T. M. Willis, J. Appl. Crystallogr., 1991, 24, 222 CrossRef CAS.
- L. J. W. Shimon, M. Lahav and L. Leiserowitz, Nouv. J. Chem., 1986, 10, 723 CAS.
- K. Oda and H. Koyama, Acta Crystallogr., Sect. B: Struct. Crystallogr. Cryst. Chem., 1972, 28, 639 CrossRef CAS.
- G. Portalone, L. Bencivenni, M. Colapietro, A. Pieretti and F. Ramondo, Acta Chem. Scand., 1999, 53, 57 CrossRef CAS.
- M. Haisa, S. Kashino, R. Kawai and H. Maeda, Acta Crystallogr., Sect. B: Struct. Crystallogr. Cryst. Chem., 1976, 32, 1283 CrossRef.
- T. F. Koetzle, W. C. Hamilton and R. Parthasarathy, Acta Crystallogr., Sect. B: Struct. Crystallogr. Cryst. Chem., 1972, 28, 2083–2090 CrossRef CAS.
- V. Lalitha and E. Subramanian, Int. J. Pept. Protein Res., 1984, 24, 437–441 CrossRef CAS PubMed.
- G. McIntyre, M. Lemée-Cailleau and C. Wilkinson, Phys. B, 2006, 385–386, 1055–1058 CrossRef CAS.
- C. Wilkinson, J. A. Cowan, D. A. A. Myles, F. Cipriani and G. J. McIntyre, J. Neutron Res., 2006, 13, 37–41 Search PubMed.
- J. W. Campbell, Q. Hao, M. M. Harding, N. D. Nguti and C. Wilkinson, J. Appl. Crystallogr., 1998, 31, 496–502 CrossRef CAS.
- C. Wilkinson, H. W. Khamis, R. F. D. Stansfield and G. J. Mcintyre, J. Appl. Crystallogr., 1988, 21, 471–478 CrossRef.
- S. Arzt, J. W. Campbell, M. M. Harding, Q. Hao and J. R. Helliwell, J. Appl. Crystallogr., 1999, 32, 554–562 CrossRef CAS.
- P. R. Evans, Joint CCP4 and ESF-EAMCB Newsletter on Protein Crystallography, 1997, vol. 33, pp. 22–24 Search PubMed.
- G. M. Sheldrick, Acta Crystallogr., Sect. C: Struct. Chem., 2015, 71, 3–8 Search PubMed.
- V. F. Sears, J. Neutron Res., 1992, 3, 26 CrossRef.
- P. Giannozzi, S. Baroni, N. Bonini, M. Calandra, R. Car, C. Cavazzoni, D. Ceresoli, G. L. Chiarotti, M. Cococcioni, I. Dabo, A. Dal Corso, S. de Gironcoli, S. Fabris, G. Fratesi, R. Gebauer, U. Gerstmann, C. Gougoussis, A. Kokalj, M. Lazzeri, L. Martin-Samos, N. Marzari, F. Mauri, R. Mazzarello, S. Paolini, A. Pasquarello, L. Paulatto, C. Sbraccia, S. Scandolo, G. Sclauzero, A. P. Seitsonen, A. Smogunov, P. Umari and R. M. Wentzcovitch, J. Phys.: Condens. Matter, 2009, 21, 395502 CrossRef PubMed.
- S. Grimme, J. Antony, S. Ehrlich and H. Krieg, J. Chem. Phys., 2010, 132, 154104 CrossRef PubMed.
- M. Dracínsky, P. Unzueta and G. J. Beran, Phys. Chem. Chem. Phys., 2019, 21, 14992–15000 RSC.
- J. D. Hartman and J. K. Harper, Solid State NMR, 2022, 122, 101832 CrossRef CAS PubMed.
- J. D. Hartman and G. J. O. Beran, J. Chem. Theory Comput., 2014, 10, 4862–4872 CrossRef CAS PubMed.
- M. H. Sherwood, D. W. Alderman and D. M. Grant, J. Magn. Reson., 1989, 84, 466–489 CAS.
- F. Liu, C. G. Phung, D. W. Alderman and D. M. Grant, J. Am. Chem. Soc., 1996, 118, 10629–10634 CrossRef CAS.
- D. W. Alderman, M. H. Sherwood and D. M. Grant, J. Magn. Reson., Ser. A, 1993, 101, 188–197 CrossRef CAS.
- J. van de Streek and M. A. Neumann, Acta Crystallogr., Sect. B: Struct. Sci., 2010, 66, 544–558 CrossRef CAS PubMed.
- G. A. Jeffery, An Introduction to Hydrogen Bonding, Oxford University Press, Oxford, UK, 1997 Search PubMed.
- V. Lalitha, E. Subramanian and J. Bordner, Indian J. Pure Appl. Phys., 1985, 23, 506 CAS.
- C. M. Widdifield, J. D. Farrell, J. C. Cole, J. A. K. Howard and P. Hodgkinson, Chem. Sci., 2020, 11, 2987–2992 RSC.
- F. Liu, A. M. Orendt, D. W. Alderman and D. M. Grant, J. Am. Chem. Soc., 1997, 119, 8981–8984 CrossRef CAS.
- T. Nakajima, Chem. Phys. Lett., 2017, 677, 99–106 CrossRef CAS.
Footnote |
| † Electronic supplementary information (ESI) available. CCDC 2337938. For ESI and crystallographic data in CIF or other electronic format see DOI: https://doi.org/10.1039/d4ce00237g |
| This journal is © The Royal Society of Chemistry 2024 |

