Effect of halide solid solution on the structure, phase transition behaviour and dielectric properties of dabcoH+ chains†
Yuki
Ohishi
a,
Kohei
Sambe
 b,
Shun
Dekura
 bc,
Tomoyuki
Akutagawa
 bc,
Atsuko
Masuya-Suzuki
 ad and
Ryo
Tsunashima
 *ad
*ad
aGraduate School of Sciences and Technology for Innovation, Yamaguchi University, Yoshida 1677-1, Yamaguchi, 753-8512, Japan. E-mail: ryotsuna@yamaguchi-u.ac.jp
bGraduate School of Engineering, Tohoku University, Sendai 980-8577, Japan
cInstitute of Multidisciplinary Research for Advanced Materials (IMRAM), Tohoku University, Sendai 980-8577, Japan
dChemistry Course, Faculty of Science, Yamaguchi University, Yoshida 1677-1, Yamaguchi, Japan
First published on 10th June 2024
Abstract
1,4-Diazabicyclo[2.2.2]octane (dabco) forms one-dimensional chains through intermolecular N–H+⋯N hydrogen bonds and exhibits ferroelectricity originating from proton transfer. The size of the polarized domain differs depending on the size, symmetry, and polarizability of the counter anions. Herein, two binary halide solid solutions of dabcoHBr mixed with dabcoHCl (ClBr) and dabcoHI (BrI) were prepared, and the temperature dependence of the single crystal structure and the phase transition behaviour were investigated. The solid solution of ClBr contained 3% Cl− in dabcoHBr; thus, the lattice length, space group, and volume were similar to those of dabcHBr. The phase transition temperature from the hydrogen-bonded structure to the ion-pair structure decreased from 458 to 440 K upon mixing with Cl−. In contrast, solid solution BrI was formed with all proportional solid solutions, and the crystallographic parameters characterised by single-crystal X-ray diffraction (XRD) analysis obeyed Vegard's law. Phase transition behaviours were investigated for single crystals of Br![[thin space (1/6-em)]](https://www.rsc.org/images/entities/char_2009.gif) :
:![[thin space (1/6-em)]](https://www.rsc.org/images/entities/char_2009.gif) I = 8
I = 8![[thin space (1/6-em)]](https://www.rsc.org/images/entities/char_2009.gif) :
:![[thin space (1/6-em)]](https://www.rsc.org/images/entities/char_2009.gif) 2 (Br0.80I0.20) via temperature-variable single crystal XRD analysis. A new structural range was observed between 251–373 K. Within this range, the intermolecular N–H+⋯N hydrogen bonds were weakened. This was also a ferroelectric phase similar to that of the original dabcoHBr. In the high-temperature range, a phase transition from the hydrogen-bonded phase to the ion-pair phase was observed at 435 K, which was lower than the 458 K of dabcoHBr.
2 (Br0.80I0.20) via temperature-variable single crystal XRD analysis. A new structural range was observed between 251–373 K. Within this range, the intermolecular N–H+⋯N hydrogen bonds were weakened. This was also a ferroelectric phase similar to that of the original dabcoHBr. In the high-temperature range, a phase transition from the hydrogen-bonded phase to the ion-pair phase was observed at 435 K, which was lower than the 458 K of dabcoHBr.
Introductions
The characteristics of ferroelectric materials, which include piezoelectric, pyroelectric, and nonlinear optical properties, facilitate their application in memory, capacitors, and thermal sensors.1–3 However, metal-containing ferroelectrics often include metals that are harmful to the environment and human health, such as lead zirconate titanate (PZT) and barium titanate (BTO). Macroscopic ferroelectrics originate from a uniform arrangement of dipole moments. Conversely, relaxor ferroelectrics are another type of ferroelectric material that exhibits nanoscale domains. Polarized domains are formed at the mesoscopic scale and grow under an applied electric field.4–8 They exhibit high dielectric and piezoelectric properties and broad temperature–frequency dispersions. These materials have been used in energy storage devices and piezoelectric actuators. Relaxor ferroelectrics are often observed in metal-containing perovskite-type composite oxides with an A(BB′)O3 chemical formula, where A, B and B′ are Pb, low valence state metal ions and d0 transition metal, respectively.9–12 Therefore, an understanding of metal-containing relaxor ferroelectrics is being developed with design guidelines based on the characteristics of metals.Metal-free ferroelectrics composed of organic molecules and/or halides are lightweight, safer for humans and the environment, and easily processed.13–18 The mechanism of ferroelectricity in metal-free ferroelectrics differs from the displacement of atoms from centrosymmetric positions in metal-containing ferroelectrics. In contrast, metal-free ferroelectrics include orientational polarization of the molecules by inverting their orientation via an outer electric field and displacing the proton in the hydrogen bond at appropriate interatomic distances.
Several hydrogen-bonded ferroelectrics, such as dabcoHA (A = BF4−, ClO4−, ReO4−), dabco = 1,4-diazabicyclo[2.2.2]octane,19–21 have been shown to exhibit large polarization comparable to those of metal-containing ferroelectrics at room temperature.22–27 The counter anions, A−, are distributed within the space of the hydrogen-bonded dabcoH+ chains and bridging them (Fig. 1). The proton transfer in hydrogen bonding, as well as the orientation and ionic polarization of A− are components of the ferroelectric mechanism. DabcoHX (X = Br−, I−) contains spherical anions and exhibits a different polarization order to that of dabcoHA.28,29 Dabco forms a one-dimensional chain; however, its order is short-ranged and formed with weak electronic polarizations of anions. Therefore, dabcoHX is a relaxor ferroelectric with proton transfer.28–30 Mono-salts consisting of dabcoH+ form a polarization order owing to the size, polarizability, and symmetry of the anion.
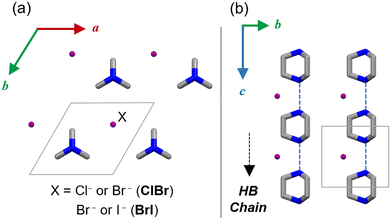 | ||
| Fig. 1 Crystal structure of dabcoHX in (a) ab and (b) bc planes (C: grey, N: blue and halides X: purple). H atoms are omitted for clarity. | ||
Solid solutions are formed by the homogeneous mixing of two or more components to produce a single solid phase, such as the relaxor ferroelectrics of A(BB')O3 previously described. The Curie temperature, polarization, and dielectric constant of a metal-containing solid solution are controlled by its composition. In addition, a morphotropic phase boundary (MPB) is observed when crystals with different symmetries are used in solid solutions. Physical properties such as the dielectric and piezoelectric constants exhibited anomalous behaviour at the MPB.31–34
Solid solutions of molecular crystals are often substitutional solid solutions of isomorphic structures, for example, replaced by a molecule with the same family of elements. The phase transition behaviour and molecular motility in the crystals are less dependent on the composition. However, there are examples of molecular crystalline solid solutions whose phase transition behaviours and molecular mobilities are composition-dependent;35–39 for example, solid solutions partially substituted with different halogens. CM (cyclohexylmethylammonium) salts undergo a phase transition at a temperature that depends on composition.40 Furthermore, a previous study showed high piezoelectricity with (TMFM)x(TMCM)1−xCdCl3 (TMFM = trimethylfluoromethyl ammonium, TMCM = trimethylchloromethyl ammonium).41
Differently from the inorganic relaxor, solid solution of the molecular-based metal-free relaxor has not been developed yet. This study focuses on the structure and phase transition behaviour of halide solid solutions of dabcoH+ salts. The inorganic relaxer ferroelectrics have developed with solid solutions of varieties of metals. However, molecular crystals often lack diversity in structure and properties. This arises from the fact that molecular solid solution is obtained from isostructural pares whose structure and properties are similar.36 In this study, we succeeded in crystallizing the halide solid solution of the dabco-based metal-free relaxer and unveiled composition dependence on the structures, phase transition behaviours, and ferroelectricity.
Results and discussion
Preparation and composition determination of solid solutions ClBr and BrI
The isolation of crystallised dabcoHX from an aqueous solution of a 1![[thin space (1/6-em)]](https://www.rsc.org/images/entities/char_2009.gif) :
:![[thin space (1/6-em)]](https://www.rsc.org/images/entities/char_2009.gif) 1 mixture of dabco with acid HX has been demonstrated.28 This was followed by the experimental procedures for ClBr and BrI, wherein acids HBr and HX (HX = HCl or HI) were mixed at a ratio of x′ which is the experimental mixing ratio of HBr to HI. Good-quality single crystals suitable for single-crystal XRD environments were isolated after slow solvent evaporation by keeping the solution in the atmosphere for several days. Furthermore, scanning electron microscopy-energy dispersive X-ray spectroscopy (SEM-EDS) mapping showed the uniform dispersion of both halogens within the crystal (Fig. S1†).
1 mixture of dabco with acid HX has been demonstrated.28 This was followed by the experimental procedures for ClBr and BrI, wherein acids HBr and HX (HX = HCl or HI) were mixed at a ratio of x′ which is the experimental mixing ratio of HBr to HI. Good-quality single crystals suitable for single-crystal XRD environments were isolated after slow solvent evaporation by keeping the solution in the atmosphere for several days. Furthermore, scanning electron microscopy-energy dispersive X-ray spectroscopy (SEM-EDS) mapping showed the uniform dispersion of both halogens within the crystal (Fig. S1†).
The solid solution ratio of the halide ions was estimated using elemental analysis of carbon, hydrogen, and nitrogen (CHN). The relationship between the experimental mixing ratio, x′, and the solid solution ratio determined experimentally, x, is shown in Fig. 2. Regarding the solid solution ClBr, no proportional relationship was observed between them. In solid solution ClBr with a high composition of Cl−, the concentration of Br− was approximately 7% (referred to as Cl0.93Br0.07). Contrary to Cl− rich ClBr, Cl− in ClBr with a high composition of Br− was approximately 3% (referred to as Cl0.03Br0.97). The low miscibility of Cl− and Br− occurs because of the differences between the structure of the end-members. DabcoH+ interacts with Cl− in the crystal of dabcoHCl to produce an ion-pairing structure.42 A hydrogen-bonded chain structure is observed in dabcoHCl trihydrate.42 The PXRD diffraction pattern of the Cl0.93Br0.07 solid solution corresponded to that of (dabcoHCl)·3H2O. Conversely, the Cl0.03Br0.97 corresponded to the diffraction pattern of dabcoHBr consisting of hydrogen-bonded chains (Fig. S2†).
A linear relationship was observed between the mixing ratio of the solid solution BrI and the composition ratio of the crystal. The components were mixed at all proportions, which is typical for all proportional solid solutions. BrI is highly miscible because of the isomorphism of dabcoHBr and dabcoHI.
Crystallographic study and phase transition behaviour of ClBr
Single crystals of the solid solution Cl0.03Br0.97 were isolated for SC-XRD at 298 K. Cl0.03Br0.97 was crystallised with space group P![[6 with combining macron]](https://www.rsc.org/images/entities/char_0036_0304.gif) m2, which was the same as that of dabcoHBr (Fig. S3†). The lattice constants, a and c, and lattice volume were 6.6645(5), 5.3238(4) Å, and 204.78(3) Å3, respectively. Therefore, the crystal structure of solid solution Cl0.03Br0.97 was not significantly different from that of dabcoHBr43 (6.6650(10), 5.3130(10) Å, and 204.40(6) Å3).
m2, which was the same as that of dabcoHBr (Fig. S3†). The lattice constants, a and c, and lattice volume were 6.6645(5), 5.3238(4) Å, and 204.78(3) Å3, respectively. Therefore, the crystal structure of solid solution Cl0.03Br0.97 was not significantly different from that of dabcoHBr43 (6.6650(10), 5.3130(10) Å, and 204.40(6) Å3).
DabcoHBr underwent a two-step phase transition when heated at 458 K and 471 K.28 The first transition at 458 K corresponded to the breaking of hydrogen bonds; the N–H+⋯N hydrogen-bonded chain structure (phase III) was transited to the ion-pair structure with NH+⋯Br− (phase II). At 471 K, another hydrogen bond was formed between the methylene moiety and bromide (phase I). The structural phase transition behaviour of Cl0.03Br0.97 was investigated by differential scanning calorimetry (DSC) (Fig. 2(c)). The corresponding two-step phase transition was observed in the solid solution Cl0.03Br0.97, whereas phase transition temperature from phase III to phase II was decreased to 440 K from 458 K for dabcoHBr, indicating decreases in transition enthalpy (ΔH). According to the relationship ΔH = TΔS for a phase transition, and given that the transition entropy (ΔS) is comparable to dabcoHBr and Cl0.03Br0.97, ΔH is expected to decrease with addition of Cl−. The estimated ΔH was 4.6 kJ mol−1, a slight decrease from 5.1 kJ mol−1 for dabcoHBr.28
The subsequent heating of the ion-pair phase II resulted in a further transition at 481 K; ΔH and ΔS were 3.5 kJ mol−1 and 7.2 J mol−1 K−1, respectively. Whereas, the cooling process exhibited a thermal anomaly characterized by a single-step broad peak at 438 K with ΔH = 3.7 kJ mol−1, which is lower than the sum of ΔH for heating process. PXRD pattern at 298 K after heating at 500 K was identical to that of phase III, indicating a reversible phase transition process between hydrogen bonding phase and ion-pair phase (Fig. S4†). It was suggested that the decrease in ΔH is due to a phase transition, which involves a gradual change in structure, such as a second-order type phase transition.
Crystallographic study of BrI
The high quality of BrI solid solution crystals allowed for SC-XRD analysis across all compositions. The temperature and composition dependence of the structure were evaluated between 112–373 K. The crystallographic data of x = 0.19, 0.27, 0.64, 0.74, 0.80, 0.90 and 0.95 at 298 K are summarised in Table 1. The crystal structures of the solid solutions with all compositions were isomorphic to dabcoHBr and dabcoHI. The Br-to-I ratio estimated from the occupancy, which was optimised by crystallographic analysis, showed good agreement with the ratio obtained from elemental analysis (Table S1†).| Compound | Br 0.19 I 0.81 | Br 0.27 I 0.73 | Br 0.64 I 0.36 | Br 0.74 I 0.26 | Br 0.80 I 0.20 | Br 0.90 I 0.10 | Br 0.95 I 0.05 |
|---|---|---|---|---|---|---|---|
| Formula | C6H13N2Br0.19I0.81 | C6H13N2Br0.27I0.73 | C6H13N2Br0.64I0.36 | C6H13N2Br0.74I0.26 | C6H13N2Br0.80I0.20 | C6H13N2Br0.90I0.10 | C6H13N2Br0.95I0.05 |
| Crystal system | Hexagonal | ||||||
| Space group |
P![[6 with combining macron]](https://www.rsc.org/images/entities/char_0036_0304.gif) m2 m2 |
||||||
| a, Å | 7.0554(4) | 6.9445(9) | 6.8337(5) | 6.8015(6) | 6.7541(6) | 6.6949(4) | 6.6793(6) |
| c, Å | 5.3473(3) | 5.3334(5) | 5.3349(3) | 5.3298(4) | 5.3383(4) | 5.3265(4) | 5.3178(5) |
| V, Å3 | 230.54(3) | 222.75(6) | 215.76(3) | 213.53(4) | 210.90(4) | 206.76(3) | 205.46(4) |
| Z | 1 | ||||||
| ρ calc, g cm−3 | 1.665 | 1.695 | 1.616 | 1.597 | 1.594 | 1.589 | 1.580 |
| Reflections collected | 1334 | 809 | 1547 | 803 | 1246 | 778 | 1234 |
| Independent reflections | 245 | 218 | 240 | 224 | 231 | 212 | 225 |
| Data/restraints/parameters | 245/0/11 | 218/0/11 | 240/0/12 | 224/0/11 | 231/0/12 | 212/0/11 | 225/0/11 |
| Goodness of fit on F2 | 1.097 | 1.081 | 1.077 | 1.206 | 1.114 | 1.240 | 1.080 |
| Final R indices [I ≥ 2σ(I)] | R 1 = 0.0141 | R 1 = 0.0263 | R 1 = 0.0525 | R 1 = 0.0436 | R 1 = 0.0389 | R 1 = 0.0155 | R 1 = 0.0314 |
| wR2 = 00353 | wR2 = 0.0667 | wR2 = 0.1272 | wR2 = 0.1136 | wR2 = 0.0930 | wR2 = 0.0427 | wR2 = 0.0717 | |
| Final R indices [all data] | R 1 = 0.0141 | R 1 = 0.0263 | R 1 = 0.0533 | R 1 = 0.0436 | R 1 = 0.0394 | R 1 = 0.0155 | R 1 = 0.0327 |
| wR2 = 0.0353 | wR2 = 0.0667 | wR2 = 0.1275 | wR2 = 0.1136 | wR2 = 0.0933 | wR2 = 0.0427 | wR2 = 0.0723 | |
| Temperature, K | 298 | ||||||
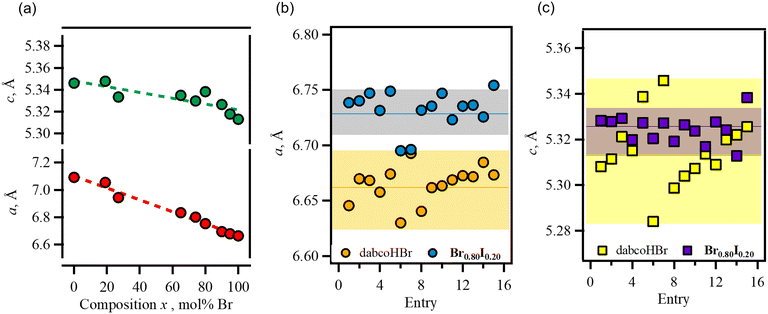
Fig. 3(a) shows a plot of the a-axis length (⊥ hydrogen bonding) and c-axis length (// hydrogen bonding) versus composition. In dabcoHBr and dabcoHI, the difference in the ionic radii of the counter anions ware appeared in those of a-axis lengths, which corresponded to the distance between the hydrogen-bonded chains. The dependence of the a- and c-axis lengths on composition was linear and followed Vegard's law.
Both of dabcoHBr and Br0.80I0.20 had distribution in crystallographic data (Fig. 3(b and c)). For dabcoHBr, the 2σ ranges (97%) for the lattice lengths a and c were 6.6323–6.6975 and 5.2846–5.3454, respectively. Those of Br0.80I0.20 were comparable; 6.7151–6.7495 and 5.3184–5.3308. Thus, distribution observed in Br0.80I0.20 is not originated from heterogeneousity in ratio of Br− and I−, rather intrinsic differences. A single crystal of Br0.80I0.20 which has the largest a-axis (entry 15) was used to evaluate temperature-dependence between 112–373 K (Table S3†).
The temperature dependence of the lattice constant of the end-member dabcoHBr was reported by Szafrański et al.28 The a- and c-axis lengths exhibited a linear increase as the temperature increased from 95 to 400 K (phase III). However, the temperature dependence of the lattice length in Br0.80I0.20 changed at ∼250 K for the a- and c-axes (Fig. S6†), indicating that phase III in dabcoHBr was divided into two ranges—the low-temperature range (LTR; ≤250 K) and the medium-temperature range (MTR; 251–373 K). Table 2 lists the coefficients of thermal expansion, β, calculated using the formula: α = α0(1 + βT). The β values in dabcoHBr were constant at the a-axis (4.46 × 10⁻⁵ K−1) and the c-axis (1.78 × 10⁻⁵ K−1). However, increasing the temperature from LTR to MTR in Br0.80I0.20 increased the β values on the a- and c-axes by 1.6- and 2.2-fold, respectively. The temperature dependence of the lattice volume V corresponded to the lattice length.
| LTR | MTR | |
|---|---|---|
| a, 10−5 K−1 | 2.993 | 4.814 |
| c, 10−5 K−1 | 0.8285 | 1.822 |
| V, 10−5 K−1 | 6.864 | 12.40 |
The temperature dependence of the N⋯N distance between dabco molecules was investigated to determine the details of the hydrogen bonds (Fig. S7†). The N⋯N distance in dabcoHBr increased linearly with temperature, reaching 2.787(8) Å at 293 K in phase III.44 The N⋯N distance in Br0.80I0.20 remained constant at 2.78(2) Å in LTR which corresponds to that of dabcoHBr. At 251 K the N⋯N distance began to increase but subsequently became constant at ∼2.81 Å at 298–373 K. The elongation of the N⋯N distance to MTR resulted in weaker hydrogen bonding at MTR compared to LTR, which affected proton motility in hydrogen bonds. Using density functional theory (DFT), the activation barriers for proton motion at LTR (N⋯N distance: 2.78 Å) and MTR (N⋯N distance: 2.81 Å) were estimated as 0.30 and 0.37 eV, respectively (Fig. S8†).
Dielectric properties of solid solution Br0.80I0.20
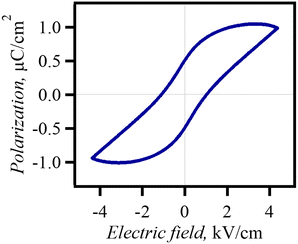
The dabcoHBr exhibited a frequency–temperature-dependent dielectricaddition, a reduction in the dielectric anomaly in the c-axis direction between 180–300 K.28 In solid solution Br0.80I0.20, the temperature dependence of the complex permittivity (120–370 K) was evaluated using single crystals along the a- and c-axis directions (Fig. 4). Br0.80I0.20 exhibited temperature- and frequency-independent dielectric anomalies along the a- and c-axes at ∼250 K. This temperature was similar to that of the change from LTR to MTR. In addition, a reduction in the dielectric constant was observed along the c-axis when the temperature was above 250 K, which agreed with the increased activation energy of protons in the N⋯N hydrogen bond. P–E hysteresis measurements were performed in the c-axis direction at 298 K using single crystals (Fig. 5). The hysteresis loops indicated the ferroelectricity of MTR. However, the MTR is the non-polar space group P-6 m2 and there should be no spontaneous polarisation at E = 0. Previous studies have reported that dabcoHBr and dabcoHI are relaxor ferroelectrics that exhibit reversible pyroelectric current.28,29 Hysteresis loops well-corresponds to that of relaxor ferroelectrics reported in inorganic relaxor ferroelectrics.5,8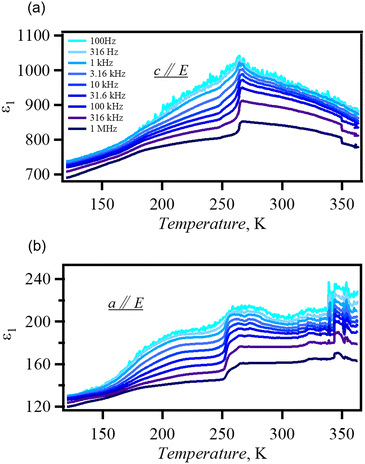 | ||
| Fig. 4 (a and b) Temperature dependence of complex permittivity (a: c-axis direction, b: a-axis direction). | ||
Phase transition behaviour of solid solution Br0.80I0.20
The phase transition behaviour of Br0.80I0.20 was investigated DSC (Fig. 6). Endothermal peaks were observed in the DSC chart at 435 K and 464 K (ΔH = 5.36 and 3.18 kJ mol−1, ΔS = 12.32 and 6.853 J mol−1 K−1). The phase transition temperatures in Br0.80I0.20 decreased compared to those in dabcoHBr. The PXRD patterns measured at 480 K (Fig. S10†) were similar to those of phase I of dabcoHBr,28 suggesting that Br0.80I0.20 also undergoes phase transitions from the hydrogen-bonded structure (phase III) to the ion-pair structure of phase I via phase II. The decrease in phase transition temperature from phase III to phase II is consistent with the increase in N⋯N distance at MTR of Br0.80I0.20 from dabcoHBr. During cooling process, an exothermal process was observed with a single peak at 319 K. The ΔH was estimated to be 8.30 kJ mol−1, which agrees with the sum of heating process. This indicates that the phase transition is reversible but has a large thermal hysteresis.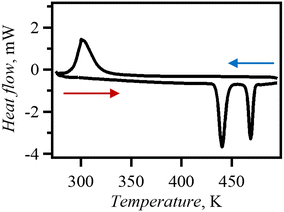 | ||
| Fig. 6 Measurements were performed on Br0.80I0.20 between 273–500 K, at a sweep rate of 10 K min−1 and under N2 atmosphere. | ||
Conclusion
Two halide solid solutions (ClBr and BrI), which had one-dimensional hydrogen-bonded chain structures, were prepared in dabcoHX. Depending on the end-member structure, ClBr and BrI exhibited different miscibilities. Cl0.03Br0.97 had a Cl− concentration of 3% and the lattice lengths were similar to those of dabcoHBr. Mixing Cl− reduced the temperature at which the phase transition from a hydrogen-bonded chain structure to an ion-pair structure occurred; the temperature of the transition for dabcoHBr changed from 458 K to 440 K. In contrast, BrI was all proportional solid solution in which the lattice lengths and volume obeyed Vegard's law. A new structural range, MTR, was observed between 251–373 K in solid solution Br0.80I0.20. Within this range, the hydrogen bonds were weakened. DFT analysis showed that change from LTR to MTR corresponded to a 0.07 eV increase in the activation energy of proton motility. These structural differences also appeared in the temperature dependence of complex permittivity. These results suggest that halide admixture can change the proton motility and the strength of hydrogen bonds, which are the mechanisms of dabco-based hydrogen bonding ferroelectric.Experimental
Synthesis of solid solution ClBr and BrI
Commercially available dabco, HCl, HBr, and HI were used as received without further purification. A 10 mmol solution of dabco (1,4-diazabicyclo[2.2.2]octane) was mixed with an acid solution (HCl: 0.8 mL, HBr: 1.1 mL or HI: 1.4 mL) at a 1![[thin space (1/6-em)]](https://www.rsc.org/images/entities/char_2009.gif) :
:![[thin space (1/6-em)]](https://www.rsc.org/images/entities/char_2009.gif) 1 molar ratio. Crystals were obtained by solvent evaporation under shaded light for several days. The solid solution ClBr was crystallised using the preparation ratio to HCl: 1 − x′ and HBr: x′ for each corresponding acid, x′ = 0, 0.25, 0.50, 0.75, or 1 (yield 37.7, 35.5, 41.8, 44.6, and 46.5%). Solid solution BrI was crystallised using the same method as ClBr, with HBr: x′, HI: 1 − x′, and with preparation ratios of x′ = 0, 0.25, 0.50, 0.65, 0.70, 0.75, 0.85, 0.90, or 1 (yield 42.6, 45.8, 35.2, 32.2, 31.4, 43.8, 37.5, 41.5, and 46.5%). For further details, see ESI.†
1 molar ratio. Crystals were obtained by solvent evaporation under shaded light for several days. The solid solution ClBr was crystallised using the preparation ratio to HCl: 1 − x′ and HBr: x′ for each corresponding acid, x′ = 0, 0.25, 0.50, 0.75, or 1 (yield 37.7, 35.5, 41.8, 44.6, and 46.5%). Solid solution BrI was crystallised using the same method as ClBr, with HBr: x′, HI: 1 − x′, and with preparation ratios of x′ = 0, 0.25, 0.50, 0.65, 0.70, 0.75, 0.85, 0.90, or 1 (yield 42.6, 45.8, 35.2, 32.2, 31.4, 43.8, 37.5, 41.5, and 46.5%). For further details, see ESI.†
Measurement
Conflicts of interest
There are no conflicts to declare.Acknowledgements
The authors acknowledge financial support from the “Extensive contribution of structural sciences from leading-edge materials to cultural & archaeological works” by Yamaguchi University, JSPS KAKENHI (22H02054) and the Cooperative Research Program of the Network Joint Research Centre for Materials and Devices of Japan.Notes and references
- M. Acosta, N. Novak, V. Rojas, S. Patel, R. Vaish, J. Koruza, G. A. Rossetti, Jr. and J. Rodel, Appl. Phys. Rev., 2017, 4, 041305 Search PubMed
.
- X. Wei, N. Domingo, Y. Sun, N. Balke, R. E. Dunin-Borkowski and J. Mayer, Adv. Energy Mater., 2022, 12, 2201199 CrossRef CAS
.
- J. F. Scott and C. A. P. De Araujo, Science, 1989, 246, 4936 CrossRef PubMed
.
- A. Kholkin, A. Morozovska, D. Kiselev, I. Bdikin, B. Rodriguez, P. Wu, A. Bokov, Z.-G. Ye, B. Dkhil, L.-Q. Chen, M. Kosec and S. V. Kalinin, Adv. Funct. Mater., 2011, 21, 1977–1987 CrossRef CAS
.
- F. Li, S. Zhang, D. Damjanovic, L.-Q. Chen and T. R. Shrout, Adv. Funct. Mater., 2018, 28, 1801504 CrossRef
.
- H. Zhang, B. Yang, A. D. Fortes, H. Yan and I. Abrahams, J. Mater. Chem. A, 2020, 8, 23965 RSC
.
- H. Pan, S. Lan, S. Xu, Q. Zhang, H. Yao, Y. Liu, F. Meng, E.-J. Guo, L. Gu, D. Yi, X. R. Wang, H. Huang, J. L. M. Driscoll, L.-Q. Chen, K.-J. Jin, C.-W. Nan and Y.-H. Lin, Science, 2021, 374, 100–104 CrossRef CAS PubMed
.
- S. Wang, F. Yan, J. Qian, G. Ge, Z. Fu, Z. Pan, F. Zhang, J. Lin, K. Zeng, C. Chen, B. Shen, Z. Liu and J. Zhai, Energy Storage Mater., 2024, 66, 103155 CrossRef
.
- I.-W. Chen, P. Li and Y. Wang, J. Phys. Chem. Solids, 1996, 57, 1525–1536 CrossRef CAS
.
- D. J. Goossens, Acc. Chem. Res., 2013, 46, 2597–2606 CrossRef CAS PubMed
.
- Z.-G. Ye, Y. Bing, J. Gao and A. A. Bokov, Phys. Rev. B: Condens. Matter Mater. Phys., 2003, 67, 104104 CrossRef
.
- H. Tan, H. Takenaka, C. Xu, W. Duan, I. Grinberg and A. M. Rappe, Phys. Rev. B, 2018, 97, 174101 CrossRef CAS
.
- H. Liu, Y. Ye, X. Zhang, T. Yang, W. Wen and S. Jiang, J. Mater. Chem. C, 2022, 10, 13676 RSC
.
- X.-B. Han, C.-Y. Chai, B.-D. Liang, C.-C. Fan and W. Zhang, CrystEngComm, 2022, 24, 1507 RSC
.
- Y.-F. Zhang, F.-F. Di, P.-F. Li and R.-X. Xiong, Chem. – Eur. J., 2021, 28, e202102990 CrossRef PubMed
.
- H.-Y. Ye, Y.-Y. Tang, P.-F. Li, W.-Q. Liao, J.-X. Gao, X.-N. Hua, H. Cai, P.-P. Shi, Y.-M. You and R.-G. Xiong, Science, 2018, 361, 151–155 CrossRef CAS PubMed
.
- H. Morita, R. Tsunashima, S. Nishihara, K. Inoue, Y. Omura, Y. Suzuki, J. Kawamata, N. Hoshino and T. Akutagawa, Angew. Chem., Int. Ed., 2019, 58, 9184–9187 CrossRef CAS PubMed
.
- Y. Xie, Y. Ai, Y.-L. Zeng, W.-H. He, X.-Q. Huang, D.-W. Fu, J.-X. Gao, X.-G. Chen and Y.-Y. Tang, J. Am. Chem. Soc., 2020, 142, 12486–12492 CrossRef CAS PubMed
.
- A. Katrusiak and M. Szafranski, Phys. Rev. Lett., 1999, 82, 576 CrossRef CAS
.
- A. Katrusiak, J. Mol. Struct., 2000, 552, 159–164 CrossRef CAS
.
- M. Szafranski, A. Katrusiak and G. J. McIntyre, Phys. Rev. Lett., 2002, 89, 215507 CrossRef PubMed
.
- S. Horiuchi, Y. Tokunaga, G. Giovannetti, S. Picozzi, H. Itoh, R. Shimano, R. Kumai and Y. Tokura, Nature, 2010, 463, 789–792 CrossRef CAS PubMed
.
- S. Horiuchi and S. Ishibashi, Chem. Sci., 2021, 12, 14198 RSC
.
- S. Horiuchi, F. Kagawa, K. Hatahara, K. Kobayashi, R. Kumai, Y. Murakami and Y. Tokura, Nat. Commun., 2012, 3, 1308 CrossRef PubMed
.
- H.-Y. Ye, Y. Zhang, S.-I. Noro, K. Kubo, M. Yoshitake, Z.-Q. Liu, H.-L. Cai, D.-W. Fu, H. Yoshikawa, K. Awaga, R.-G. Xiong and T. Nakamura, Sci. Rep., 2013, 3, 2249 CrossRef PubMed
.
- N. Zhang, Y. Zhang, H.-H. Jiang, G.-W. Du, Q. Pan, R.-G. Xiong and H.-Y. Zhang, Chem. Mater., 2022, 34, 8077–8086 CrossRef CAS
.
- X.-J. Song, Z.-X. Zhang, X.-G. Chen, H.-Y. Zhang, Q. Pan, J. Yao, Y.-M. You and R.-G. N. Xiong, J. Am. Chem. Soc., 2020, 142, 9000–9006 CrossRef CAS PubMed
.
- M. Szafrański, J. Phys. Chem. B, 2009, 113, 9479–9488 CrossRef PubMed
.
- M. Szafrański and A. Katrusiak, J. Phys. Chem. B, 2008, 112, 6779–6785 CrossRef PubMed
.
- M. Szafrański, Cryst. Growth Des., 2010, 10, 4334–4338 CrossRef
.
- Z. Liu, Y. Yuan, Z. Luo, H. Wan, P. Gao, H. Wu, J. Zhuang, J. Zhang, N. Zhang, H. Liu, W. Ren and Z.-G. Ye, J. Mater. Chem. C, 2020, 8, 5795 RSC
.
- E. Aksel and J. L. Jones, Sensors, 2010, 10, 1935–1954 CrossRef CAS PubMed
.
- L. Zhang, H. Wang, D. Wang, M. Guo, X. Lou and D. Wang, Adv. Funct. Mater., 2020, 30, 2004641 CrossRef CAS
.
- Y. Liu, H. Aziguli, B. Zhang, W. Xu, W. Lu, J. Bernholc and Q. Wang, Nature, 2018, 562, 96–100 CrossRef CAS PubMed
.
- M. Lusi, Cryst. Growth Des., 2018, 18, 3704–3712 CrossRef CAS
.
- R. Tsunashima, CrystEngComm, 2022, 24, 1309 RSC
.
- S. Chen, R. Shang, B.-W. Wang, Z.-M. Wang and S. Gao, Angew. Chem., Int. Ed., 2015, 54, 11093–11096 CrossRef CAS PubMed
.
- P. Zhao, L. Zhang, Z. Meng and Y. Lei, Adv. Funct. Mater., 2022, 32, 2205092 CrossRef CAS
.
- L. He, P.-P. Shi, M.-M. Zhao, C.-M. Liu, W. Zhang and Q. Ye, Chem. Mater., 2021, 33, 799–805 CrossRef CAS
.
- H. Xu, W. Guo, Y. Ma, Y. Liu, X. Hu, L. Hua, X. Han, J. Luo Liu and Z. Sun, Nat. Commun., 2022, 13, 5329 CrossRef CAS PubMed
.
- W.-Q. Liao, D. Zhao, Y.-Y. Tang, Y. Zhang, P.-F. Li, P.-P. Shi, X.-G. Chen, Y.-M. You and R.-G. Xiong, Science, 2019, 363, 1206–1210 CrossRef CAS PubMed
.
- M. Szafrański, J. Mater. Chem. C, 2013, 1, 7904 RSC
.
- W. Nowicki, A. Olejniczak, M. Andrzejewski and A. Katrusiak, CrystEngComm, 2012, 14, 6428–6434 RSC
.
- A. Katrusiak, M. Ratajczak-Sitarz and E. Grech, J. Mol. Struct., 1999, 474, 135–141 CrossRef CAS
.
Footnote |
| † Electronic supplementary information (ESI) available: Details on experimental procedures, DFT and crystallographic analysis. CCDC 2340566–2340574. For ESI and crystallographic data in CIF or other electronic format see DOI: https://doi.org/10.1039/d4ce00310a |
| This journal is © The Royal Society of Chemistry 2024 |


