 Open Access Article
Prediction of toluene/water partition coefficients of SAMPL9 compounds: comparison of the molecular dynamics force fields GAFF/RESP and GAFF/IPolQ-Mod + LJ-fit†
Miriam
Sprick
ab and
Gabriele
Raabe
 *ab
*ab
aInstitute of Thermodynamics, Technische Universität Braunschweig, Hans-Sommer-Strasse 5, 38106 Braunschweig, Germany. E-mail: g.raabe@tu-braunschweig.de; Tel: +49 531 3912627
bCenter of Pharmaceutical Engineering, Technische Universität Braunschweig, Franz-Liszt-Strasse 35a, 38106 Braunschweig, Germany
First published on 4th December 2023
Abstract
The SAMPL9 blind challenge aims to predict the toluene/water partition coefficient of 16 active pharmaceutical ingredients. In this work, the transfer free energy between the solvation in water and toluene is predicted by molecular dynamics simulations using the MBAR method [M. R. Shirts and J. D. Chodera, J. Chem. Phys., 2008, 129, 123105] with replica exchange molecular dynamics [Y. Sugita, A. Kitao and Y. Okamoto, J. Chem. Phys., 2000, 113, 6042–6051]. Thereby, simulation results using the force field GAFF/IPolQ-Mod + LJ-fit [A. Mecklenfeld and G. Raabe, ADMET and DMPK, 2020, 8, 274–296] are compared to simulations with the standard GAFF/RESP model [J. Wang, R. M. Wolf, J. W. Caldwell, P. A. Kollman and D. A. Case, J. Comput. Chem., 2004, 25, 1157–1174]. By statistical evaluation of RMSD and R2, we compare the results with other participants of the blind challenge. Furthermore, we provide a detailed analysis of solvation structures using the combined distribution function for simulations in water and the plane projection analysis for simulations in toluene, and we work out differences and similarities of the two force fields. These studies allow to gain important insights to increase the understanding of the mechanism of interactions between the drugs and the solvent.
Introduction
The Statistical Assessment of the Modeling of Proteins and Ligands (SAMPL) series evaluate current computational chemistry models and strategies through blind predictions of thermophysical properties like the pKa values (SAMPL8), the octanol/water partition coefficient (SAMPL6) or the ligand/binders screening (SAMPL7). The SAMPL challenges benefit to the method development since it shows new workflows and discusses work-in-progress application of new methods. The SAMPL challenges contribute to close the gap of the lack of data in the literature, encourage researchers to apply their developed methods and workflows to other fields of research and compare predictions on the same datasets.The SAMPL9 challenge aims the prediction of toluene/water partition coefficient log![[thin space (1/6-em)]](https://www.rsc.org/images/entities/char_2009.gif) PTol/W because the value enable the comparability to experimental approaches.1 The partition coefficient describes the equilibrium concentration of the molecule in a binary toluene/water mixture. To determine the toluene/water partition coefficient, the transfer free energy between the molecules in toluene and in water is predicted with computational methods. The active pharmaceutical ingredients of the SAMPL9 challenge differ in functional groups and cover a large range of partition coefficients. Accurate prediction of the solubility and other thermophysical properties of these compounds is crucial for the rational drug development.2 Therefore, computational chemistry research focuses on precise simulation methods with low computational costs.
PTol/W because the value enable the comparability to experimental approaches.1 The partition coefficient describes the equilibrium concentration of the molecule in a binary toluene/water mixture. To determine the toluene/water partition coefficient, the transfer free energy between the molecules in toluene and in water is predicted with computational methods. The active pharmaceutical ingredients of the SAMPL9 challenge differ in functional groups and cover a large range of partition coefficients. Accurate prediction of the solubility and other thermophysical properties of these compounds is crucial for the rational drug development.2 Therefore, computational chemistry research focuses on precise simulation methods with low computational costs.
Molecular dynamics simulation were performed to determine the solvation free energies of the molecules in water and toluene. The Multistate Bennett Acceptance Ratio (MBAR) method3 is used to determine the solvation free energy. Further, replica exchange molecular dynamics4,5 is applied to decrease clustering of the solvent. To model the alchemical path of the solvation process, intermediate λ-states are inserted. Hereby, the alchemical variable λ activates the intermolecular interactions stepwise. For every intermediate λ-state, an own simulation is performed. Therefore, a low number of intermediate states is aspired. The pathfinder tool developed by Mecklenfeld and Raabe6 finds a minimal suitable number and optimal distribution of λ-states, thus reducing the computational effort.
The compounds in this blind challenge are simulated using the standard GAFF/RESP force field7,8 and the force fields GAFF/IPolQ-Mod + LJ-fit.9 The IPolQ-Mod method10,11 takes the impact of polarization during the solvation process into account. To further improve the accuracy of solvation free energy predictions, Mecklenfeld and Raabe9 refitted Lennard-Jones (LJ) parameters for common atom types of drug-compounds. Thus, our study is aimed at comparing both molecular models regarding their ability to correctly predict the transfer free energy of the SAMPL9 molecules, and at analysing their differences.
Methodology
Toluene/water partition coefficient
The goal of SAMPL9 blind challenge is the prediction of the toluene/water partition coefficient log![[thin space (1/6-em)]](https://www.rsc.org/images/entities/char_2009.gif) PTol/W of 16 active pharmaceutical ingredients that cover a broad range of log
PTol/W of 16 active pharmaceutical ingredients that cover a broad range of log![[thin space (1/6-em)]](https://www.rsc.org/images/entities/char_2009.gif) PTol/W. The toluene/water partition coefficient describes the ratio of the molecule in the water phase to the ratio in the toluene phase
PTol/W. The toluene/water partition coefficient describes the ratio of the molecule in the water phase to the ratio in the toluene phase  . By logarithmising the ratio of the concentrations c, it becomes clear that a log
![[thin space (1/6-em)]](https://www.rsc.org/images/entities/char_2009.gif) PTol/W < 0 means that the molecule accumulates preferentially in the water phase and thus has hydrophilic properties. If log
PTol/W < 0 means that the molecule accumulates preferentially in the water phase and thus has hydrophilic properties. If log![[thin space (1/6-em)]](https://www.rsc.org/images/entities/char_2009.gif) PTol/W > 0, the molecule has lipophilic properties because it accumulates preferentially in the toluene phase. It can be determined by:
PTol/W > 0, the molecule has lipophilic properties because it accumulates preferentially in the toluene phase. It can be determined by: | (1) |
The difference in the solvation free energy for the molecule in the neutral form between water and toluene is the transfer free energy (TFE). The transfer free energy is submitted by the participants of the blind challenge and can be written as:
| TFE = ΔGSolvtol − ΔGSolvwater, | (2) |
 | (3) |
The ΔGSolv are thereby derived from simulations in the NpT-Ensemble. The solvation free energy of the molecule corresponds to the transfer of a solute from the vacuum phase “0”, with no intermolecular interactions between solute and solvent, to the dissolved state “1” with full solute–solvent interactions. The transition from the reference state “0” in the undissolved state to the fully dissolved state “1” is divided into intermediate λ-state with scaled solute–solvent interactions to achieve convergence of the solvation free energy. These intermediate states are scaled along an alchemical pathway introducing the alchemical variable λ.12 Each intermediate λ-state creates a configurational space that requires a sufficiently large overlap between the individual λ-states. Although an increasing number of intermediate λ-states might increase the configurational space overlap, the computational effort increases since every intermediate λ-state is an own molecular dynamics simulation.
Pathfinder tool
The optimized pathfinder tool was developed by Mecklenfeld and Raabe6 to allow for efficient solubility simulations with the minimum required number of intermediate states. The python tool iteratively adjusts the λ-states in number and distribution in order to equalize the statistical uncertainties of the partial free energy difference to each other. The number of λ-states is kept to a minimal amount due to the high computational intensity of the solvation free energy simulations. Since each λ-state represents a simulation with a certain strength of intermolecular interaction, the distribution varies to ensure sufficient configurational space overlap. Therefore, the pathfinder evaluates the available data provided by the ‘alchemical-analysis.py’ tool13 after short trail simulation runs, and adds λ-states in regions with insufficient overlap and deletes λ-states in regions with high overlap that indicates too expensive sampling. Additionally, the uncertainties of all partial free energy difference are accumulated and the new distribution of λ-states is derived by linear interpolation between the distribution of intermediate states to yield equalised partial uncertainties of free energy results. In the next iteration step, the simulation is continued with a new set of intermediate λ-states. This procedure is repeated until the number and distribution of λ-states converges. The optimization progress can be monitored with the overlapping matrix from the MBAR analysis provided by the ‘alchemical-analysis.py’ tool. This iteration to adjust the number and distribution λ-states replaces a large portion of the equilibration phase for the different λ-states of an ordinary ΔGSolv simulations so that the workflow does not involve any additional computational costs. Thereby, it allows for reproducable ΔGSolv simulation with the minimum number of intermediate states which makes it computationally efficient.Statistical evaluation
Statistical analyses are performed using the provided R Code by the SAMPL challenge host.14 Values of interest that enable the comparability of the different approaches are the root mean square deviation (RMSD), the coefficient of determination (R2) and the mean signed error (MSE). The root mean square deviation is the deviation from the simulated transfer free energy to experimental data, which are given as reference by the blind challenge host. The RMSD is calculated as: | (4) |
 | (5) |
 | (6) |
Molecular models
Force fields
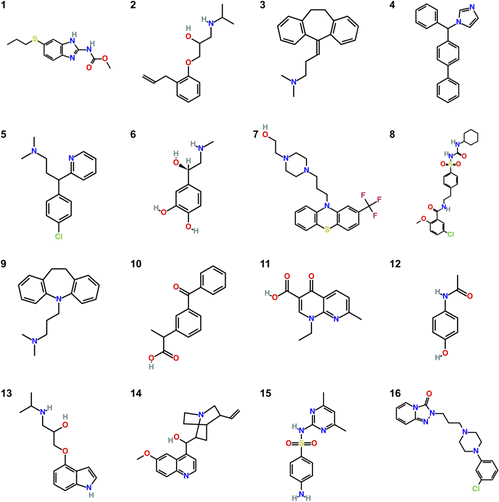
The molecules studied in the SAMPL9 challenge are shown in Fig. 1. Some molecules are commonly known like Mol12 which is the pain killer Paracetamol, Mol6 is the stress hormone Epinephrine and Mol13 is known as Pindolol.The molecular dynamics simulations were performed using two different force fields. The General Amber Force Field (GAFF)7 is widely applied for drug-like compounds. It is categorized as classical force field and uses fixes partial charges to describe the electrostatic interactions. The charges are located in the center of mass of each atom. They are calculated using quantum mechanics simulations with the restrained electrostatic potential (RESP) method.15 Classical force fields have a moderate computational effort, even though, the polarization effects during the solvation process are not considered.16 Cerutti et al.10 developed the implicitly polarized charges (IPolQ) method that implicitly represents the polarization effects during solvation. The later known as IPolQ-Mod by Muddana et al.11 uses an average of the partial atomic charges between vacuum and dissolved state. It can provide an energetic approximation to the polarization state of the molecule during the solubility simulation. Mecklenfeld and Raabe17 show deviation for specific compound classes due to the disturbed self-consistency of the molecular model GAFF/IPolQ-Mod. By introducing new atom types and by refitting the Lennard-Jones parameters for the IPolQ-Mod charges, they were able to improve the accuracy of the solvation free energy predictions by IPolQ-Mod compared to results obtained with both, standard GAFF and IPolQ-Mod method with original GAFF LJ-parameter. Consequently, they recommend to refit the atom type specific parameters σ and ε of the Lennard-Jones potential, resulting in the GAFF/IPolQ-Mod + LJ-fit model.9
In this work, we compare the ability of GAFF/IPolQ-Mod + LJ-fit model to correctly predict the transfer free energy of the molecules of the SAMPL9 challenge to the results of the standard GAFF/RESP force field. For both molecular models, the LJ parameters describing the interaction between unlike atom types were determined by the Lorentz–Berthelot combining rule:
 | (7) |
 | (8) |
It should be noted that the GAFF/IPolQ-Mod + LJ-fit model by Mecklenfeld and Raabe9 does not contain reoptimized parameters for the sulphur atom type. Therefore, the LJ parameters for sulphur were taken from the original GAFF/RESP model – though, resulting in an inconsistency of the GAFF/IPolQ-Mod + LJ-fit modelling for the sulphur containing molecules Mol1, Mol7, Mol8 and Mol15.
For both models, GAFF/IPolQ-Mod + LJ-fit and GAFF/RESP, partial charges to model the electrostatic interactions need to be derived from quantum chemical simulations. Details on the determination of the partial charges are provided in the following section.
Simulation details
Quantum mechanics simulations
The quantum mechanics (QM) simulations were performed with GAUSSIAN 16.18 The program GaussView19 version 6 was used to draw the molecular structures. The charges of the molecules are determined according to the two different force fields GAFF/RESP and GAFF/IPolQ-Mod + LJ-fit. For GAFF/RESP, both the geometry optimization of each molecule and the determination of its partial charges were performed in vacuum on the HF/6-31G* level of theory.20 For the force field GAFF/IPolQ-Mod + LJ-fit, the geometry optimization of each molecule in vacuum was performed with MP2/aug-cc-pVDZ.21 Though, due to slow convergence in the geometry optimization of the sulphur containing molecules, the geometry optimization of Mol1, Mol7, Mol8 and Mol15 were conducted using HF/6-31G*. The RESP charge calculation for all molecules were performed on the MP2/aug-cc-pVDZ level theory for both, in vacuum and with the implicit solvent, i.e. water and toluene. As “apparent surface charge” SCRF solvation model, the “polarizable continuum model” (PCM) method was used.22 The charges for the GAFF/IPolQ-Mod + LJ-fit model are then averaged between the calculated values in vacuum and the respective solvent to approximate the polarising influences of the solvent on the molecule in the dissolved state.Initial configuration
The output from QM simulations are used to create input for GROMACS simulations using GAFF. From AmberTools20,23 antechamber and acpype24,25 were used to generate topologies and charge files in suitable GROMACS formats. To set up an initial configuration, packmol version 20.010 was used. Packmol26 is an algorithm, which arranges the molecules in a simulation cell so that they do not overlap, there is sufficient spacing with respect to the van der Waals radius and the entire space is filled. The system sizes were defined according the guidelines of Parameswaran and Mobley27 with the drug placed centrally in the cell. The simulations in the solvent water contain one SAMPL9 compound and 2000 TIP3P28 molecules, resulting in an initial box size of 4.83 nm3. The simulations in the solvent toluene contain one solute molecule and 400 toluene molecules, and the initial configuration has a box size of 5.03 nm3.Molecular dynamics
All molecular dynamics (MD) simulations were performed with GROMACS 2019.629 at a temperature of 298.15 K. The temperature control is included in the Langevin dynamics stochastic integrator (sd).30–33 The step size remained constant at 0.5 fs. The cut-off radius was set at 1.2 nm. The Fast Smooth Particle-Mesh Ewald method34 is used to deal with the long-ranged electrostatic interactions. Periodic boundary conditions were applied in all three spatial directions. For the scaling of the Lennard-Jones interactions, the 1-1-6 softcore potential16,35 with α = 0.5 was chosen. The simulation of each system was performed in four stages:(1) An energy minimization of each initial λ state using the steep integrator for maximal 100![[thin space (1/6-em)]](https://www.rsc.org/images/entities/char_2009.gif) 000 steps was conducted. It stops earlier if the maximal force is smaller than 10 kJ mol−1 nm−1.
000 steps was conducted. It stops earlier if the maximal force is smaller than 10 kJ mol−1 nm−1.
(2) A short equilibration of 1 × 10⁶ steps in the NpT-ensemble for each initial λ-state is performed. Here, the Berendsen barostat36 was applied for pressure coupling in the equilibration phase due to its robustness. The simulation time of 0.5 ns ensured an equilibrated system that was verified by visualization of the temperature, density and total energy over time.
(3) The optimal number and distribution of λ-states is determined using the pathfinder6 method, developed in previous work. Up to five iterations were needed to find an optimal distribution. Important criteria are sufficient configurational space overlap and an equidistant differences of the solvation energy between the steps. These simulations run for 1 × 10⁶ steps in each iteration. The Parrinello–Rahman barostat37,38 is applied for pressure coupling in the optimization phase to ensure sampling according to a correct Boltzmann distribution. The optimized λ-distribution is the starting configuration for the fourth stage, the production.
(4) Five production simulations using the Langevin dynamics integrator and Parrinello–Rahman pressure coupling were performed for 4 × 10⁶ steps.
To increase the configurational space overlap and to reduce the deviation of the block averages, we have applied replica-exchange molecular dynamics4,5 in the optimization and the production simulations (stage 3 and 4). Thereby, the configurational space is exchanged with another trajectory of the different λ-states with an exchange rate of 1000. This exchange rate ensures an equilibration after each exchange. The exchanges between the λ-states has been visualized to ensure holistic exchange. An exemplary exchange matrix can be seen in Fig. 2 that visualises the exchanges of the configuration between the parallel λ-state simulations along the time of 2 ns. Each color is dedicated to one λ-state at the first step and is kept through the exchanges along the simulation time. The colorful plot shows regularly exchange of the configurational space between every λ-state.
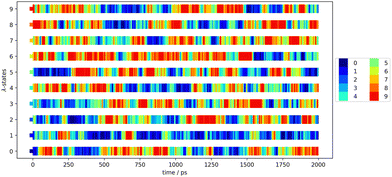 | ||
| Fig. 2 Exchange matrix to visualize the replica exchange progress of the first production block of Mol12 in toluene using GAFF/IPolQ-Mod + LJ-fit. | ||
Evaluation of the simulation to derive ΔGSolv
The evaluation of the alchemical pathway in this work is performed using the statistically optimized Multistate Bennett Acceptance Ratio (MBAR) method3 provided by the ‘alchemical-analysis.py’ tool.13 Unlike classical evaluation methods such as Thermodynamic Integration or Exponential Averaging, the MBAR method does not preserve hysteresis effects, so it is not directionally dependent. Though, it requires a sufficient overlap of configurational space between intermediate states to allow for a reliable calculation of free energy differences. The MBAR method uses weighting functions that simultaneously minimize the variance of all ΔGij results which are the partial free energy difference between two neighbouring λ-states i and j.3 The simulations of the individual λ-states have a statistical deviation due to the fluctuation during the simulation. The homogeneity of the individual deviations are given as deviation in the MBAR method for calculating ΔGSolv. The pathfinder tool starts five simulations with the same starting configuration which are used as blocks for the block averages. The final result for ΔGSolv is the mean of the five production blocks.6 The deviation is given as the standard error of the mean (SEM): | (9) |
 | (10) |
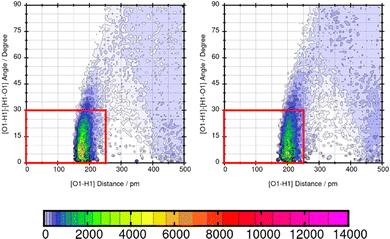
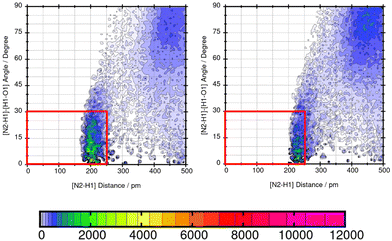
TRAVIS39,40 is employed to evaluate significant interactions between the solute and the solvents. An overview of interactions is hereby gained from the contact matrix (cmat) tool that evaluates every pair radial distribution function. Then, atom-atom interactions that show increased interactions are further analyzed using the combined distribution function (cdf) and the plane projection analysis (plproj). The combined distribution function pictures the multi-dimensional correlation effects of two correlated observables into a 2D figure. It plots the hydrogen bond angle between the observed solute atom and the solvent (adf) against the length of the observed hydrogen bond (rdf). Applying a geometric criteria with the distance of max. 2.5 Å between hydrogen donor X and acceptor Y and the X–H⋯Y angle of 150°–180°,41 a strong signal in this distance and angle range indicates a hydrogen bond. The plane projection analysis shows the average particle density of the solvents at each position around the compound and illustrates the solvent orientation which is presented in a vector field.
Results and discussion
In this section, the performance of the pathfinder tool is initially discussed. Then, the force fields GAFF/RESP and GAFF/IPolQ-Mod + LJ-fit are evaluated regarding their ability to predict the transfer free energy compared to results from the different methods of other SAMPL9 blind challenges’ participants. The differences of describing the dipole moments of the molecules using the two force fields are discussed. In conclusion, the detailed analysis focuses on three observations regarding the solvent orientation and the solvent density in toluene and the representation of the hydrogen bonding interaction in water.Performance of the pathfinder tool
Starting from a low number of intermediate states (mostly 8 λ-states for smaller molecules and 12 or 14 λ-states for larger molecules), the pathfinder tool iterated within maximal five repetitions to a sufficient configurational space overlap. Tables 1 and 2 show the initial and the optimized number of λ-states for both solvents and force fields. Along the alchemical path, first the van-der-Waals (vdW) interaction are scaled from 0 to 1 and then, the Coulomb (Coul) interactions are scaled up to the fully dissolved state. Therefore, the number of intermediate states is split into λvdW and λCoul.| ID tag | Number of initial λ-states | λ-states | λ-states | ||||
|---|---|---|---|---|---|---|---|
| GAFF/RESP | GAFF/IPolQ-Mod + LJ-fit | ||||||
| All | vdW | Coul | All | vdW | Coul | ||
| Mol2 | 12 | 13 | 9 | 4 | 15 | 11 | 4 |
| Mol3 | 8 | 12 | 9 | 3 | 13 | 10 | 3 |
| Mol4 | 8 | 13 | 9 | 4 | 14 | 9 | 5 |
| Mol5 | 8 | 12 | 9 | 3 | 13 | 9 | 4 |
| Mol6 | 8 | 12 | 7 | 5 | 11 | 7 | 4 |
| Mol9 | 8 | 13 | 10 | 3 | 12 | 9 | 3 |
| Mol10 | 8 | 13 | 8 | 5 | 13 | 9 | 4 |
| Mol11 | 8 | 13 | 8 | 5 | 12 | 8 | 4 |
| Mol12 | 8 | 11 | 7 | 4 | 11 | 7 | 4 |
| Mol13 | 8 | 13 | 8 | 5 | 12 | 8 | 4 |
| Mol14 | 12 | 14 | 9 | 5 | 12 | 8 | 4 |
| Mol16 | 14 | 20 | 14 | 6 | 16 | 11 | 5 |
| Mol1 | 12 | 13 | 9 | 4 | 12 | 8 | 4 |
| Mol7 | 12 | 16 | 11 | 5 | 16 | 11 | 5 |
| Mol8 | 12 | 16 | 11 | 5 | 18 | 13 | 5 |
| Mol15 | 12 | 14 | 9 | 5 | 14 | 9 | 5 |
| ID tag | Number of initial λ-states | λ-states | λ-states | ||||
|---|---|---|---|---|---|---|---|
| GAFF/RESP | GAFF/IPolQ-Mod + LJ-fit | ||||||
| All | vdW | Coul | All | vdW | Coul | ||
| Mol2 | 12 | 13 | 9 | 4 | 13 | 11 | 2 |
| Mol3 | 12 | 13 | 11 | 2 | 13 | 11 | 2 |
| Mol4 | 8 | 11 | 9 | 2 | 15 | 12 | 3 |
| Mol5 | 8 | 11 | 9 | 2 | 13 | 11 | 2 |
| Mol6 | 8 | 11 | 8 | 3 | 11 | 8 | 3 |
| Mol9 | 12 | 12 | 10 | 2 | 14 | 12 | 2 |
| Mol10 | 12 | 13 | 10 | 3 | 14 | 11 | 3 |
| Mol11 | 8 | 11 | 8 | 3 | 11 | 8 | 3 |
| Mol12 | 8 | 11 | 8 | 3 | 10 | 7 | 3 |
| Mol13 | 12 | 13 | 10 | 3 | 14 | 11 | 3 |
| Mol14 | 12 | 14 | 11 | 3 | 11 | 9 | 2 |
| Mol16 | 14 | 24 | 20 | 4 | 15 | 12 | 3 |
| Mol1 | 12 | 13 | 10 | 3 | 13 | 8 | 5 |
| Mol7 | 12 | 15 | 12 | 3 | 16 | 11 | 5 |
| Mol8 | 12 | 16 | 12 | 4 | 18 | 13 | 5 |
| Mol15 | 12 | 13 | 10 | 3 | 12 | 9 | 3 |
Generally, it can be seen that more intermediate states are needed to scale the van-der-Waals interaction than the Coulomb interaction. For the compounds without sulphide in toluene, the Coulomb interaction can be scaled in 2-3 λ-states using GAFF/IPolQ-Mod + LJ-fit and 2-4 λ-states using GAFF/RESP. For simulations in water, the scaling of Coulomb interaction requires 3-6 intermediate λ-states. The size of the molecule influences the total number of intermediate λ-states. The smallest molecule Mol12 with 151.16 g mol−1 requires just 11 or 10 λ-states, whereas the largest compounds Mol16 with 344.38 g mol−1 requires between 15 and 24 λ-states.
Further evaluation of the relation between the optimized λ-distribution and descriptors like the molecular weight, dipole moment or geometric properties will be carried out in future work.
Comparison on RMSD and R2 within SAMPL9
The results of the statistical evaluation of the simulated transfer free energies using the force fields GAFF/RESP and GAFF/IPolQ-Mod + LJ-fit are shown in Table 3. It should be noted that faulty simulation results were submitted for the Mol1 and Mol12. The simulations were now repeated, and the RMSD and R2 values were recalculated with the correct transfer free energy values.| Force fields | RMSD [kJ mol−1] | R 2 [−] | MSE [kJ mol−1] | MUE [kJ mol−1] |
|---|---|---|---|---|
| GAFF/RESP | 2.95 | 0.78 | 1.94 | 2.39 |
| GAFF/IPolQ-Mod + LJ-fit | 3.36 | 0.71 | 2.43 | 2.71 |
| GAFF/IPolQ-Mod + LJ-fit without sulphur containing compounds | 2.51 | 0.81 | 1.80 | 1.80 |
| MM.PBSA by Toa, He and Wang | 1.52 | 0.79 | −0.49 | 1.28 |
| (NE-FG) Non equilibrium fast growth by Procacci | 2.00 | 0.69 | 0.25 | 1.55 |
| EE.Openff.2.0.TIP3P.MD.EE.WL by Voelzlab | 2.26 | 0.80 | 1.09 | 1.75 |
| MD (GAFF/TIP3P) by Beckstein and Iorga | 2.61 | 0.62 | 0.65 | 2.06 |
| MD (OPLS-AA/M24) by Beckstein and Iorga | 2.78 | 0.78 | 2.13 | 2.38 |
| MD (OPLS-AA/TIP4P) by Beckstein and Iorga | 2.90 | 0.83 | 2.40 | 2.60 |
| EE.MCC.GAFF2.AM1.BCC.TIP3P.MD. by Ali and Henchman | 2.92 | 0.19 | −0.19 | 2.43 |
| FEP-AWH_3 × 3 × 3_4ns_TIP4P by Patel | 3.86 | 0.06 | 0.32 | 2.93 |
Notebly, the transfer free energies of the sulphur containing compounds Mol1, Mol7, Mol8 and Mol15 using GAFF/IPolQ-Mod + LJ-fit differ disproportionately from the experimental data. This conspicuousness can be explained by the lack of refitted Lennard-Jones parameter for the sulphur atom types when using IPolQ-Mod charges. As mentioned before, the sulphur LJ parameters were then taken from the GAFF/RESP model. This is an inconsistency in the force field modelling of Mol1, Mol7, Mol8 and Mol15 and might lead to differing results. Therefore, the statistical evaluation was also performed without the compounds Mol1, Mol7, Mol8 and Mol15. Excluding the sulphur containing compounds, the GAFF/IPolQ-Mod + LJ-fit force field shows with RMSD = 2.51 kcal mol−1 good results in comparison to the other groups. The coefficient of determination R2 is with 0.81 very high.
Comparison of both force fields regarding ΔGSolv predictions
The transfer free energies of the 16 compounds are shown in Table 4. The transfer free energy determined by experiments is compared to the results from our MD simulations using GAFF/RESP and GAFF/IPolQ-Mod + LJ-fit force fields. The sulphur compounds Mol1, Mol7, Mol8 and Mol15, for which no consistent GAFF/IPolQ-Mod + LJ-fit modelling is available, are listed separately.| ID tag | Experimental | GAFF/RESP | GAFF/IPolQ-Mod + LJ-fit | ||
|---|---|---|---|---|---|
| TFE | TFE | SEM | TFE | SEM | |
| [kcal mol−1] | [kcal mol−1] | [kcal mol−1] | |||
| Mol2 | −3.26 | −5.46 | 0.05 | −6.41 | 0.04 |
| Mol3 | −7.49 | −12.35 | 0.04 | −13.75 | 0.04 |
| Mol4 | −7.44 | −7.69 | 0.05 | −8.26 | 0.09 |
| Mol5 | −4.91 | −8.95 | 0.11 | −8.38 | 0.07 |
| Mol6 | 1.67 | 2.79 | 0.07 | 0.02 | 0.08 |
| Mol9 | −6.87 | −10.48 | 0.05 | −9.34 | 0.06 |
| Mol10 | −3.36 | −3.10 | 0.06 | −6.62 | 0.04 |
| Mol11 | −1.99 | −0.77 | 0.06 | −3.08 | 0.14 |
| Mol12 | 2.16 | 1.12 | 0.03 | 1.79 | 0.05 |
| Mol13 | −0.49 | −2.73 | 0.07 | −3.36 | 0.07 |
| Mol14 | −1.92 | −6.03 | 0.13 | −5.01 | 0.05 |
| Mol16 | −5.13 | −8.93 | 0.26 | −5.43 | 0.09 |
| Mol1 | −5.11 | −4.53 | 0.10 | −2.71 | 0.07 |
| Mol7 | −5.94 | −11.77 | 0.12 | −13.92 | 0.12 |
| Mol8 | −3.79 | −4.05 | 0.41 | −4.96 | 0.23 |
| Mol15 | 1.01 | −1.43 | 0.07 | −2.19 | 0.09 |
In Table 4, it can be seen that the two force fields predict quite different transfer free energies. The force fields differ in the calculation of the charges. While the RESP method determines the charges from structures in vacuum, the IPolQ-Mod method includes polarization during the solvation process and the refitted LJ parameter causes different predictions. Thereby, both models generally tend to estimate a higher solubility in toluene than the experimental transfer free energy shows, and this is more pronounced for the GAFF/IPolQ-Mod + LJ-fit force field. Exceptions are Mol6, Mol10 and Mol11.
As given in eqn (2), the transfer free energies are calculated from the solvation free energies in both solvents. Therefore, we compare the results of both model for the solvation free energies in water and toluene to gain a better insight into the different performances regarding the transfer free energy calculation. The ΔGSolv results for both force fields in water are listed in Table 5, and for toluene in Table 6. In the tables we also provide the deviations between both models derived as:
| abs.Dev. = ΔGIPolQ-ModSolv − ΔGRESPSolv. | (11) |
| ID tag | GAFF/RESP | GAFF/RESP | GAFF/IPolQ-Mod + LJ-fit | GAFF/IPolQ-Mod + LJ-fit | abs. Dev. IPolQ-Mod-RESP |
|---|---|---|---|---|---|
| Water | Water stv | Water | Water stv | ||
| [kcal mol−1] | [kcal mol−1] | [kcal mol−1] | |||
| Mol2 | −7.44 | 0.04 | −8.99 | 0.04 | −1.55 |
| Mol3 | −2.94 | 0.04 | −5.23 | 0.03 | −2.28 |
| Mol4 | −9.56 | 0.03 | −12.12 | 0.07 | −2.55 |
| Mol5 | −5.39 | 0.09 | −9.03 | 0.06 | −3.64 |
| Mol6 | −16.20 | 0.06 | −15.72 | 0.06 | +0.48 |
| Mol9 | −4.14 | 0.03 | −9.86 | 0.02 | −5.72 |
| Mol10 | −11.85 | 0.05 | −9.87 | 0.01 | +1.98 |
| Mol11 | −16.26 | 0.05 | −15.81 | 0.13 | +0.45 |
| Mol12 | −12.48 | 0.02 | −14.43 | 0.02 | −1.94 |
| Mol13 | −12.45 | 0.03 | −13.65 | 0.05 | −1.20 |
| Mol14 | −12.95 | 0.13 | −16.12 | 0.03 | −3.17 |
| Mol16 | −14.25 | 0.21 | −23.80 | 0.05 | −9.54 |
| RMSD | 3.78 | ||||
| ID tag | GAFF/RESP | GAFF/RESP | GAFF/IPolQ-Mod + LJ-fit | GAFF/IPolQ-Mod + LJ-fit | abs. Dev. IPolQ-Mod-RESP |
|---|---|---|---|---|---|
| Toluene | Tol. stv. | Toluene | Tol. stv. | ||
| [kcal mol−1] | [kcal mol−1] | [kcal mol−1] | |||
| Mol2 | −12.91 | 0.03 | −15.40 | 0.02 | −2.50 |
| Mol3 | −15.31 | 0.02 | −18.98 | 0.02 | −3.67 |
| Mol4 | −17.27 | 0.04 | −20.37 | 0.06 | −3.10 |
| Mol5 | −14.35 | 0.05 | −17.41 | 0.02 | −3.06 |
| Mol6 | −13.42 | 0.04 | −15.69 | 0.05 | −2.28 |
| Mol9 | −14.63 | 0.04 | −19.20 | 0.05 | −4.56 |
| Mol10 | −14.96 | 0.03 | −16.50 | 0.04 | −1.53 |
| Mol11 | −17.05 | 0.04 | −18.90 | 0.06 | −1.85 |
| Mol12 | −11.37 | 0.01 | −12.64 | 0.04 | −1.27 |
| Mol13 | −15.19 | 0.06 | −17.01 | 0.05 | −1.82 |
| Mol14 | −18.99 | 0.02 | −21.13 | 0.04 | −2.14 |
| Mol16 | −23.20 | 0.16 | −29.22 | 0.08 | −6.02 |
| RMSD | 3.11 | ||||
It should be noted that in the following calculations and discussions, the sulphur containing molecules are excluded due to the missing LJ parameters of sulphur.
The mean deviation for the differences in ΔGSolv simulations between both force fields for the simulations in toluene is 3.11 kcal mol−1 whereas, the mean deviation of the ΔGSolv results in water for the two force fields is 3.77 kcal mol−1. This indicates that the effect of the different modelling of intermolecular interactions is more pronounced for simulations in water than in toluene as solvent.
Correlation of ΔGSolv and the dipole moments
To gain a more detailed insight into the differences of the force fields, we have additionally evaluated the dipole moments of the solute in the solvents. The dipole moments for GAFF/RESP are taken from the GAUSSIAN output of the geometry optimization using HF/6-31G* in vacuum. Therefore, it is the same in both solvents. The dipole moments for GAFF/IPolQ-Mod + LJ-fit are determined by setting the average partial charge from the IPolQ-Mod method on the geometry optimization in vacuum. From the position and the partial charges of each atom related to the center of mass, the dipole moment can be determined.16 As the GAFF/IPolQ-Mod + LJ-fit uses different partial charges for the solutes in both solvents, also the resulting dipole moments differ. The dipole moments are listed in Table 7, again together with the deviation between both models calculated according to eqn (11).| ID tag | GAFF/RESP | GAFF/IPolQ-Mod + LJ-fit | abs. Dev. FF | GAFF/IPolQ-Mod + LJ-fit | abs. Dev. FF |
|---|---|---|---|---|---|
| Vacuum | Water | Water | Toluene | Tol. | |
| [Debye] | [Debye] | [Debye] | [Debye] | [Debye] | |
| Mol2 | 2.04 | 3.46 | +1.42 | 1.98 | −0.05 |
| Mol3 | 0.59 | 1.03 | +0.43 | 0.93 | +0.33 |
| Mol4 | 4.28 | 4.86 | 0.57 | 4.52 | +0.23 |
| Mol5 | 2.86 | 2.76 | −0.10 | 2.63 | −0.23 |
| Mol6 | 3.56 | 4.10 | +0.31 | 3.87 | +0.54 |
| Mol9 | 2.73 | 2.50 | −0.23 | 2.24 | −0.50 |
| Mol10 | 2.55 | 3.21 | +0.67 | 2.89 | +0.34 |
| Mol11 | 7.25 | 9.57 | +2.32 | 8.76 | +1.51 |
| Mol12 | 4.54 | 5.20 | +0.66 | 4.97 | +0.43 |
| Mol13 | 2.42 | 2.56 | +0.14 | 2.41 | −0.0006 |
| Mol14 | 2.70 | 3.05 | +0.35 | 2.82 | +0.12 |
| Mol16 | 6.27 | 7.06 | +0.78 | 6.58 | +0.31 |
| RMSD | 0.90 | 0.54 | |||
It can be seen that the generally more pronounced differences between both force fields in the calculation of solvation free energy in water than in toluene correspond to larger differences in the dipole moments in water with a mean deviation of 0.90 Debye compared to the mean deviation in toluene of 0.54 Debye. For most solutes, except Mol5, GAFF/IPolQ-Mod + LJ-fit predicts a higher dipole moment in the polar solvent water than GAFF/RESP.
In Fig. 3, the dipole moments from Table 7 are plotted against the solvation free energy using GAFF/RESP and GAFF/IPolQ-Mod + LJ-fit in both solvents, water and toluene.
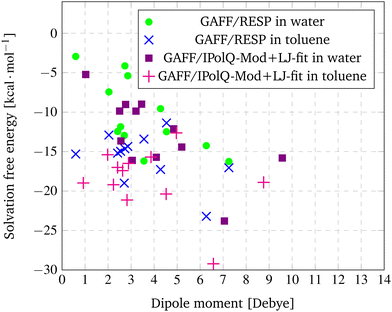 | ||
| Fig. 3 Correlation between dipole moments and the solvation free energy using GAFF/RESP and GAFF/IPolQ-Mod + LJ-fit in both solvents, water and toluene. | ||
For GAFF/RESP, a tendency can be observed that the dipole moment of the solute correlates with its solvation free energy in water. For Mol3 with the smallest dipole moment of 0.59 D, the lowest solubility (ΔGSolv = −2.94 kcal mol−1) is predicted. For Mol11 with the strongest dipole moment of 7.25 D, the highest solubility (ΔGSolv = −16.26 kcal mol−1) is determined. The compound Mol10, Mol13 and Mol14 show similar dipole moments between 2.41 and 2.70 and the prediction of the solvation free energy show similar results as well. Though, this correlation does not apply for Mol6 (rather small dipole moment and high solubility) or Mol4 and Mol5 (rather high dipole moment and low solubility). This is due to the fact that of course also other factors have an impact on solubility – such has hydrogen bonding, which can be expected for the oxygen containing Mol13.
Similar tendencies that the dipole moment correlates with the solvation free energy in the solvent water can also be observed for the GAFF/IPolQ-Mod + LJ-fit results. Mol3, Mol5 and Mol9 have relative small dipole moments and also a rather low solubility in water, whereas the simulations for compounds with large dipole moment such as Mol11 and Mol16 predict a high solubility. This trend disagrees for example again for the oxygen containing compounds Mol13 and Mol14 for which high solubilities are predicted despite their relative small dipole moments.
For the solvation free energies in toluene, no correlation to the dipole moment can be observed, neither for the GAFF/RESP nor for the GAFF/IPolQ-Mod + LJ-fit results.
Detailed comparison of predicted solvation structure by the force fields
A detailed analysis of the compound–solvent interaction is performed using TRAVIS.39 In the plane projection analysis, the compound is fixed in the centre and the color coding indicates the intensity of solvent around the compound. A vector field demonstrates the orientation of the solvent. Here, the plane projection analysis of selected compounds in toluene gives insights of the toluene orientation towards the compounds and regarding a correlation between the solvation free energy. Further, the combined distribution function of selected compounds in water supports the comparison between the force fields. A combined distribution function creates a 2D plot combining the distance of a distinct atom pair and the angle of these triangle. The color coding indicates the occurrence of the distance–angle combination. There are three observation that can be made for the components studied in this work regarding the relation between solvation free energies and solvation structures by comparing the two force fields. These will be explained in the following sections.Correlation between density peaks in the plane projection analysis and the solubility prediction
Plane projection analyses of the compounds in toluene are performed to gain insights about the solvent density. The selected exemplary molecules Mol12, Mol2 and Mol5 show that an increased peak predicted with one of the force fields correlates with higher solubility prediction with this force field.Mol12 has the highest affinity to dissolve in water which can be seen with a transfer free energy TFE = 2.16 kcal mol−1 according to the experiments. The force field GAFF/IPolQ-Mod + LJ-fit predicts the resulting partition coefficient very well. The plane projection analysis in Fig. 4 visualizes the solvent density of toluene around the Paracetamol molecule. The cross section is cut along nitrogen and the C-ring, hence, the ring lays flat in the plane. The chemical structure including the plane cutting is provided in the ESI.† The plot indicates a preference of toluene molecules at the benzene ring of Mol12 with a peak of the solvent density of 2.91 times the bulk density using GAFF/IPolQ-Mod + LJ-fit and 2.56 times the bulk density using GAFF/RESP. Further, a poverty around the keto and alcohol group can be observed. The slightly higher peak using GAFF/IPolQ-Mod + LJ-fit corresponds to the higher predicted solubility of ΔGSolv = −12.64 kcal mol−1 compared to ΔGSolv = −11.37 kcal mol−1 using GAFF/RESP.
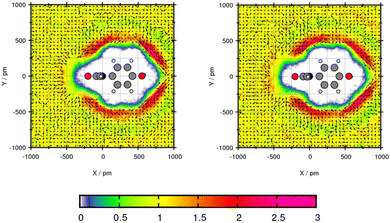 | ||
| Fig. 4 Plane projection analysis of Mol12 (paracetamol) in toluene using GAFF/RESP (left) and GAFF/IPolQ-Mod + LJ-fit (right). | ||
The transfer free energy of Mol2 is overestimated by both force fields. Nevertheless, the tendency of preferred solubility in toluene is correctly reproduced. These deviations in the transfer free energy might be caused by the complex structure with one secondary amine, one ether and one alcohol group, as well as a benzene ring with a propene side chain. Since the optimized geometry of this complex structure differs after the simulations, the plane projection analysis does rarely create comparable planes as illustrated by Fig. 5. Focusing of the oxygen–central carbon–oxygen plane, the peak solvent density is with 2.82 times the bulk density using GAFF/IPolQ-Mod + LJ-fit higher than using GAFF/RESP with an peak of 2.14 times the bulk density. This increased solvent density leads to a higher solvation using GAFF/IPolQ-Mod + LJ-fit (ΔGSolv = −15.40 kcal mol−1) compared to GAFF/RESP (ΔGSolv = −12.91 kcal mol−1).
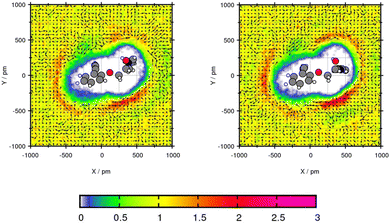 | ||
| Fig. 5 Plane projection analysis of Mol2 (alprenolol) in toluene using GAFF/RESP (left) and GAFF/IPolQ-Mod + LJ-fit (right). | ||
For the plane projection analysis of the chlorine containing compound Mol5 in toluene, the plane was set through the central C-atom, the intersection of the two rings and up to one of the rings. Fig. 6 shows an increased solvent density in the bows of the chlorine containing ring structure and around the pyridine ring. The affinity of toluene to be around the benzene ring grounds in the basic theory of “like seeks like”.42 The peaks of particle density using GAFF/IPolQ-Mod + LJ-fit are up to 2.21 times the bulk density and therefore higher than using GAFF/RESP with 2.13 times the bulk density. The slightly higher solvent density leads to a higher predicted solubility with ΔGSolv = −17.41 kcal mol−1 using GAFF/IPolQ-Mod + LJ-fit in comparison to ΔGSolv = −14.35 kcal mol−1 using GAFF/RESP. Around the chloride, the methyl group of toluene points away, whereas the orientation of the methyl group is directed towards the bow between the chain and the pyridine ring. Even if the transfer free energy is predicted similar with the two force fields (see Table 4), GAFF/IPolQ-Mod + LJ-fit determines a higher solubility of Mol5 in both solvents than GAFF/RESP. Still, both force fields clearly overestimate the transfer free energy of this complex and chloride containing compounds.
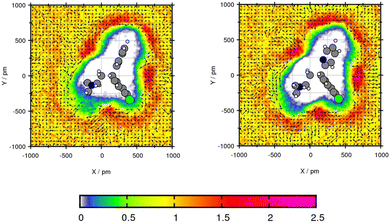 | ||
| Fig. 6 Plane projection analysis of Mol5 (chlorpheniramine maleate salt) in toluene using GAFF/RESP (left) and GAFF/IPolQ-Mod + LJ-fit (right). | ||
This analysis of the solvation structure of the three molecules in toluene indicates that by comparing both force fields, a higher peak in the plane projection analysis correlates with an increased predicted solubility.
Analysis of the solvent orientation
The second important insights of solvent–solute interaction that can be gained from the vector field in the plane projection analysis is the orientation of the solvents around the molecule. The base point of the array in the vector field is the C-atom C1 in the benzene ring and the tip point is the C-atom C7 of the methyl group as visualized in Fig. 7. The vector field of the three molecules Mol3, Mol4 and Mol11 in toluene show similar representations using the two force fields which indicates the independence of the chosen force field.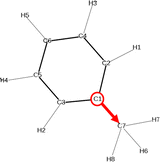 | ||
| Fig. 7 Chemical structure of the solvent toluene including the array that represents the arrays in the vector field in the following plane projection analyses. | ||
The transfer free energy for Mol3 and Mol4 is overestimated with both force fields in comparison to the experimental transfer free energy. Both compounds are predicted slightly better using GAFF/RESP. Mol3 and Mol4 do not contain oxygen, which might be the explanation for poor water solubility due to missing hydrogen bonding interactions. The plane projection analysis of Mol3 in toluene in Fig. 8 shows strongly increased solvent densities in the bows between the side chain, the triple fused ring and at the middle ring. The triple fused ring has been set in the plane. The peak intensity using GAFF/RESP is 2.54 times higher than the bulk density and using GAFF/IPolQ-Mod + LJ-fit, the peak is 2.88 times higher. The higher peak indicates stronger interaction between solute and solvent which is represented in the higher solubility using GAFF/IPolQ-Mod + LJ-fit (ΔGSolv = −18.98 kcal mol−1) compared to GAFF/RESP (ΔGSolv = −15.31 kcal mol−1). In the area of increased solvent density, the methyl group of the toluene points away from the ring structure for both force fields. The benzene rings rotate towards the triple ring structure of Amitriptyline. In the other two bows, the toluene molecules are alternating in the direction of the methyl group.
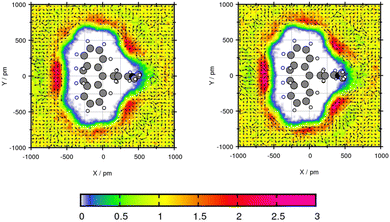 | ||
| Fig. 8 Plane projection analysis of Mol3 (amitriptyline) in toluene using GAFF/RESP (left) and GAFF/IPolQ-Mod + LJ-fit (right). | ||
For Mol4, the central C-atom is fixed by the plane which enables the side chains to create a comparable angle. Fig. 9 shows similar areas of increased solvent density and orientation of the toluene molecules for both force fields. The areas with increased toluene density are in the three bows between the three side chains of the central carbon atom. The peak is 2.25 for GAFF/RESP and 2.32 times the bulk density using GAFF/IPolQ-Mod + LJ-fit. In these three areas of increased solvent density, the methyl group of the toluene points towards the Bifonazole molecule. The most even arrangement of toluene can be seen in the bow between the ring that do not contain nitrogen. The large areas of increased solvent density around the compounds indicates high solubility of Mol4 in toluene GAFF/IPolQ-Mod + LJ-fit which can be seen in the solvation free energy of ΔGSolv = −20.37 kcal mol−1 using GAFF/IPolQ-Mod + LJ-fit in comparison to ΔGSolv = −17.27 kcal mol−1 using GAFF/RESP.
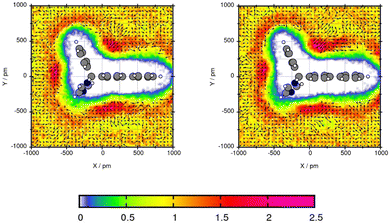 | ||
| Fig. 9 Plane projection analysis of Mol4 (bifonazole) in toluene using GAFF/RESP (left) and GAFF/IPolQ-Mod + LJ-fit (right). | ||
The plane projection analysis of Mol11 in toluene (Fig. 10) shows two areas of high solvent density. The cross section was created through the ring and the ethyl side group. Using GAFF/RESP, a solvent density around the acid of Mol11 is observed with a peak of 4.14 times higher than the bulk density. Using GAFF/IPolQ-Mod + LJ-fit the peak is 3.8 times higher than the toluene density in the bulk. The second area with a accumulation of solvent molecules is in the bow of the side chain and the fused pyridine ring. For both areas of high solvent density, GAFF/RESP shows higher peaks. The vector field clearly shows that in the area of high solvent density, the benzene ring is accumulated and the methyl groups points away from the molecule. The higher solvent density using GAFF/RESP disagrees with the higher solubility predicted using GAFF/IPolQ-Mod + LJ-fit (ΔGSolv = −18.90 kcal mol−1) in comparison to ΔGSolv = −17.05 kcal mol−1 using GAFF/RESP. The maximal peaks is located in different areas. This suggests that the area of increased solvent density is more significant for the solvation free energy than the peak value.
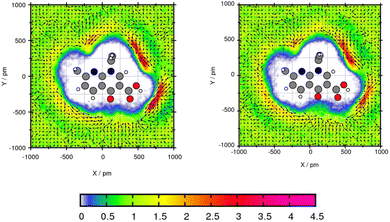 | ||
| Fig. 10 Plane projection analysis of Mol11 (nalidixic acid) in toluene using GAFF/RESP (left) and GAFF/IPolQ-Mod + LJ-fit (right). | ||
These insights of the solvent orientation and areas of high solvent density support the understanding of the mechanism of action of the drugs and therefore, it is crucial for drug development.
Detection and influence of hydrogen bonding interactions
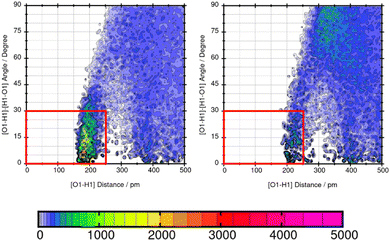
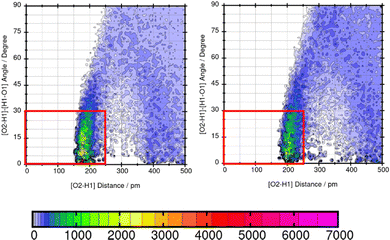
Lastly, the representation of hydrogen bonding (HB) interactions and other strong solute–solvent interaction effects the predicted solubility. The intermolecular interactions of significant atom pairs of the compound and water are analysed with the combined distribution function. The 2D plot visualizes structural information about the distance of two atoms that show distinct intermolecular interaction and their angle. The color coding symbolizes the occurrence of this combination of distance and angle. The area within the red box indicates the relevant distances and angles of the geometric criteria for hydrogen bonding interactions. According to our definition of the angle between N or O of the molecule and H–O from water, an angle of 0°–30° defines hydrogen bonding. The three molecules Mol11, Mol16 and Mol9 are in the focus in the following section.Mol11 contains an acid and a keto group attached to the fused pyridine rings. The combined distribution functions in Fig. 11 indicate strong intermolecular interaction between the acid group and the keto group in the ring structure of Mol11 and the solvent water. The strength of the solute–solvent interaction differs between the force field. A combined distribution analysis of the OH-part of the acid group of Mol11 and water yields in a different occurrence of hydrogen bonding interactions depending on the force field. Using GAFF/RESP, a much higher occurrence in the short distance and small angle region can be observed by the pink color whereas, a lower occurrence indicated by the orange color can be observed using GAFF/IPolQ-Mod + LJ-fit. The higher peak correlates with the higher solubility predicted with GAFF/RESP. The combined distribution function between the double bonded oxygen of the acid group can be seen in Fig. 12. The two force fields show a different strength of hydrogen bonding interactions. The pink color in the area of the red box indicates a higher probability of hydrogen bonding interaction using GAFF/RESP than with GAFF/IPolQ-Mod + LJ-fit. To select a suitable force field for the molecular dynamics simulation of drugs, a correct representation have to be ensured. Since in the SAMPL9 challenge, only the transfer free energies of the compounds are given for comparison, and not the solvation free energy in water, a trustful selection cannot be done at this point. The solvation free energy of Mol11 in water using GAFF/RESP is ΔGSolv = −16.26 kcal mol−1 and predicts a higher solubility than GAFF/IPolQ-Mod + LJ-fit (ΔGSolv = −15.81 kcal mol−1). This supports the findings that a higher peak in the combined distribution function for one of the force fields correlates with the prediction of a higher solubility in water.
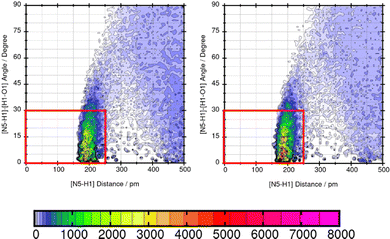
Mol16 is with a molecular weight of 408.32 g mol−1 a heavy molecule containing chloride. The transfer free energy is predicted very well using GAFF/IPolQ-Mod + LJ-fit. The intensity of the interaction between nitrogen and the solvent water is described as illustrated by Fig. 13. The combined distribution functions show strong interaction between the nitrogen and the solvent water. The simulation with GAFF/RESP shows a lower probability of H-bonds indicated by the orange color in the area of the geometric criteria of hydrogen bonding interaction whereas, GAFF/IPolQ-Mod + LJ-fit indicates a higher occurrence in the red marked area. In Fig. 14, the combined distribution function of the keto group of Trazodone Hydrochloride and the solvent water is shown. The H-bond interaction of the keto oxygen at the fused ring and the solvent indicates a higher occurrence in the area of short distances and small angles using GAFF/IPolQ-Mod + LJ-fit than GAFF/RESP. This is indicated by the more intensive pink color in the red box of the right plot in Fig. 14. The probability of hydrogen bonding interactions differs between the force fields and hence, the solubility of Mol16 in water is predicted much higher using GAFF/IPolQ-Mod + LJ-fit (ΔGSolv = −23.80 kcal mol−1) than using GAFF/RESP (ΔGSolv = −14.25 kcal mol−1). This leads to the assumption that the higher intensity of the nitrogen–solvent HB interaction strongly influences the solvation free energy.
As shown in Table 5, the maximum absolute deviation of ΔGSolv in water using the two different force fields in this study is observed for Mol9 with −5.72 kcal mol−1. This high difference in the description by the two force fields can be explained with the different representation of the tertiary amine at the end of the chain. Using GAFF/IPolQ-Mod + LJ-fit, a lower occurrence of hydrogen bonding interaction can be observed between the tertiary amine at the end of the chain of Mol9 and water. GAFF/RESP describes the intermolecular interaction with a higher probability of H-bonds, which is indicated by the warmer colors. This significant higher intensity using GAFF/RESP stays in contrast to the prediction of a lower solubility in water (ΔGSolv = −4.14 kcal mol−1) (Fig. 15).
These three example molecules Mol11, Mol16 and Mol9 in water show that a suitable force field has to be chosen according to the correct representation of hydrogen bonding interactions.
Conclusion
The SAMPL9 blind challenge enables to apply the force field GAFF/IPolQ-Mod + LJ-fit to 16 FDA-approved drugs and compare transfer free energies with results of the force field GAFF/RESP. A detailed structural analysis of the molecular dynamics simulations gives unique insights of intermolecular interactions and solvent orientations. The SAMPL9 compounds differ in functional groups and therefore cover a wide chemical space. Due to these differences of each compound, it is difficult to derive general statements.Since sulphur atom types are not yet included in the force field GAFF/IPolQ-Mod + LJ-fit, the inconsistency shows high deviation of the predicted transfer free energy to the experimental value. For more accurate predictions in future studies, the refit of Lennard-Jones parameters will be performed for sulphur atom types. The RMSD of the 12 non-sulphur containing compounds to the experimental values is in the upper midfield compared to the other participants of the SAMPL9 blind challenge. The coefficient of determination R2 is with 0.81 very high.
The comparison of the force fields shows that GAFF/IPolQ-Mod + LJ-fit, with the exception of Mol12, constantly overpredicts the transfer free energy. GAFF/RESP also tends to overpredict the transfer free energy for most of the compounds. The solvation free energies in water differ more between the force fields than in toluene. That might be related to the observation that the dipole moments predicted with GAFF/IPolQ-Mod + LJ-fit with the charge averaged between ab inito simulations of the molecule in vacuum and in water is higher than dipole moments of the GAFF/RESP model that uses the charges from ab inito simulations in vacuum.
There are three observations that can be gained from the detailed comparison of the force fields. Firstly, a higher peak of the solvent density around the solute correlates with a higher predicted solubility of the compound in toluene. The comparison of the two force fields is exemplary shown for three compounds. Secondly, important insights of solvent–solute interaction can be gained with molecular dynamics simulations. They enable to analyse the solvent orientation which increases the understanding of the mechanism of action of active pharmaceutical ingredients. The plane projection analysis including a vector field of the solvent toluene shows consistent orientations for both force fields that is demonstrated in this section with three examples. Lastly, the representation of strong intermolecular interaction such as hydrogen bonding interactions strongly correlates with the solvation free energy. Three examples of compounds in water show the different representation of the two force fields.
These blind predictions of the solvation free energy and the detailed analyses of pharmaceutical compounds benefit to the development of force fields and methods, and improve the accuracy of molecular dynamics simulations.
Author contributions
Miriam Sprick: methodology, validation, software, formal analysis, investigation, data curation, writing – original draft. Gabriele Raabe: supervision, validation, resources, data curation, writing – review and editing, project administration, funding acquisition.Conflicts of interest
The authors declare no conflict of interest.Acknowledgements
Miriam Sprick acknowledges funding by a Georg-Christoph-Lichtenberg Fellowship by the Federal State of Lower Saxony, Germany. Molecular dynamics simulations were performed with resources provided by the North-German Supercomputing Alliance (HLRN). We greatly appreciate the support. We appreciate the National Institutes of Health for its support of the SAMPL project via R01GM124270 to David L. Mobley (UC Irvine).Notes and references
- A. Leo, C. Hansch and D. Elkins, Chem. Rev., 1971, 71, 525–616 CrossRef CAS.
- P. Augustijns and M. E. Brewster, Solvent systems and their selection in pharmaceutics and biopharmaceutics, Springer, 2007, vol. 190 Search PubMed.
- M. R. Shirts and J. D. Chodera, J. Chem. Phys., 2008, 129, 124105 CrossRef PubMed.
- Y. Sugita, A. Kitao and Y. Okamoto, J. Chem. Phys., 2000, 113, 6042–6051 CrossRef CAS.
- G. Bussi, Mol. Phys., 2014, 112, 379–384 CrossRef CAS.
- A. Mecklenfeld and G. Raabe, Mol. Phys., 2017, 115, 1322–1334 CrossRef CAS.
- J. Wang, R. M. Wolf, J. W. Caldwell, P. A. Kollman and D. A. Case, J. Comput. Chem., 2004, 25, 1157–1174 CrossRef CAS PubMed.
- R. Woods and R. Chappelle, J. Mol. Struct., 2000, 527, 149–156 CrossRef CAS PubMed.
- A. Mecklenfeld and G. Raabe, ADMET and DMPK, 2020, 8, 274–296 Search PubMed.
- D. Cerutti and J. Rice, J. Phys. Chem. B, 2013, 117, 2328–2338 CrossRef CAS PubMed.
- H. S. Muddana, N. V. Sapra, A. T. Fenley and M. K. Gilson, J. Comput.-Aided Mol. Des., 2014, 28, 277–287 CrossRef CAS PubMed.
- A. Mey and B. Allen, arXiv, arXiv:2008.03067, 2020, preprint.
- P. V. Klimovich, M. R. Shirts and D. L. Mobley, J. Comput.-Aided Mol. Des., 2015, 29, 397–411 CrossRef CAS PubMed.
- D. Mobley, SAMPL9 – logP, 2023, https://github.com/samplchallenges/SAMPL9/tree/main/logP.
- R. Woods and R. Chappelle, J. Mol. Struct., 2000, 527, 149–156 CrossRef CAS PubMed.
- G. Raabe, Molecular Simulation Studies on Thermophysical Properties, Springer, 2017 Search PubMed.
- A. Mecklenfeld and G. Raabe, J. Chem. Theory Comput., 2017, 13, 6266–6274 CrossRef CAS PubMed.
- H. B. Schlegel, J. Binkley and J. Pople, Comput. Chem., 1982, 3, 214–218 CrossRef CAS.
- R. Dennington, T. A. Keith and J. M. Millam, GaussView Version 6, Semichem Inc., Shawnee Mission KS, 2019 Search PubMed.
- V. A. Rassolov, M. A. Ratner, J. A. Pople, P. C. Redfern and L. A. Curtiss, J. Comput. Chem., 2001, 22, 976–984 CrossRef CAS.
- K. E. Riley and P. Hobza, J. Phys. Chem. A, 2007, 111, 8257–8263 CrossRef CAS PubMed.
- B. P. Pritchard, D. Altarawy, B. Didier, T. D. Gibson and T. L. Windus, J. Chem. Inf. Model., 2019, 59, 4814–4820 CrossRef CAS PubMed.
- D. A. Case, et al., AMBER 2020, University of California, San Francisco, 2020 Search PubMed.
- A. W. Sousa da Silva and W. F. Vranken, BMC Res. Notes, 2012, 5, 1–8 CrossRef.
- J. Wang, W. Wang, P. A. Kollmann and D. A. Case, J. Mol. Graphics Modell., 2006, 25, 247260 CrossRef PubMed.
- L. Martnez, R. Andrade, E. G. Birgin and J. M. Martnez, J. Comput. Chem., 2009, 30, 2157–2164 CrossRef PubMed.
- S. Parameswaran and D. L. Mobley, J. Comput.-Aided Mol. Des., 2014, 28, 825–829 CrossRef CAS PubMed.
- W. L. Jorgensen, J. Chandrasekhar, J. D. Madura, R. W. Impey and M. L. Klein, J. Chem. Phys., 1983, 79, 926–935 CrossRef CAS.
- E. Lindahl, M. J. Abraham, B. Herr and D. van der Spoel, GROMACS 2019.6, 2019 DOI:10.5281/zenodo.3685922.
- N. Goga, A. Rzepiela, A. De Vries, S. Marrink and H. Berendsen, J. Chem. Theory Comput., 2012, 8, 3637–3649 CrossRef CAS PubMed.
- M. Abraham, et al. GROMACS User Manual version 2018, 2018.
- D. Van Der Spoel, E. Lindahl, B. Hess and H. J. Berendsen, J. Comput. Chem., 2005, 26, 1701–1718 CrossRef CAS PubMed.
- H. J. Berendsen, D. van der Spoel and R. van Drunen, Comput. Phys. Commun., 1995, 91, 43–56 CrossRef CAS.
- U. Essmann, L. Perera, M. L. Berkowitz, T. Darden, H. Lee and L. G. Pedersen, J. Chem. Phys., 1995, 103, 8577–8593 CrossRef CAS.
- T. C. Beutler, A. E. Mark, R. C. van Schaik, P. R. Gerber and W. F. Van Gunsteren, Chem. Phys. Lett., 1994, 222, 529–539 CrossRef CAS.
- H. J. Berendsen, J. P. Postma, W. F. Van Gunsteren, A. DiNola and J. R. Haak, J. Chem. Phys., 1984, 81, 3684–3690 CrossRef CAS.
- M. Parrinello and A. Rahman, J. Appl. Phys., 1981, 52, 7182–7190 CrossRef CAS.
- S. Nosé and M. Klein, Mol. Phys., 1983, 50, 1055–1076 CrossRef.
- M. Brehm, M. Thomas, S. Gehrke and B. Kirchner, J. Chem. Phys., 2020, 152, 164105 CrossRef CAS PubMed.
- M. Brehm and B. Kirchner, J. Chem. Inf. Model., 2011, 51(8), 2007–2023 CrossRef CAS PubMed.
- G. A. Jeffrey and W. Saenger, Hydrogen bonding in biological structure, Springer, 2012 Search PubMed.
- C. M. Hansen, Hansen Solubility Parameters. A user's handbook, CRC Press, Boca Raton, 2000 Search PubMed.
Footnote |
| † Electronic supplementary information (ESI) available. See DOI: https://doi.org/10.1039/d3cp04149b |
| This journal is © the Owner Societies 2024 |

