Exploring fullerene derivatives for optoelectronic applications: synthesis and characterization study†
Jovana
Jakšić
a,
Evgenija
Milinković
b,
Katarina
Cvetanović
 b,
Zorana Tokić
Vujošević
c,
Vladislav
Jovanov
b,
Aleksandra
Mitrović
b,
Zorana Tokić
Vujošević
c,
Vladislav
Jovanov
b,
Aleksandra
Mitrović
 *a and
Veselin
Maslak
 *a
*a
aFaculty of Chemistry, University of Belgrade, Studenstki trg 12, 11158, Belgrade, Serbia
bInstitute of Chemistry, Technology and Metallurgy, University of Belgrade, Njegoševa 12, 11000 Belgrade, Serbia
cDepartment of Organic Chemistry, University of Belgrade, Faculty of Pharmacy, Vojvode Stepe 450, 11221 Belgrade, Serbia
First published on 7th December 2023
Abstract
In this study, we conducted a comprehensive investigation of newly synthesized fullerene derivatives developed for potential application in perovskite solar cells (PSCs). We explored three novel dihydrofuran-fused C60 fullerene derivatives (13, 14, and 15) that were specifically designed to enhance solubility and interaction with the substrate, fluorine-doped tin oxide (FTO). A comparative analysis was performed, with reference to the widely used phenyl-C61-butyric acid methyl ester (PCBM) and compound 12, from which 13, 14, and 15 are derived, to assess the impact of sugar units on materials properties. The synthesized compounds demonstrated significant solubility in common organic solvents, a critical factor in their potential application in wet-processed PSCs. Our investigation included electrochemical property analysis, thin film deposition, surface characterization, and electrochemical impedance spectroscopy (EIS). EIS measurements unveiled key insights into charge transfer properties at the electrode/electrolyte interface, making the compounds attractive candidates for electron transport layers (ETLs) in PSCs.
Introduction
In the last decade, metal halide perovskite materials have garnered significant scientific interest, resulting in numerous studies exploring their physical properties and their incorporation in various optoelectronic devices such as solar cells, photodetectors (including X-ray detectors), light-emitting diodes, and lasers.1–4 Significant progress has been made in comprehending the fundamental crystallographic, optical, and electrical properties of perovskite materials. These advancements have led to a substantial increase in the power conversion efficiency of perovskite solar cells, rising from 3.8% to 25.7% in a decade, surpassing the efficiency of silicon-based multicrystalline solar cells (22.3%), copper indium gallium selenide (23.4%), and cadmium telluride (CdTe, 22.1%).5–12 Perovskite-based solar cells have numerous fabrication advantages since they can be easily deposited on lightweight, flexible plastic foils.In a perovskite solar cell, ETL plays a crucial role in facilitating the movement of electrons from the perovskite layer to the anode contact.13 Traditionally, these materials have faced limitations, primarily stemming from issues of stability, performance, and fabrication compatibility. Among the contenders, titanium dioxide (TiO2) has held a prominent position due to its electron transport capabilities; however, it has been marred by challenges linked to high-temperature processing and potential electrical instabilities.14 Amidst these challenges, a remarkable contender has risen to prominence – fullerenes, particularly fullerene derivatives, which have exhibited a level of resilience and enduring performance that justifies their characterization as “immortal” within the realm of PSCs.15
Advancement in fullerene chemistry16 and the synthesis of various solution-processable derivatives have propelled their widespread adoption as key components in various electronic devices. Notably, the phenyl-C61-butyric acid methyl ester (PCBM)17 is employed in a variety of applications, including organic solar cells18–21 and perovskite or inverted perovskite solar cells.22–25
When applied as ETLs in inverted perovskite solar cells, fullerene derivatives offer numerous advantages. These include improved electron transport, seamless compatibility with perovskite materials, and reduced hysteresis effects.26,27 To address limitations encountered with PCBM, such as limited solubility in aromatic solvents, sensitivity to light-soaking effects, and moisture susceptibility, diverse structural modifications have been explored, with successful derivatives featuring heterocyclic compounds containing nitrogen (N) and oxygen (O) atoms in ester or ether groups28–32
In this context, we have utilized cost-effective nitro-substituted sugars, specifically isosorbide, and isomanide, as starting materials to synthesize well-suited C60 derivatives. The development of novel fullerene derivatives holds immense promise for enhancing the efficiency and stability of perovskite solar cells, although it remains a challenging endeavor.23,33 Furthermore, conducting exhaustive characterization for individual perovskite solar cells corresponding to each compound within the series entails significant labour and resources. Recognizing this challenge, our research aimed to streamline the procedure by implementing a more efficient approach that eliminates the need for building complete solar cells. This approach allowed us to evaluate compounds based on essential characteristics such as absorption and charge transport properties. Consequently, it expedited the assessment of their potential, providing valuable insights into their suitability for perovskite solar cells.
In this study, we synthesized three novel fullerene derivatives, differing solely in their stereochemistry. This methodology was developed to effectively distinguish and discern between these compounds, facilitating a more efficient evaluation process.
Results and discussion
The dihydrofuran-fused C60 fullerene derivatives with sugar units (13, 14, 15) were synthesized following the procedure outlined in Scheme 1. The incorporation of sugar units was intended to enhance solubility and explore their interaction with the substrate, which is fluorine-doped tin oxide (FTO).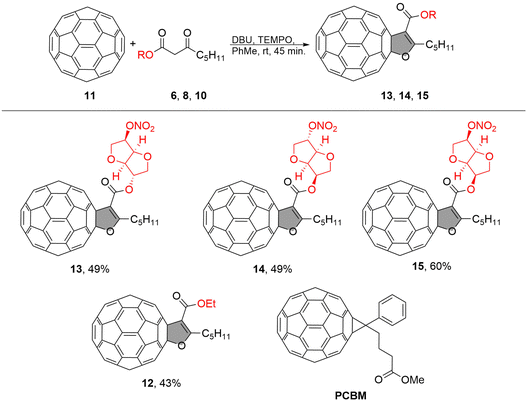 | ||
| Scheme 1 Synthetic protocol for obtaining fullerene derivatives 13, 14, 15 and their structures along with the reference compounds 12 and PCBM. | ||
For comparison, we selected PCBM as a well-known material and compound 12 as the reference material (as shown in Scheme 1). Compound 12, dihydrofuran C60 with an ethyl group, which had been synthesized previously,34 was chosen to assess whether the addition of a sugar component affects the material's properties. The fullerene-sugar adducts 13, 14, and 15 were obtained in a multistep synthetic route in which pristine fullerene C60 was covalently connected to the sugar by oxidative cycloaddition, which involved the preparation of the corresponding β-keto ester-sugar derivates as shown in Scheme 1.
The starting material, 3-oxooctanoic acid 2, was obtained with an 81% yield through the hydrolysis of methyl 3-oxooctanoate derived from Meldrum acid and hexanoyl chloride (as described in the ESI†). Despite the β-keto ester's propensity for decarboxylation, we successfully obtained the desired 3-oxooctanoic acid 2 in a good yield. The coupling of 3-oxooctanoic acid 2 with different isohexides (1,4:3,6-dianhydrohexitols) mononitrates was carried out using N,N′-dicyclohexylcarbodiimide (DCC) and 4-dimethylaminopyridine (DMAP) in dichloromethane (DCM) at room temperature for 24 hours, resulting in a 68–70% yield for sugar derivatives 6, 8, and 10. We used the commercially available isosorbide 5-mononitrate 5, isosorbide 2-mononitrate 7, while isomannide 5-mononitrate 9 was synthesized from neat isomannide through a sequence of reactions (as described in the ESI†). β-Keto esters possess an ambivalent nature due to the presence of both a carbonyl group and an α-hydrogen atom. This property renders them highly reactive towards a variety of nucleophiles and electrophiles, making them useful intermediates in many organic transformations. In a recent paper, we presented the synthesis of furan-fused fullerenes using a simple reaction protocol for oxidative cycloaddition reaction between medium chain β-keto esters and C60 in the presence of DBU and 2,2,6,6-tetramethylpiperidine-1-oxy (TEMPO) in toluene for 45 minutes at room temperature.34,35 The resulting procedure was now used to synthesize fullerene-sugar adducts 13, 14, and 15, which were obtained in yields ranging from 49% to 60%.
Dihydrofuran-fused fullerenes 13, 14, and 15 were synthesized for the first time with very good yields. Their structures were confirmed using HRMS, 1H NMR, 13C NMR, and UV-Vis (see ESI†). These products showed significant solubility in common organic solvents such as toluene, dichloromethane, and chloroform (approx. 40–60 mg mL−1). Due to the challenges in precisely estimating the solubility of intensely coloured compounds, the solubility of 14 was assessed using UV-Vis spectroscopy as a representative of the other compounds since they only differ in the stereochemistry of the sugar addend.35 The results indicated that 14 is soluble in toluene at concentrations of 60 mg mL−1. The significance of this property of furan-fused fullerenes lies in their potential applications and their amenability to processing in material chemistry. This is particularly noteworthy when considering that the solubility of PCBM in toluene does not surpass 19 mg mL−1.36
The electrochemical properties of C60, PCBM, and dihydrofuran-fused fullerenes 12, 13, 14, and 15 were investigated through cyclic voltammetry and linear sweep voltammetry (LSV) in solution. The resulting cyclic voltammetry (CV) and linear sweep voltammetry (LSV) data have been compiled in Table 1.
| Compd | E 1red (V) | LUMO (eV) | E g (eV) | HOMO (eV) | λ abs (nm) |
|---|---|---|---|---|---|
| C60 | −1.14 | −3.66 | 1.70 | −5.36 | 729 |
| 12 | −1.16 | −3.64 | 1.76 | −5.40 | 704 |
| 13 | −1.12 | −3.68 | 1.75 | −5.43 | 708 |
| 14 | −1.15 | −3.65 | 1.77 | −5.42 | 700 |
| 15 | −1.14 | −3.66 | 1.77 | −5.43 | 700 |
| PCBM | −1.24 | −3.56 | 1.73 | −5.29 | 717 |
The obtained products 12, 13, 14, and 15 exhibited four reversible reduction waves, which were attributed to the successive reductions of the C60 cage (refer to Fig. S41–S46, ESI†). The first reduction potentials (E1red) of the reaction products were similar to those of C60. Generally, when the C2v symmetry of C60 is disrupted, it becomes more challenging for the derivative to accept an electron. In this particular case, the dihydrofuran-fused fullerenes displayed either similar or slightly more negative values for the first reduction, consistent with the established rule.
Furthermore, we utilized the potential at the first reduction peak (E1red) to calculate the LUMO energy levels relative to the standard potential of the reference electrode. This calculation was performed using the following equation: E(LUMO) = −(E1red + 4.8) (eV). The energy gap for each compound was determined through Tauc plot analysis of the UV-Vis spectra in toluene.37–39 Subsequently, the final HOMO energy levels for each compound were calculated using the equation: E(HOMO) = E(LUMO) − energy gap (eV) (refer to Table 1 for details). The calculated energy levels are slightly higher than those of PCBM, as are the values of Eg.
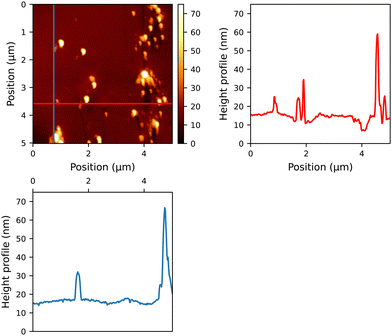
To assess the quality of the thin films generated by our compounds, they were deposited onto glass substrates. The samples, which were spin-coated in a consistent manner, displayed comparable absorbance intensity, which could be attributed to the uniform thickness achieved through the specified spin-coating parameters (see Fig. S48, ESI†). After the layers were washed from the plates, it was observed that the quantities of the samples exhibited minimal variation within the range of 0.3 mg to 0.5 mg. When these thin films were examined under AFM, several characteristics were detected (as depicted in Fig. 1 and Fig. S60–S64 in the ESI†). Reference compound 12, lacking a sugar moiety, formed spherical assemblies with distinct, round repetitive features (see Fig. S60, ESI†). Conversely, PCBM and the fullerene derivatives 13–15 exhibited relatively smooth surfaces, indicating the absence of significant aggregates on a molecular scale. The reduced roughness on the surface of the ETL can lead to a smoother interface between the ETL and the active layer.
Following the initial characterization of the thin films, further investigation of the fullerene derivatives involved their deposition onto the FTO substrate. The significant surface roughness of FTO posed a challenge in detecting the molecular arrangements of the samples (see Fig. S65–S66, ESI†). With the Raman spectroscopy (Fig. 2) we were able to see that, unlike glass, FTO does not provide complete coverage. Instead, the signals associated with fullerenes were detected mostly within the valleys of the wave-like FTO pattern.
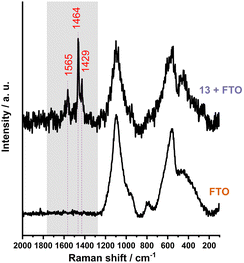 | ||
Fig. 2 The Raman spectrum (λmax = 532 nm) of the sample 13 displays bands corresponding to C–C (1429 cm−1), C![[double bond, length as m-dash]](https://www.rsc.org/images/entities/char_e001.gif) C (1464 cm−1) and C C (1464 cm−1) and C![[double bond, length as m-dash]](https://www.rsc.org/images/entities/char_e001.gif) O (1565 cm−1) vibrations. O (1565 cm−1) vibrations. | ||
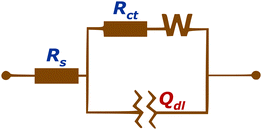
Considering the non-homogeneous nature of the surface on a microscopic scale, we conducted electrochemical impedance spectroscopy (EIS) measurements. These measurements involved the bare FTO sample as well as the fullerene samples deposited on FTO and were analyzed using an equivalent circuit.40 (see Fig. 3).
Elements of the equivalent circuits are Rs – resistance of wiring; Rct – resistance of charge transfer at the solid–electrolyte interface (double layer interface); Qdl – also noted as CPE (constant phase element), which represents the component that models the capacitive behavior of the working electrodes, which can be explained as an imperfect capacitor. Its impedance can be expressed as:
| ZCPE = (jω)−nC−1 |
| Sample | R s (Ω) | R ct (Ω) | W s(1/2)/Ω | Q dl (sN/Ω) × 10−6 | n |
|---|---|---|---|---|---|
| FTO | 21.2 | 41.0 | 0.028 | 4.60 | 0.942 |
| 12 | 24.7 | 19.1 | 0.007 | 9.97 | 1.000 |
| 13 | 49.9 | 34.1 | 0.020 | 7.95 | 0.996 |
| 14 | 48.7 | 35.9 | 0.025 | 4.62 | 1.000 |
| 15 | 27.1 | 36.7 | 0.024 | 6.36 | 1.000 |
| PCBM | 32.9 | 42.4 | 0.021 | 9.87 | 0.922 |
The Rs (solution resistance) value was found to be similar for all samples, mainly determined by the experimental setup and conditions. The Nyquist diagrams revealed a semi-circle representing the charge-transfer process at the interface for all samples (Fig. 4).
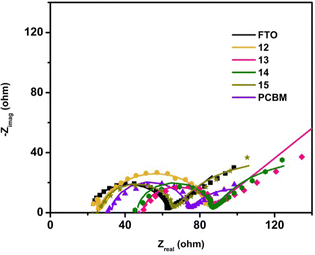 | ||
| Fig. 4 Nyquist diagram obtained by fitting the experimental result with the equivalent circuit from Fig. 1. Symbols represent experimental data, while straight lines represent the results of the fitting with an equivalent circuit. | ||
From the results in Table 2, samples 13, 14, and 15, which contain sugar units, exhibited comparable charge transfer resistance values at the electrode/electrolyte interface (34.1, 35.9, and 36.7 Ω). These values were lower than those observed for the bare FTO and PCBM samples (41.0 and 42.4 Ω), indicating facilitated charge transfer on surfaces with sugar units. Notably, the furan-fused fullerene derivative, sample 12, had the smallest Rct value of 19.1 Ω, suggesting its potential as an ETL candidate.
EIS measurements also revealed a diffusion process indicated by a 45° line in the Nyquist diagram for all samples (Fig. 4). This process results from fast charge transfer and the creation of a depletion region near the electrode surface, driven by a concentration gradient of the Fe3+/4+(CN)6 redox couple. All samples showed similar values of the Warburg impedance, indicating consistent behaviour of electroactive species in the electrolyte. The smallest Warburg impedance was observed for sample 12.
The Qdl values, representing the diameter of the charge-transfer semi-circle, suggest that the amount of deposited material may vary but is of the same order of magnitude for all samples. The n value was close to 1 for samples 12, 13, 14, and 15, suggesting the nature of the ideal capacitor.
Bode diagrams for the measured samples are presented in Fig. S65 (ESI†). The peak position in the Bode phase diagram is used for the determination of the electron lifetime (τ) in the samples (τ = 1/2πfmax), where fmax is the corresponding frequency of the peak maximum.41 Obtained values are presented in Table 3. The electron lifetime of samples 13, 14, and 15 are once again similar, while sample 12 has a significantly higher value of this parameter, indicating that this sample has a slower rate of charge carrier recombination. In the impedance magnitude diagram, one can notice a small shift of the peak toward lower frequencies, for samples 13, 14, 15, and especially sample 12, compared to FTO. This shift can also indicate the faster charge transfer in these samples.
| Sample | FTO | 12 | 13 | 14 | 15 | PCBM |
|---|---|---|---|---|---|---|
| T (ms) | 0.06 | 0.54 | 0.21 | 0.20 | 0.18 | 0.28 |
Additional information on the conductivity of the films was provided by studying the cyclic voltammetry response of a molecular probe on the film-coated electrode (Fig. 5). In this experiment, potassium ferro/ferricyanide was used as the molecular probe because it undergoes a reversible, one-electron redox reaction. Measured voltammograms are presented in Fig. 5, top. For the quantification of the conductivity, peak-to-peak distance was determined for each sample. The obtained results are presented in Table 4, an example of the peak-to-peak determination is given in Fig. 5, bottom. The smallest value of the calculated parameter is obtained for sample 12, meaning that this sample has the highest responsivity among all samples, 0.216 V, compared to the value obtained for the FTO of 0.403 V. Also, samples 13, 14, and 15 had somewhat smaller values for Up–p of 0.397, 0.380, and 0.379 V.
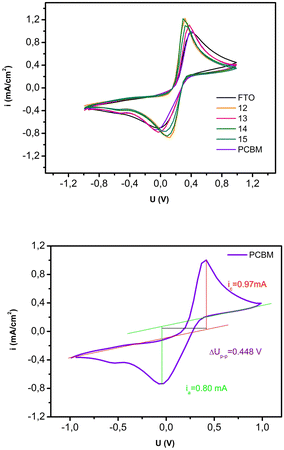 | ||
| Fig. 5 (top) Cyclic voltammograms of the measured samples 12, 13, 14, 15 and PCBM on FTO, (bottom) Measurement of the peak-to-peak potential for the PCBM sample. | ||
| Sample | FTO | 12 | 13 | 14 | 15 | PCBM |
|---|---|---|---|---|---|---|
| ΔUp–p(V) | 0.409 | 0.216 | 0.397 | 0.380 | 0.379 | 0.448 |
Conclusions
We synthesized three new fullerene derivatives and conducted a comprehensive characterization study to explore their potential for optoelectronic applications. The synthesized dihydrofuran-fused C60 fullerene derivatives with sugar units (compounds 13, 14, and 15) exhibited significant solubility in common organic solvents, which is crucial for their possible application in material chemistry. Considering the successful use of fullerenes in ETLs by T. Kirchartz's group, featuring a bandgap of Eg = 1.72 eV, resulting in open-circuit voltages exceeding 1.35 V and a power conversion efficiency enhancement of up to 18.9%, our samples, with a similar bandgap of around 1.7 eV, present promising candidates for solar cell construction.42Samples 13, 14, and 15, with particular emphasis on sample 12, exhibited lower values for charge transfer resistance and peak-to-peak potential compared to the reference PCBM. This suggests their potential to enhance charge transfer properties in perovskite solar cells. Additionally, AFM analysis revealed low roughness on flat surfaces, which could prove beneficial for an ETL. These results open up new avenues for further research and the optimization of these derivatives, contributing to the advancement of renewable energy technologies.
Materials and methods
Fullerene C60 and PCBM were bought from Merck.Sample preparation for spin-coating followed a standardized procedure. All substrates underwent the same cleaning process, involving ultrasonic treatment in detergent for 15 minutes, rinsing with DI water, and drying with N2. This was followed by ultrasonic treatment in isopropanol for 2 minutes, drying with N2, and immersing in acetone for 2 minutes, followed by N2 drying. After ultrasonic treatments, substrates were rinsed with ethanol, dried with N2, and exposed to an 18 minute UV-ozone cleaner treatment as a final step. In this study, the spin-coating method was employed for deposition. The toluene solution of the fullerene derivative was prepared a day in advance with a concentration of 4 mg mL−1. The solution was stirred on a hotplate at 45 °C for 5 hours and 15 minutes before spin-coating. For larger glass substrates measuring 2 × 2 cm2, 150 μL of the solution was sufficient to cover the entire surface, while 80 μL was used for 2 × 1 cm2 glass substrates. Spin-coating was performed in a single step by applying 3000 rpm for 30 seconds for each sample. Following spin-coating, the samples were dried on a hotplate at 45 °C for 1 minute and were ready for further investigation.
EI spectroscopy
The impedance was measured by applying an AC potential with a DC offset to the electrochemical cell, with the material of interest acting as the working electrode, and the current flowing through the cell was then measured. The obtained results were subsequently fitted with equivalent circuits containing different electrical elements, which represented the materials and interfaces of the inspected electrochemical cell. For the EIS measurements, an electrochemical cell was assembled using a water solution containing 5 × 10⁻⁴ mol dm−3 of K3[Fe(CN)6], 5 × 10⁻⁴ mol dm−3 of K4[Fe(CN)6], and 0.1 mol dm−3 of KCl as the electrolyte. The counter electrode was platinum mash. The measurements were conducted using the Ivium Vertex potentiostat with an impedance analyzer, and the IviumSoft software was used for fitting the obtained curves. The measurements were performed with an open circuit DC offset of 0.22 V and a 50 mA AC component. The frequency range was set to 0.1–10![[thin space (1/6-em)]](https://www.rsc.org/images/entities/char_2009.gif) 000 Hz. The system was purged with nitrogen for 15 minutes before each measurement, and an equilibrium time of 60 s was set. All EIS fitting procedures were performed with a chi factor of 10−3.
000 Hz. The system was purged with nitrogen for 15 minutes before each measurement, and an equilibrium time of 60 s was set. All EIS fitting procedures were performed with a chi factor of 10−3.
Cyclic voltammetry (CV) of the synthesized fullerene derivatives dissolved in solution was conducted at room temperature. Tetrabutylammonium hexafluorophosphate (nBu4NPF6) at a concentration of 0.1 M was used as a supporting electrolyte. The solvent employed was o-dichlorobenzene/dimethylformamide (o-DCB/DMF, 100![[thin space (1/6-em)]](https://www.rsc.org/images/entities/char_2009.gif) :
:![[thin space (1/6-em)]](https://www.rsc.org/images/entities/char_2009.gif) 1 v/v). The reference electrode used was Ag/AgCl, and the working electrode was a glassy carbon electrode (GCE). The scan rate was set at 50 mV s−1.
1 v/v). The reference electrode used was Ag/AgCl, and the working electrode was a glassy carbon electrode (GCE). The scan rate was set at 50 mV s−1.
The investigation of the thin film of our compounds on FTO also employed CV experiments. The electrolyte used for this type of CV consisted of a water solution containing 5 × 10⁻⁴ mol dm−3 of K3[Fe(CN)6], 5 × 10⁻⁴ mol dm−3 of K4[Fe(CN)6], and 0.1 mol dm−3 of KCl. The voltammetric sweep ranged from −1 to 1 V. In this experiment, the samples as thin films on the FTO were connected as the working electrode, the platinum mash was used as the counter electrode, and the reference electrode was Ag/AgCl. All measurements were performed after a previous purging with N2 for 10 minutes.
UV-Vis measurements of the fullerene derivatives, which had been deposited on the microscopic glasses, were analyzed in the wavelength range of 325–1000 nm.
Conflicts of interest
There are no conflicts to declare.Acknowledgements
This research is funded by the Serbian Ministry of Science, Technological Development and Innovation, grant no. 451-03-47/2023-01/200026 and grant no. 451-03-9/2021-14/200168.References
- Y.-H. Kim, S. Kim, A. Kakekhani, J. Park, J. Park, Y.-H. Lee, H. Xu, S. Nagane, R. B. Wexler, D.-H. Kim, S. H. Jo, L. Martínez-Sarti, P. Tan, A. Sadhanala, G.-S. Park, Y.-W. Kim, B. Hu, H. J. Bolink, S. Yoo, R. H. Friend, A. M. Rappe and T.-W. Lee, Nat. Photonics, 2021, 15, 148–155 CrossRef CAS.
- L. K. Ono, S. Liu and Y. Qi, Angew. Chem., Int. Ed., 2020, 59, 6676–6698 CrossRef CAS PubMed.
- Y. Zhou, J. Chen, O. M. Bakr and O. F. Mohammed, ACS Energy Lett., 2021, 6, 739–768 CrossRef CAS.
- L. Lei, Q. Dong, K. Gundogdu and F. So, Adv. Funct. Mater., 2021, 31, 2010144 CrossRef CAS.
- J. Jeong, M. Kim, J. Seo, H. Lu, P. Ahlawat, A. Mishra, Y. Yang, M. A. Hope, F. T. Eickemeyer, M. Kim, Y. J. Yoon, I. W. Choi, B. P. Darwich, S. J. Choi, Y. Jo, J. H. Lee, B. Walker, S. M. Zakeeruddin, L. Emsley, U. Rothlisberger, A. Hagfeldt, D. S. Kim, M. Grätzel and J. Y. Kim, Nature, 2021, 592, 381–385 CrossRef CAS PubMed.
- M. A. Green, E. D. Dunlop, D. H. Levi, J. Hohl-Ebinger, M. Yoshita and A. W. Y. Ho-Baillie, Prog. Photovoltaics Res. Appl., 2019, 27, 565–575 CrossRef.
- J. Benick, A. Richter, R. Müller, H. Hauser, F. Feldmann, P. Krenckel, S. Riepe, F. Schindler, M. C. Schubert, M. Hermle, A. W. Bett and S. W. Glunz, IEEE J. Photovolt., 2017, 7, 1171–1175 Search PubMed.
- J. Miao and F. Zhang, J. Mater. Chem. C, 2019, 7, 1741–1791 RSC.
- M. Nakamura, K. Yamaguchi, Y. Kimoto, Y. Yasaki, T. Kato and H. Sugimoto, IEEE J. Photovolt., 2019, 9, 1863–1867 Search PubMed.
- G. Nazir, S.-Y. Lee, J.-H. Lee, A. Rehman, J.-K. Lee, S. I. Seok and S.-J. Park, Adv. Mater., 2022, 34, 2204380 CrossRef CAS PubMed.
- Y. Wu, Q. Wang, Y. Chen, W. Qiu and Q. Peng, Energy Environ. Sci., 2022, 15, 4700–4709 RSC.
- National Renewable Energy Laboratory Best Research-Cell Efficiencies, https://www.nrel.gov/pv/assets/pdfs/best-research-cell-efficiencies.20191106.pdf, NREL, 2019.
- D. Bi, W. Tress, M. I. Dar, P. Gao, J. Luo, C. Renevier, K. Schenk, A. Abate, F. Giordano, J.-P. Correa Baena, J.-D. Decoppet, S. M. Zakeeruddin, M. K. Nazeeruddin, M. Grätzel and A. Hagfeldt, Sci. Adv., 2016, 2, e1501170 CrossRef PubMed.
- T. Xue, D. Chen, T. Li, X. Chou, X. Wang, Z. Tang, F. Zhang, J. Huang, K. Guo and A. V. Takaloo, Micromachines, 2023, 14 DOI:10.3390/mi14061095.
- K. Wojciechowski, T. Leijtens, S. Siprova, C. Schlueter, M. T. Hörantner, J. T.-W. Wang, C.-Z. Li, A. K. Y. Jen, T.-L. Lee and H. J. Snaith, J. Phys. Chem. Lett., 2015, 6, 2399–2405 CrossRef CAS PubMed.
- M. Prato, J. Mater. Chem., 1997, 7, 1097–1109 RSC.
- J. C. Hummelen, B. W. Knight, F. LePeq, F. Wudl, J. Yao and C. L. Wilkins, J. Org. Chem., 1995, 60, 532–538 CrossRef CAS.
- D. Chi, S. Qu, Z. Wang and J. Wang, J. Mater. Chem. C, 2014, 2, 4383–4387 RSC.
- Z. Sun, M. Liu, Y. Zhou, Q. Wang, Y. Yang, Y. Zhou and F. Liu, Sol. Energy Mater. Sol. Cells, 2022, 235, 111453 CrossRef CAS.
- D. Payno, Y. Sánchez, O. Blázquez, S. Giraldo, M. Salado, S. Kazim, E. Saucedo and S. Ahmad, J. Mater. Chem. C, 2020, 8, 12533–12542 RSC.
- Y. Wang, L. Wang, Y. Wang, X. Zhao, X. Zhang, X. Zhang and Y. Liu, Phys. Status Solidi RRL, 2023, 2300186 CrossRef.
- G. Tchutchulashvili, K. P. Korona, W. Mech, S. Chusnutdinow, M. Sobanska, K. Klosek, Z. R. Zytkiewicz and W. Sadowski, J. Nanopart. Res., 2020, 22, 1–9 CrossRef.
- M. Ai, M. Chen and S. Yang, Chin. J. Chem., 2023, 41, 2337–2353 CrossRef CAS.
- S. Liu, V. P. Biju, Y. Qi, W. Chen and Z. Liu, NPG Asia Mater., 2023, 15, 27 CrossRef CAS.
- Y. Zhong, M. Hufnagel, M. Thelakkat, C. Li and S. Huettner, Adv. Funct. Mater., 2020, 30, 1908920 CrossRef CAS.
- R. Zahran and Z. Hawash, Adv. Mater. Interfaces, 2022, 9, 2201438 CrossRef CAS.
- A. A. Said, J. Xie and Q. Zhang, Small, 2019, 15, 1900854 CrossRef PubMed.
- A. B. Sieval, N. D. Treat, D. Rozema, J. C. Hummelen and N. Stingelin, Chem. Commun., 2015, 51, 8126–8129 RSC.
- S. Erten-Ela, H. Chen, A. Kratzer, A. Hirsch and C. J. Brabec, New J. Chem., 2016, 40, 2829–2834 RSC.
- Y. Xing, C. Sun, H. L. Yip, G. C. Bazan, F. Huang and Y. Cao, Nano Energy, 2016, 26, 7–15 CrossRef CAS.
- S. Shao, M. Abdu-Aguye, L. Qiu, L.-H. Lai, J. Liu, S. Adjokatse, F. Jahani, M. E. Kamminga, G. H. ten Brink, T. T. M. Palstra, B. J. Kooi, J. C. Hummelen and M. A. Loi, Energy Environ. Sci., 2016, 9, 2444–2452 RSC.
- Y. Bai, Q. Dong, Y. Shao, Y. Deng, Q. Wang, L. Shen, D. Wang, W. Wei and J. Huang, Nat. Commun., 2016, 7, 12806 CrossRef CAS PubMed.
- M. M. Elnaggar, A. V. Mumyatov, N. A. Emelianov, L. G. Gutsev, V. V. Ozerova, I. V. Fedyanin, Y. V. Nelyubina, S. I. Troyanov, B. R. Ramachandran and P. A. Troshin, Sustainable Energy Fuels, 2023, 7, 3893–3901 RSC.
- J. Jakšić, A. Mitrović, Z. Tokić Vujošević, M. Milčić and V. Maslak, RSC Adv., 2021, 11, 29426–29432 RSC.
- J. Jakšić, I. Solymosi, A. Hirsch, M. E. Pérez-Ojeda, A. Mitrović and V. Maslak, Chem. – Eur. J., 2023, 29, e202301061 CrossRef PubMed.
- C. I. Wang and C. C. Hua, J. Phys. Chem. B, 2015, 119, 14496–14504 CrossRef CAS PubMed.
- K. Kutlu, P. Kavak, E. A. Parlak, A. E. Saatci, F. P. Gökdemir, U. D. Menda and O. Özdemir, AIP Conf. Proc., 2013, 1569, 283–287 CrossRef.
- T. E. Saraswati, U. H. Setiawan, M. R. Ihsan, I. Isnaeni and Y. Herbani, Open Chem., 2019, 17, 1198–1212 CAS.
- I. Gutiérrez-González, B. Molina-Brito, A. W. Götz, F. L. Castillo-Alvarado and J. I. Rodríguez, Chem. Phys. Lett., 2014, 612, 234–239 CrossRef.
- P. Topolovsek, F. Lamberti, T. Gatti, A. Cito, J. M. Ball, E. Menna, C. Gadermaier and A. Petrozza, J. Mater. Chem. A, 2017, 5, 11882–11893 RSC.
- M. H. Elbakkay, W. M. A. El Rouby, A. Mariño-López, A. Sousa-Castillo, V. Salgueiriño, S. I. El-Dek, A. A. Farghali, M. A. Correa-Duarte and P. Millet, Int. J. Hydrogen Energy, 2021, 46, 31216–31227 CrossRef CAS.
- Z. Liu, J. Siekmann, B. Klingebiel, U. Rau and T. Kirchartz, Adv. Energy Mater., 2021, 11, 2003386 CrossRef CAS.
Footnote |
| † Electronic supplementary information (ESI) available. See DOI: https://doi.org/10.1039/d3cp04322c |
| This journal is © the Owner Societies 2024 |

