Adsorption and sensing performance of air pollutants on a β-TeO2 monolayer: a first-principles study†
Ying
Wang
a,
Shiying
Guo
 *a,
Xiaoyong
Xu
 a,
Jing
Pan
 a,
Jingguo
Hu
 a and
Shengli
Zhang
 *b
*b
aCollege of Physics Science and Technology, Yangzhou University, Yangzhou, 225009, Jiangsu, China. E-mail: guosy@yzu.edu.cn
bMIIT Key Laboratory of Advanced Display Materials and Devices, Ministry of Industry and Information Technology, Institute of Optoelectronics & Nanomaterials, Nanjing University of Science and Technology, Nanjing, 210094, Jiangsu, China. E-mail: zhangslvip@njust.edu.cn
First published on 4th December 2023
Abstract
Two-dimensional (2D) β-TeO2 is a novel semiconductor with potential applications in electronic circuits due to its air-stability and ultra-high carrier mobility. In this study, we explore the possibility of using a 2D β-TeO2 monolayer for the detection of gaseous pollutants including SO2, NO2, H2S, CO2, CO, and NH3 gas molecules based on first-principles calculations. The adsorption properties including the adsorption energy, adsorption distance and charge transfer indicate that the interaction between 2D β-TeO2 and the six gases is via a physisorption mechanism. Among the six gas adsorption systems, the SO2 adsorption system has the most negative adsorption energy and the largest charge transfer. In addition, the adsorption of SO2 obviously changes the electrical conductivity of the β-TeO2 monolayer because the band gap decreases from 2.727 eV to 1.897 eV after adsorbing SO2. Our results suggest that the 2D β-TeO2 should be an eminently promising SO2 sensing material.
1. Introduction
The continuous production of air pollutants not only causes severe environmental problems but also threatens human health.1,2 The typical gaseous pollutants are carbon oxides such as carbon monoxide (CO), sulfides such as sulfur dioxide (SO2) and hydrogen sulfide (H2S), nitrides such as nitrogen dioxide (NO2) and ammonia (NH3), which are mainly produced from fossil fuel burning and leakage from industrial manufacture.3–6 Long-term excessive exposure to these pollutants will cause respiratory diseases and even death.7,8 Therefore, ideal gas sensors that possess high sensitivity, selectivity of the adsorbents, good stability, fast response, and appropriate recovery time are necessarily required for the detection of such toxic gases.9,10Since the discovery of graphene in 2004,11 two-dimensional (2D) materials have attracted great interest from scientists owing to their excellent physical and chemical properties, such as the large surface-to-volume ratio, excellent carrier mobility, and high stability.12,13 2D materials such as graphene,14–16 transition metal dichalcogenides,17,18 transition metal oxides,19,20 and group-VA materials21–26 have been extensively studied in the application of gas sensors.27 The lack of band gap restricts the application of graphene in gas sensors even though it exhibits excellent gas-sensitive properties.28 Transition metal dichalcogenides, such as MoS2, have a suitable band gap but are chemically inert under most conditions, limiting their physical adsorption with gas molecules.29 Transition metal oxide-based sensors are important gas detectors with high sensitivity, but the high working temperature may cause high-power consumption and safety issues.30 The 2D β-TeO2 monolayer was predicted to be a stable semiconductor with a wide direct band gap and high carrier mobility based on first-principles calculations.31 In 2021, 2D β-TeO2 was successfully synthesized via molten droplet methods. 2D β-TeO2 nanosheets exhibit a high on/off ratio on the order of 106 and high field-effect hole mobility,32–34 and are a promising candidate for powering electronics and optoelectronic applications. However, relatively little research has been devoted to the gas-sensing properties of 2D β-TeO2. It is necessary to explore the sensing performance of 2D β-TeO2.
In this work, we investigate the adsorption properties and sensing performance of a 2D β-TeO2 monolayer for SO2, NO2, H2S, CO2, CO, and NH3 gas molecules based on density functional theory (DFT). The adsorption energy, Bader charge, and charge density difference (CDD) are calculated, indicating that the adsorption behavior of the six gases over the β-TeO2 monolayer suggests a physisorption mechanism. Among the six gas adsorption systems, the SO2 adsorption system has the most negative adsorption energy of −0.388 eV and the largest charge transfer. The electronic properties of the β-TeO2 monolayer after adsorbing the six gases are investigated, including the band structure and density of states. The results show that SO2 adsorption contributes to the obvious changes in electronic properties, suggesting that the β-TeO2 monolayer has a high sensitivity to SO2 molecules. Finally, the desorption behavior of the six gases on the β-TeO2 monolayer is evaluated. The recovery time of the SO2 adsorption system is 3.55 μs at room temperature. Considering the high sensitivity and appropriate recovery time of the SO2 adsorption system, 2D β-TeO2 has great potential as a SO2 sensing material for reusable gas sensors.
2. Computational methods
Based on DFT calculations, structural relaxation and electronic calculations are carried out by using the Vienna Ab initio Simulation Package (VASP).35 The exchange–correlation effects are treated by the generalized gradient approximation (GGA) with the Perdew–Burke–Ernzerhof (PBE) functional.36,37 In consideration of van der Waals interaction correction, the DFT-D3 method is applied.38 The cutoff energy is set to 500 eV and the energy of convergence limit is set to 1 × 10⁻⁵ eV. In order to avoid the influence between the adjacent layers of β-TeO2 monolayer, the vacuum thickness along the Z-direction is set to 40 Å. The k-points are set to 11 × 11 × 1 for the calculations of the unit cell.39 The 2 × 2 × 1 and 3 × 3 × 1 supercells of β-TeO2 were tested for SO2 adsorption. The adsorption energies and adsorption distances for the 2 × 2 × 1 and 3 × 3 × 1 supercells are nearly identical. Hence, the 2 × 2 × 1 supercell is sufficiently large for the gas adsorption and we use a 2 × 2 × 1 supercell of β-TeO2 monolayer for the gas adsorption calculations. A 5 × 5 × 1 k-point mesh is adopted for the calculations of the supercell.To analyze the stability of the adsorption structure, the adsorption energy is determined by the formula as follows:
| Eads = ETeO2+gas − ETeO2 − Egas |
The CDD of adsorption systems is calculated by the equation:
| Δρ = ρgas/TeO2 − ρgas − ρTeO2 |
Ab initio molecular dynamics (AIMD) calculations are performed in the NVT ensemble lasting for 5 ps at a temperature of 300 K with a time step of 4 fs. A 3 × 3 × 1 supercell of β-TeO2 monolayer is constructed for the simulation. The Nosé–Hoover method is used to control the temperature.
3. Results and discussion
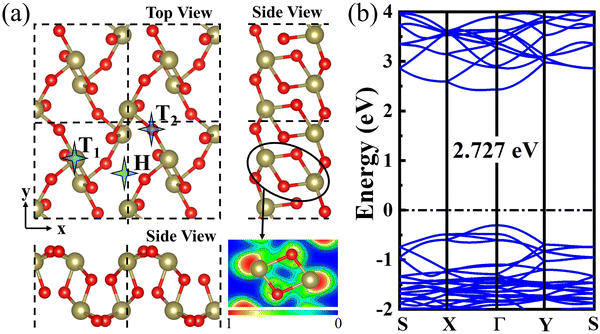
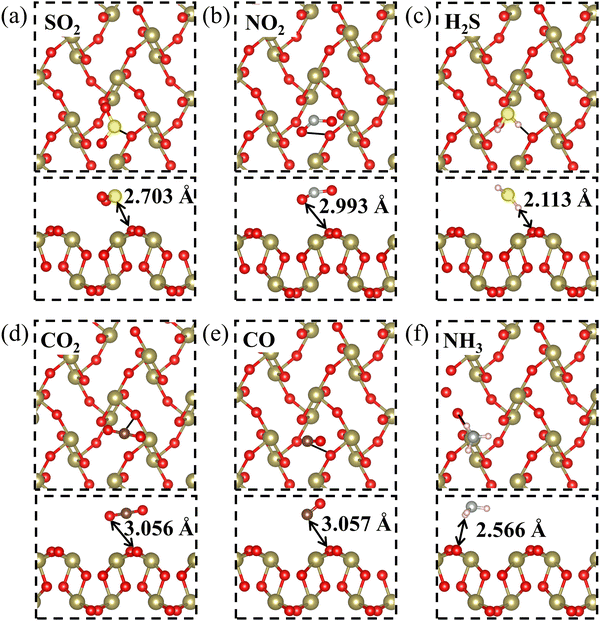
The optimized structure of the 2D β-TeO2 monolayer is presented in Fig. 1(a), with the lattice parameters of a = 5.44 Å, b = 5.76 Å, belonging to the space group P21/C. The calculated lattice parameters are consistent with the results in the previous research.40 The electron localization functional (ELF) suggests that one Te atom is covalently bonded to four nearest-neighbor O atoms,41 resulting in a rectangular lattice. The β-TeO2 monolayer has a wavy structure as seen from the side views. The band structure of the β-TeO2 monolayer is shown in Fig. 1(b). The β-TeO2 monolayer has a band gap of 2.727 eV, with the valence band maximum (VBM) located at the Γ point and the conduction band minimum (CBM) very close to the Γ point.Firstly, in order to explore the adsorption behavior of several gaseous pollutants (SO2, NO2, H2S, CO2, CO, and NH3) on the β-TeO2 monolayer, three possible adsorption sites are taken into consideration, namely the top site above the Te atom (T1), the top site above the O atom (T2), and the hollow site (H), as illustrated in Fig. 1(a). The orientations of the gas molecules are also considered, including whether gas molecules are positioned vertically or parallelly with different atoms facing the β-TeO2 monolayer on the three possible adsorption sites. The initial distance between all gas molecules and the β-TeO2 monolayer is 3 Å. After full optimization, we compare the energy of different adsorption systems (Fig. S1–S6, ESI†) and obtain the most stable adsorption structures, as shown in Fig. 2. The detailed adsorption parameters of the most stable adsorption structures are listed in Table 1, including the most stable adsorption site, adsorption energy, adsorption distance, and charge transfer. The calculated results show that for the NH3 adsorption system, the most stable site is above the Te atom (T1), and for the other gas adsorption systems, the most stable site is the hollow site (H).
| Gas type | Site | E ads (eV) | D (Å) | Q (e) |
|---|---|---|---|---|
| SO2 | H | −0.388 | 2.703 | 0.079 |
| NO2 | H | −0.202 | 2.993 | 0.050 |
| H2S | H | −0.298 | 2.113 | 0.003 |
| CO2 | H | −0.240 | 3.056 | 0.021 |
| CO | H | −0.156 | 3.057 | 0.009 |
| NH3 | T1 | −0.178 | 2.566 | −0.018 |
As shown in Fig. 2, the adsorption distances of the six gas adsorption configurations range from 2.113 Å to 3.057 Å, which are larger than the sum of corresponding atomic covalent radii.42 We preliminarily estimate that no chemical bonds are formed between the β-TeO2 monolayer and all gas molecules. Moreover, the Eads of the six gas adsorption structures are from −0.156 eV to −0.388 eV. The values of both the adsorption energy and the adsorption distance suggest that all six gas molecules are physically adsorbed on the β-TeO2 monolayer.43,44 We then calculated the Bader charge to quantify the amount of charge transfer (Q) between the gas molecules and β-TeO2 monolayer.45 The positive value of Q is indicative of the electrons transferred from the β-TeO2 monolayer to gas molecules. The positive Q for SO2, NO2, H2S, CO2 and CO adsorption systems reflects the β-TeO2 monolayer donating electrons to the gases. The Q of the NH3 adsorption system is negative, indicating that the β-TeO2 monolayer is an electron acceptor gaining 0.018 electrons from the NH3 molecule. It is noted that 0.079 electrons are transferred from the β-TeO2 monolayer to the SO2 molecule, which is the largest value among the six gas adsorption systems. As mentioned above, the adsorption of SO2 on the β-TeO2 monolayer induces the largest charge transfer and the most negative adsorption energy among the six gas molecules.
Furthermore, in order to gain an intuitionistic insight into the charge redistribution of the six adsorption systems, the charge density difference is calculated, as shown in Fig. 3. The blue region represents the electron depletion and the yellow region represents the electron accumulation. For the SO2 adsorption system in Fig. 3(a), we find that the SO2 molecule is mainly surrounded by electron accumulation, indicating its electron-accepting behavior. It is demonstrated that the charge redistribution of the SO2 molecule adsorption is much more intense than those of other adsorption systems, which suggests that the interaction between the SO2 molecule and β-TeO2 monolayer is stronger than those of other gases. Overall, compared with the other five gas adsorption systems, the SO2 adsorption system shows a higher adsorption energy and charge transfer, and stronger electron depletion and electron accumulation.
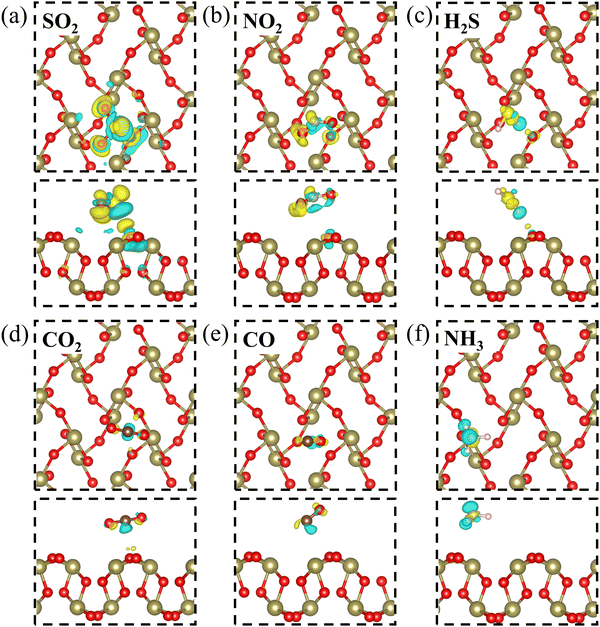 | ||
| Fig. 3 The charge density difference of (a) SO2, (b) NO2, (c) H2S, (d) CO2, (e) CO, and (f) NH3 adsorbed over the β-TeO2 monolayer. The iso-surface is 0.001 e bohr−3. | ||
In order to explore the effect of gas adsorption on the electronic properties of the β-TeO2 monolayer, the band structures of the six adsorption systems are performed in Fig. 4. As seen from Fig. 4(a), the adsorption of SO2 gives rise to an impurity energy level near 1.6 eV. In Fig. 4(b), one can see that two impurity energy levels are introduced near the CBM and VBM after the NO2 adsorption, respectively. After the adsorption of H2S and NH3, an impurity energy level appears between the Fermi level and VBM, as shown in Fig. 4(c) and (f). In addition, for the adsorption of CO2 and CO on the β-TeO2 monolayer in Fig. 4(d) and (e), there is no significant change in the band structure since the positions of the VBM and CBM hardly change. Whether the adsorption of gas molecules leads to the change of the band gap of the β-TeO2 monolayer is further analyzed in the following discussion.
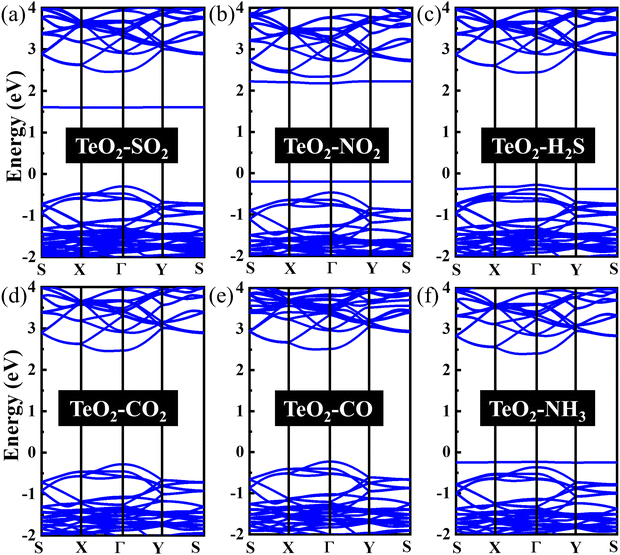 | ||
| Fig. 4 The band structures of (a) SO2, (b) NO2, (c) H2S, (d) CO2, (e) CO, and (f) NH3 adsorbed over the β-TeO2 monolayer. The Fermi level is assigned to 0 eV. | ||
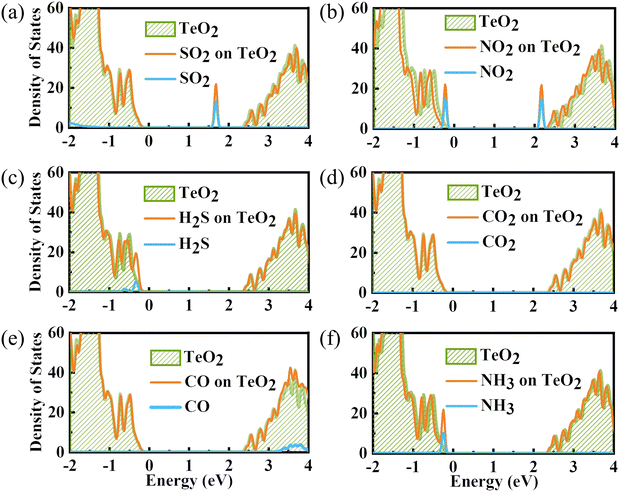
To gain a full understanding of the adsorption mechanism, the density of states of the adsorbed gas molecules and the β-TeO2 monolayer before and after the gas adsorption are calculated in Fig. 5. And the projected density of states (PDOS) of interacting atoms in various adsorption systems are shown in Fig. 6. As displayed in Fig. 5(a), there is an additional peak appearing near the energy level of 1.7 eV, which is almost contributed by SO2. Fig. 6(a) shows that the additional peak near 1.7 eV is mainly occupied by the S-p orbitals and O-p orbitals of SO2 molecules, followed by the O-p orbitals and Te-p orbitals of the β-TeO2 monolayer. The O-p orbitals of SO2 are also hybridized with the p orbitals of O and Te from the β-TeO2 monolayer near the energy level of −3.4 eV and the O-p orbitals of the β-TeO2 monolayer near the energy level of −2.5 eV.
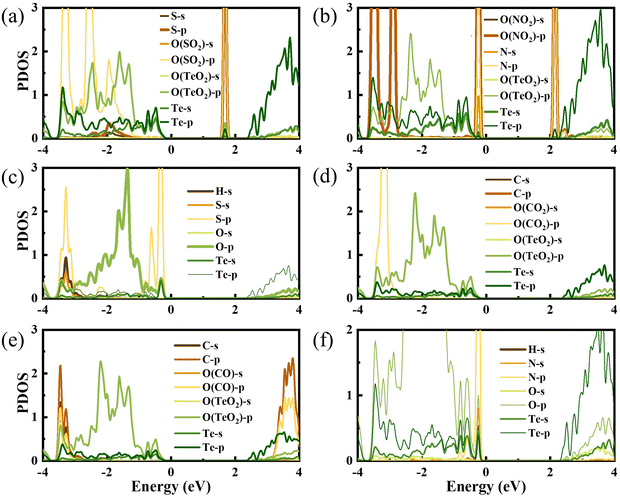 | ||
| Fig. 6 The projected density of states of (a) SO2, (b) NO2, (c) H2S, (d) CO2, (e) CO, and (f) NH3 adsorption systems. The Fermi level is assigned to 0 eV. | ||
In Fig. 5(b), two additional peaks appear near the CBM and VBM, respectively, arising from the NO2 adsorption. Through the PDOS in Fig. 6(b), the additional peak near the energy level of −0.2 eV is mainly due to the hybridizations of O-p orbitals, N-p orbitals and N-s orbitals from NO2, followed by O-p orbitals, Te-s orbitals and Te-p orbitals from the β-TeO2 monolayer and O-s orbitals from NO2. The overlaps near −3.5 eV are mainly from the O-p orbitals of NO2, and O-p orbitals, Te-s orbitals and Te-p orbitals of the β-TeO2 monolayer. Both of the H2S and NH3 adsorption systems have an additional peak near the VBM, as shown in Fig. 5(c) and (f). In Fig. 6(c), it is found that the additional peak near −0.32 eV in the H2S adsorption system is contributed by the hybridization of S-p orbitals of H2S, and O-p orbitals, Te-s orbitals and Te-p orbitals of the β-TeO2 monolayer. A few overlaps appear near the energy level of −3.4 eV, mainly from H-s orbitals, S-s orbitals, S-p orbitals, O-p orbitals and Te-p orbitals. From the PDOS of the NH3 adsorption system in Fig. 6(f), the additional peak near −0.18 eV is mainly composed of p orbitals of N and O elements, followed by N-s orbitals, H-s orbitals, Te-s orbitals and Te-p orbitals. Furthermore, the above results indicate that the adsorption of SO2, NO2, H2S and NH3 induces the impurity states of the β-TeO2 monolayer due to the interaction between the gas molecule and β-TeO2 monolayer, leading to the gap modulation. Hence, combined with the band structures in Fig. 4, we can conclude that the adsorption of NO2, H2S, and NH3 slightly reduces the values of the band gap of the β-TeO2 monolayer to 2.379 eV, 2.705 eV, and 2.624 eV, respectively. In particular, the adsorption of SO2 generates a significant decrease in the band gap of the β-TeO2 monolayer and the band gap decreases to 1.897 eV.
While for the CO and CO2 adsorption systems in Fig. 5(d) and (e), no additional peaks emerged from the adsorbed CO and CO2 around the energy level from the VBM to the CBM, indicating that there is no significant change in the electronic properties of the β-TeO2 monolayer. In Fig. 6(d), there is almost no orbital hybridization from −2 eV to 3 eV between the gas molecules and β-TeO2 monolayer. For the CO adsorption system, the overlaps arise near −3.4 eV, which are from the C-s orbitals, C-p orbitals and O-p orbitals from CO, and O-p orbitals and Te-p orbitals from the β-TeO2 monolayer.
In order to further indicate the effect of the adsorption of SO2 on the electronic properties of the β-TeO2 monolayer, we compare the PDOS of SO2 adsorbed on the β-TeO2 monolayer and the system where SO2 is positioned 10 Å above the β-TeO2 monolayer, as shown in Fig. S7 (ESI†). The interaction with SO2 shifts the peak of the SO2 state from 1.27 eV to 1.70 eV and induces an impurity state of the β-TeO2 monolayer between the band gap. The impurity state of the β-TeO2 monolayer is contributed by O-p orbitals and Te-p orbitals of the atoms neighboring the SO2, which is indicated by Fig. 6(a). This change of electronic properties for the system is caused by the charge redistribution post-adsorption.29
The electrical conductivity is a significant parameter for resistivity-type gas sensors, since the gas sensing response of the sensing material depends on the detectable changes in conductivity.46 We evaluate the conductivity (σ) and sensitivity of adsorption systems using the following equations:47–49
σ ∝ exp(−Eg/2kT)
| S = (1/σgas/TeO2 − 1/σTeO2)/(1/σgas/TeO2) |
| Gas type | E g (eV) | ΔEg (%) | |S| | τ (μs) |
|---|---|---|---|---|
| SO2 | 1.897 | 30.01 | 9.37 × 10⁶ | 3.55 |
| NO2 | 2.379 | 12.57 | 836.67 | 2.29 × 10⁻³ |
| NH3 | 2.624 | 3.69 | 6.33 | 1.05 × 10⁻³ |
| H2S | 2.705 | 0.79 | 0.53 | 0.101 |
| CO2 | 2.732 | −0.21 | 0.09 | 0.0107 |
| CO | 2.731 | −0.15 | 0.07 | 4.87 × 10⁻⁴ |
 | ||
| Fig. 7 (a) The change of band gap (ΔEg) and the absolute value of sensitivity, and (b) the recovery time of the β-TeO2 monolayer after the adsorption of the six gases. | ||
We evaluate the reusability of the sensing material by calculating the recovery time (τ), which signifies the time that the gas is desorbing from the adsorbed surface. On the basis of the conventional theory of transmission state mode, the τ can be related to the adsorption energy (Eads) and working temperature (T), assessed by the formula as follows:50
τ = ν0−1![[thin space (1/6-em)]](https://www.rsc.org/images/entities/char_2009.gif) exp(−Eads/kT) exp(−Eads/kT) |
Furthermore, we investigate the SO2 desorption process by using the 3 × 3 × 1 β-TeO2 monolayer at room temperature (T = 300 K) through AIMD simulations. As shown in Fig. S8 and S9 (ESI†), the in-plane distance between SO2 and the O atom of the β-TeO2 monolayer increases from 2.71 Å to 7.78 Å after 5 ps. And the height of SO2 fluctuated between 2.622 Å and 3.442 Å, which is consistent with the almost invariable adsorption energy. These results predict that SO2 can effectively diffuse on the surface of the β-TeO2 monolayer at room temperature. In addition, the PDOS of two alternative adsorption configurations from the AIMD simulations with the adsorption distances of 2.982 Å and 3.442 Å are calculated, as shown in Fig. S10 (ESI†). The results show that during the AIMD simulations, there is always an additional peak appearing between the energy level of 1.5 eV and 2.0 eV, which is contributed by SO2 and the β-TeO2 monolayer. Consequently, the influence of SO2 adsorbed on the β-TeO2 monolayer is continuous, indicating a persistent sensor response.
Finally, we compare the detection of gas molecules on the β-TeO2 monolayer with other pure 2D materials. The adsorption of NO2, H2S, CO2, CO, and NH3 on the β-TeO2 monolayer is comparable with the adsorption of H2S on MoS2,54,55 NH3 on MoS2 and WS2,56 CO2 on MoTe2,57 and NO2 on graphene,58 such that the adsorption energies range from 0.1 eV to 0.2 eV and the change of band structure is not significant. Compared with MoS2,29 the β-TeO2 monolayer possesses a more negative adsorption energy for SO2 and an obvious variation of band gap, illustrating its more sensitive detection.
4. Conclusion
In conclusion, we predict the possibility of using 2D β-TeO2 as a sensing material for the detection of air pollutants (SO2, NO2, H2S, CO2, CO, and NH3) by using first principles calculations. Based on the analysis of adsorption energy, the shortest adsorption distance, charge transfer and CDD, we can infer that the interaction between the six gases and β-TeO2 monolayer is a physisorption mechanism. The SO2 adsorption system has a more negative energy of −0.388 eV and a larger charge transfer of 0.079 e than the other five gas adsorption systems. In addition, the band gap of the β-TeO2 monolayer after adsorbing SO2 decreases from 2.726 eV to 1.897 eV, contributing to an obvious change in conductivity and a high sensitivity compared with other gases. The recovery time of the SO2 adsorption system is 3.55 μs. Therefore, we predict that the 2D β-TeO2 monolayer as a reusable gas sensor has a high sensitivity at room temperature for SO2 detection.Conflicts of interest
There are no conflicts to declare.Acknowledgements
This work is supported by the National Natural Science Foundation of China (12074332, 21903014 and 11974303). The authors are grateful for access to the computational resources at YZU.References
- M. Kampa and E. Castanas, Environ. Pollut., 2008, 151, 362–367 CrossRef CAS PubMed.
- F. Perera and K. Nadeau, New Engl. J. Med., 2022, 386, 2303–2314 CrossRef CAS PubMed.
- A. Aasi, B. Mortazavi and B. Panchapakesan, Appl. Surf. Sci., 2022, 579, 152115 CrossRef CAS.
- M. Jiang, K. Xu, N. Liao and H. Zhou, Appl. Surf. Sci., 2021, 543, 148846 CrossRef CAS.
- X. Xia, S. Guo, L. Xu, T. Guo, Z. Wu and S. Zhang, IEEE Electron Device Lett., 2021, 42, 573–576 CAS.
- S. H. Cho, S. Lee, Y. Kim, H. Song, J. Lee, Y. F. Tsang, W. H. Chen, Y. K. Park, D. J. Lee, S. Jung and E. E. Kwon, Sci. Total Environ., 2023, 868, 161655 CrossRef CAS PubMed.
- R. Li, X. Kou, J. Tian, Z. Meng, Z. Cai, F. Cheng and C. Dong, Chemosphere, 2014, 112, 296–304 CrossRef CAS PubMed.
- M. A. H. Khan, M. V. Rao and Q. Li, Sensors, 2019, 19, 905 CrossRef PubMed.
- A. Sharma, M. S. Khan, M. Husain, M. S. Khan and A. Srivastava, IEEE Sens. J., 2018, 18, 2853–2860 CAS.
- J. Zhang, X. Liu, G. Neri and N. Pinna, Adv. Mater., 2016, 28, 795–831 CrossRef CAS PubMed.
- K. S. Novoselov, A. K. Geim, S. V. Morozov, D. Jiang, Y. Zhang, S. V. Dubonos, I. V. Grigorieva and A. A. Firsov, Science, 2004, 306, 666–669 CrossRef CAS PubMed.
- S. Z. Butler, S. M. Hollen, L. Cao, Y. Cui, J. A. Gupta, H. R. Gutiérrez, T. F. Heinz, S. S. Hong, J. Huang, A. F. Ismach, E. Johnston-Halperin, M. Kuno, V. V. Plashnitsa, R. D. Robinson, R. S. Ruoff, S. Salahuddin, J. Shan, L. Shi, M. G. Spencer, M. Terrones, W. Windl and J. E. Goldberger, ACS Nano, 2013, 7, 2898–2926 CrossRef CAS PubMed.
- S. Yang, C. Jiang and S. H. Wei, Appl. Phys. Rev., 2017, 4, 021304 Search PubMed.
- S. Gupta Chatterjee, S. Chatterjee, A. K. Ray and A. K. Chakraborty, Sens. Actuators, B, 2015, 221, 1170–1181 CrossRef CAS.
- S. S. Varghese, S. Lonkar, K. Singh, S. Swaminathan and A. Abdala, Sens. Actuators, B, 2015, 218, 160–183 CrossRef CAS.
- F. Schedin, A. K. Geim, S. V. Morozov, E. W. Hill, P. Blake, M. I. Katsnelson and K. S. Novoselov, Nat. Mater., 2007, 6, 652–655 CrossRef CAS PubMed.
- D. Pang, P. Shi, L. Lin, K. Xie, C. Deng and Z. Zhang, Phys. Chem. Chem. Phys., 2023, 25, 6626–6635 RSC.
- D. Chen, X. Zhang, J. Tang, Y. Li, Z. Cui and Q. Zhou, IEEE Trans. Electron Dev., 2018, 66, 689–695 Search PubMed.
- Y. Zhang, Y. Wang, L. Zhu, R. Zhang and J. Cao, Vacuum, 2021, 193, 110526 CrossRef CAS.
- S. Wang, D. Huang, S. Xu, W. Jiang, T. Wang, J. Hu, N. Hu, Y. Su, Y. Zhang and Z. Yang, Phys. Chem. Chem. Phys., 2017, 19, 19043–19049 RSC.
- X. Chen, L. Wang, X. Sun, R. Meng, J. Xiao, H. Ye and G. Zhang, IEEE Electron Device Lett., 2017, 38, 661–664 CAS.
- H. Cui, K. Zheng, L. Tao, J. Yu, X. Zhu, X. Li and X. Chen, IEEE Electron Device Lett., 2019, 40, 1522–1525 CAS.
- S. Y. Guo, Y. P. Zhang, Y. Q. Ge, S. L. Zhang, H. B. Zeng and H. Zhang, Adv. Mater., 2019, 31, 1902352 CrossRef PubMed.
- S. L. Zhang, Z. Yan, Y. F. Li, Z. F. Chen and H. B. Zeng, Angew. Chem., Int. Ed., 2015, 54, 3112–3115 CrossRef CAS PubMed.
- S. L. Zhang, M. Q. Xie, F. Y. Li, Z. Yan, Y. F. Li, E. J. Kan, W. Liu, Z. F. Chen and H. B. Zeng, Angew. Chem., Int. Ed., 2016, 55, 1666–1669 CrossRef CAS PubMed.
- S. L. Zhang, S. Y. Guo, Z. F. Chen, Y. L. Wang, H. J. Gao, J. Gómez-Herrero, P. Ares, F. Zamora, Z. Zhu and H. B. Zeng, Chem. Soc. Rev., 2018, 47, 982–1021 RSC.
- H. Cui, X. Zhang, J. Zhang and Y. Zhang, High Volt., 2019, 4, 242–258 CrossRef.
- M. Xu, T. Liang, M. Shi and H. Chen, Chem. Rev., 2013, 113, 3766–3798 CrossRef CAS PubMed.
- E. Piosik and M. J. Szary, Appl. Surf. Sci., 2023, 638, 158013 CrossRef CAS.
- H. F. Chai, Z. C. Zheng, K. W. Liu, J. Y. Xu, K. D. Wu, Y. F. Luo, H. L. Liao, M. Debliquy and C. Zhang, IEEE Sens. J., 2022, 22, 5470–5481 CAS.
- S. Guo, Z. Zhu, X. Hu, W. Zhou, X. Song, S. Zhang, K. Zhang and H. Zeng, Nanoscale, 2018, 10, 8397–8403 RSC.
- A. Zavabeti, P. Aukarasereenont, H. Tuohey, N. Syed, A. Jannat, A. Elbourne, K. A. Messalea, B. Y. Zhang, B. J. Murdoch, J. G. Partridge, M. Wurdack, D. L. Creedon, J. van Embden, K. Kalantar-Zadeh, S. P. Russo, C. F. McConville and T. Daeneke, Nat. Electron., 2021, 4, 277–283 CrossRef CAS.
- S. Y. Guo, H. Z. Qu, W. H. Zhou, S. Y. A. Yang, Y. S. Ang, J. Lu, H. B. Zeng and S. L. Zhang, Phys. Rev. Appl., 2022, 17, 064010 CrossRef CAS.
- X. Zhang, L. Feng, H. Li, Y. Liu, P. Liu, X. Zheng, M. Qu, X. Wang and J. He, Mater. Today Nano, 2023, 24, 100392 CrossRef CAS.
- P. E. Blöchl, Phys. Rev. B: Condens. Matter Mater. Phys., 1994, 50, 17953–17979 CrossRef.
- W. Kohn and L. J. Sham, Phys. Rev., 1965, 140, A1133–A1138 CrossRef.
- J. P. Perdew, K. Burke and M. Ernzerhof, Phys. Rev. Lett., 1996, 77, 3865 CrossRef CAS PubMed.
- S. Grimme, J. Antony, S. Ehrlich and H. Krieg, J. Chem. Phys., 2010, 132, 154104 CrossRef PubMed.
- H. J. Monkhorst and J. D. Pack, Phys. Rev. B: Solid State, 1976, 13, 5188–5192 CrossRef.
- R. K. Biswas and S. K. Pati, Mater. Res. Bull., 2021, 141, 111343 CrossRef CAS.
- A. D. Becke and K. E. Edgecombe, J. Chem. Phys., 1990, 92, 5397–5403 CrossRef CAS.
- P. Pyykkö and M. Atsumi, Chem. – Eur. J., 2009, 15, 186–197 CrossRef PubMed.
- B. Gergen, H. Nienhaus, W. H. Weinberg and E. W. McFarland, Science, 2001, 294, 2521–2523 CrossRef CAS PubMed.
- Y. Yong, H. Cui, Q. Zhou, X. Su, Y. Kuang and X. Li, Appl. Surf. Sci., 2019, 487, 488–495 CrossRef CAS.
- G. Henkelman, A. Arnaldsson and H. Jónsson, Comput. Mater. Sci., 2006, 36, 354–360 CrossRef.
- H. Cui, X. Zhang, G. Zhang and J. Tang, Appl. Surf. Sci., 2019, 470, 1035–1042 CrossRef CAS.
- X. Zhang, L. Yu, X. Wu and W. Hu, Adv. Sci., 2015, 2, 1500101 CrossRef PubMed.
- H. Sun, L. Q. Tao, T. Li, X. Gao, T. Sang, Y. Li, Y. Wei, G. Wang, Z. Peng, Y. Gui, S. Y. Xia and J. Li, Appl. Surf. Sci., 2022, 572, 151212 CrossRef CAS.
- Y. Yong, W. Zhang, Q. Hou, R. Gao, X. Yuan, S. Hu and Y. Kuang, Appl. Surf. Sci., 2022, 606, 154806 CrossRef CAS.
- S. Guo, X. Hu, Y. Huang, W. Zhou, H. Qu, L. Xu, X. Song, S. Zhang and H. Zeng, Appl. Surf. Sci., 2021, 541, 148494 CrossRef CAS.
- S. Peng, K. Cho, P. Qi and H. Dai, Chem. Phys. Lett., 2004, 387, 271–276 CrossRef CAS.
- Y. Yong, H. Cui, Q. Zhou, X. Su, Y. Kuang and X. Li, RSC Adv., 2017, 7, 51027–51035 RSC.
- S. Ding and W. Gu, J. Mol. Liq., 2022, 345, 117041 CrossRef CAS.
- V. M. Bermudez, J. Phys. Chem. C, 2020, 124, 15275–15284 CrossRef CAS.
- M. J. Szary, Appl. Surf. Sci., 2021, 547, 149026 CrossRef CAS.
- V. Babar, H. Vovusha and U. Schwingenschlögl, ACS Appl. Nano Mater., 2019, 2, 6076–6080 CrossRef CAS.
- M. J. Szary, D. M. Florjan and J. A. Bąbelek, ACS Sens., 2022, 7, 272–285 CrossRef CAS PubMed.
- N. M. Caffrey, R. Armiento, R. Yakimova and I. A. Abrikosov, Phys. Rev. B, 2016, 94, 205411 CrossRef.
Footnote |
| † Electronic supplementary information (ESI) available. See DOI: https://doi.org/10.1039/d3cp04400a |
| This journal is © the Owner Societies 2024 |

