 Open Access Article
Hydration effects on thermal transitions and molecular mobility in Xanthan gum polysaccharides†
Sokratis N.
Tegopoulos
 a,
Aristeidis
Papagiannopoulos
 b and
Apostolos
Kyritsis
 *a
*a
aPhysics Department, National Technical University of Athens, Iroon Polytechneiou 9, Zografou Campus, Athens, 15780, Greece. E-mail: akyrits@central.ntua.gr
bTheoretical and Physical Chemistry Institute, National Hellenic Research Foundation, 48 Vassileos Constantinou Avenue, 11635, Athens, Greece
First published on 28th December 2023
Abstract
In this work, the xanthan gum (XG) polysaccharide is studied over a wide range of temperatures and water fractions 0 ≤ hw ≤ 0.70 (on a wet basis) by employing differential scanning calorimetry (DSC) and broadband dielectric spectroscopy (BDS). The investigation reveals that the critical water fraction for ice formation is about 0.35. Glass transition temperature (Tg) was determined through calorimetry experiments for all the samples studied. Water acts as a strong plasticizer, i.e., decreasing Tg, for water fractions up to about 0.35. A secondary (local) relaxation process is recorded in both dry and hydrated samples, which is sensitive to the presence of water molecules. This fact indicates that this process originates due to the orientation of small polar groups of the side chain, or/and due to the local main chain dynamics. Two types of long-range charge transport processes were resolved. The first is related to the conductive paths being formed via bulk-like ice structures (at high hydration levels), whereas the second can be attributed to proton mobility via the hydrogen bond (HB) network of non-freezing water existing in XG. Interestingly, this process is exactly the same in all the hydrated samples with hw > 0.25. With respect to the sample with hw = 0.27, a Vogel–Tammann–Fulcher (VTF)-like polarization process has also been recorded which seems to be related to long-range charge mobility via interconnected water clusters. As far as we are aware, this is the first time that XG is studied in terms of glass transition and molecular mobility over a wide range of hydration levels combining DSC and BDS techniques.
1. Introduction
Polysaccharides are among the most important organic molecules in nature. Their primary structure exhibits great diversity in terms of composition, molecular weight, and configuration. This fact results in an almost infinite number of chemical structures and conformational properties. If the role of hydration content is also taken into account, it can be assumed that additional variability may occur.1 Hydrocolloids are a special class of polysaccharides that contain many hydroxyl groups and therefore can bind water molecules.2Xanthan gum (XG) is an extracellular hydrocolloid of high molar mass (106–107 Da) which is secreted by the bacterium, Xanthomonas campestris.3,4 The XG backbone consists of a β-1,4-glycosidic bond-linked main chain and a trisaccharide side chain successively containing D-mannose (b-1,4), D-glucuronic acid (b-1,2) and a terminal D-mannose which contains a pyruvic acid residue linked via a keto group to the 4 and 6 positions.5 It is an anionic polyelectrolyte whose charge originates from the side-chain mannose group and glucuronic residues.3,6 XG is used in a wide range of applications in the food industry7–9 and biomedicine.5,10 As a natural polysaccharide, XG offers some very important advantages such as biodegradability, biocompatibility, and nontoxicity.11–13
Water plays a vital role in biological processes and is essential to life and human activity. This is because water significantly affects the catalytic chemical reactions of biopolymers and also acts as a medium that determines the dynamics and structure of biopolymers.14–17 During the last few years, water and its role in the functionality of biopolymers have attracted much attention. The effect of water on biopolymers’ viscoelasticity, glass transition, and origin of water–carbohydrate interactions is still of particular interest.3 When a polymer is in a glassy state, the rotation around bonds between successive monomers in the polymer backbone is impossible. Therefore, the backbone remains rigid and the viscosity of the system is very high at ∼1012–13 Pa s. The addition of water lowers the glass transition temperature (Tg) as water acts as a plasticizer that enhances the mobility of the macromolecules. However, for many “ordered” biopolymers (polysaccharides and globular proteins), a clear glass transition is not always observed through calorimetry or the transition step is very broad.3,18,19 However, there is no doubt anymore that biopolymers behave the same as synthetic high MW polymers.20
It is well established that water molecules in close proximity to biomolecules significantly affect the morphology and dynamics of the macromolecules, while the hydrogen bond (HB) network they form and participate in differs remarkably as compared to that of bulk water. Therefore, the properties of this so-called interfacial or hydration water may reveal specific features of water–polymer interactions.15,21–25 Among other issues, the non-freezing fraction of adsorbed water,18,26,27 the confinement of water molecules28,29 and the process of ice formation at sub-zero temperatures and the dynamics in partially crystallized water mixtures30–37 are topics that provide insight into the properties of hydration water. Especially for polysaccharides, it is known that a small amount of water significantly affects the Tg of the hydrated polysaccharide by disrupting inter-molecular hydrogen bonds. In addition, it is suggested that when water molecules act as plasticizers, some degree of alignment of the saccharide units is induced (for water contents up to 25%, which is nonfreezing water).21,25,38
Over the last few years, there has been a significant increase in the number of studies concerning XG in aqueous solutions, whereas the order–disorder transition of XG has been widely discussed in the literature.9,39–44 In contrast, only a limited amount of work about the glass transition and other thermal transitions of XG gum can be found in the literature. Yoshida et al.45 studied the phase transitions of the XG–water system using differential scanning calorimetry and reported that the glass transition was found below −73 °C in samples with water content (hd) between 0.4 and 2.0 (on a dry basis). Another transition has been also found in the high-temperature range (∼30 °C, depending on the hd) that was attributed to the transition from the mesophase to the isotropic liquid state and was detected only in the samples with low water content. In the same context, another work on XG gels reported that a sol–gel transition was observed in the temperature range of 47 °C depending on the molecular weight.39 The glass transition was also found at temperatures below −73 °C in samples with high water contents, the Tg being decreasing with increasing hd and reached a minimum at hd = 0.5. As far as we are aware, this work includes the only phase diagram of the XG gum-water system including the glass-transition, cold-crystallization temperature, melting temperature, and liquid–crystal–liquid transition temperature that has been reported so far. Some other works46 are in line with the concept that Tg decreases with an increase in water content, as moisture acts as a plasticizer and significantly alters the Tg in amorphous solids but disagree on the values of Tg (in the aforementioned work, Tg varied from −16 °C to −23 °C with increasing water content). In contrast, Raschip et al. also worked on XG–water systems in a wide range of hydrations but no clear glass or melting transitions associated with XG were observed over the temperature range of the experiments (from −60 °C to +120 °C).47 Finally, Kocherbitov et al.48 studied the hydration properties of XG gum and used a modulated DSC method over a temperature range from −40 °C to +120 °C to detect thermal transitions and reported that the glass transition of dry XG gum is at 60 °C.
Given the above information, there are some controversial results regarding even the existence of a glass to liquid transition or the water content dependence of Tg in XG gum. Therefore, the aim of the present work is to study the thermal transitions of XG and the effects of hydration over a wide range of temperature and water content using differential scanning calorimetry (DSC) and broadband dielectric spectroscopy (BDS) techniques and the investigation of the organization of the absorbed water within the polysaccharide. To the best of our knowledge, it is the first study on XG molecular mobility and hydration properties over a wide range of temperature and water content using different experimental techniques.
2. Experimental
2.1. Materials and sample preparation
XG gum from Xanthomonas Campestris was purchased from Sigma-Aldrich (product number G1253). The molecular weight is estimated to be 106 Da. For both DSC and BDS experiments, the different hydration levels of the samples, which were in the form of compressed pellets, were achieved by exposure to saturated atmospheres of salt solutions of specific relative humidity, RH (33, 65, 75, 85, 95, and 98%) in sealed jars for 5–6 days to equilibrate to constant weight. We should clarify that the RH of air is defined as the ratio of air vapor pressure to its saturation vapor pressure.49 The hydration level of the samples is expressed in terms of water fraction, hw, on a wet basis, using the following equation (eqn (1)): | (1) |
2.2. Differential scanning calorimetry (DSC)
DSC experiments were performed using a TA Q200 series DSC instrument. High-purity helium was the purge gas (selected flow was 25 mL min−1) and indium was used for calibration regarding temperature and enthalpy calculations. Measurements were performed on samples of ∼15–20 mg using standard Tzero aluminum pans and aluminum hermetic lids to avoid the evaporation of water inside the samples. DSC standard scans were performed at a cooling/heating rate of 10 °C min−1, while the temperature range was from room temperature (∼25 °C) to −150 °C (cooling) and vice versa (during heating). In addition, for temperature modulation DSC (TMDSC) runs, an amplitude ±1 °C with a period of 60 s and a heating rate of 2 °C min−1 were selected, while the temperature range was from −100 °C to 100 °C. Tg was estimated using the “half extrapolated tangents” method using TA Universal software, while enthalpies of crystallization and melting, ΔHcr, ΔHm respectively, were calculated by integrating the area of each peak.2.3. Broadband dielectric spectroscopy (BDS)
For BDS measurements, the hydrated samples were placed between finely polished round electrodes (brass plates) forming a planar capacitor of 10 mm diameter. The complex dielectric function (dielectric permittivity) ε*(f) = ε′(f) − iε′′(f) was determined as a function of frequency (f) in the range 10−1 to 106 Hz at temperatures from −150 °C to 40 °C on heating in steps of 10 °C using a Novocontrol Alpha analyzer. Dielectric isochronal measurements were also performed during cooling at three preselected frequencies (103, 104 and 105 Hz) in order to monitor any crystallization event that may occur. The temperature was controlled to better than 0.5 °C employing a Novocontrol Quatro cryosystem.Fitting results
To evaluate and interpret dielectric behavior most effectively, raw data were analyzed by fitting model functions. More specifically, the Havriliak–Negami (HN)50–52 equation (eqn (2)) was used for the analysis, | (2) |
3. Results and discussion
3.1. Differential scanning calorimetry (DSC)
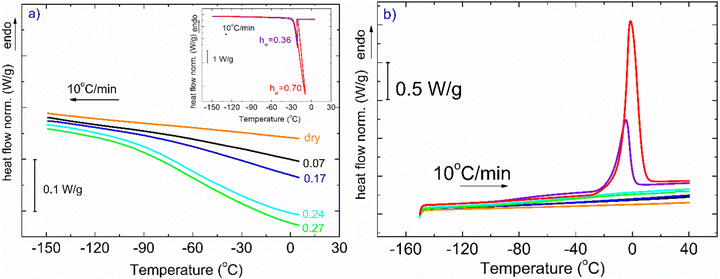
In Fig. 1, DSC curves obtained during cooling (a) and heating (b) are presented. The inset graph in (a) illustrates the crystallization events of the samples with the highest hydration levels (hw = 0.36 and hw = 0.70). It is worth mentioning that all the samples with low levels of hydration (hw = 0.07–0.27) did not exhibit water crystallization. Therefore, there was an amount of water inside the samples that did not crystallize at subzero temperatures (Table 1). The non-freezing water is the water fraction that does not participate in ice formation and is estimated by employing eqn (3):| hnon-fr = hw − hcr-w | (3) |
 with ΔH0 = 333.5 J g−1 being the enthalpy of melting of hexagonal bulk ice.53,54
| h w | T g (°C) | ΔCp (J g−1 °C−1) | T m (°C) | T cr (°C) | ΔHm (J g−1) | ΔHcr (J g−1) | h non-fr-w |
|---|---|---|---|---|---|---|---|
| (±0.5) | (±0.02) | (±0.5) | (±0.5) | (±1) | (±1) | ||
| 0 | 105 | 0.12 | — | — | — | — | — |
| 0.07 | 50 | 0.04 | — | — | — | — | — |
| 0.17 | −23 | 0.76 | — | — | — | — | — |
| 0.24 | −46 | 0.88 | — | — | — | — | — |
| 0.27 | −57 | 0.77 | — | — | — | — | — |
| 0.36 | −81 | 0.48 | −5 | −21 | 54 | 47 | 0.20 |
| 0.70 | −94 | 0.30 | −1 | −20 | 141 | 134 | 0.28 |
With respect to the heating curves in Fig. 1(b), it can be seen that ice melting peaks are detected only for two samples, as expected, while an endothermal step is barely seen in some curves at the selected scale. To distinguish the step for each curve, one needs to focus on the suitable temperature range.
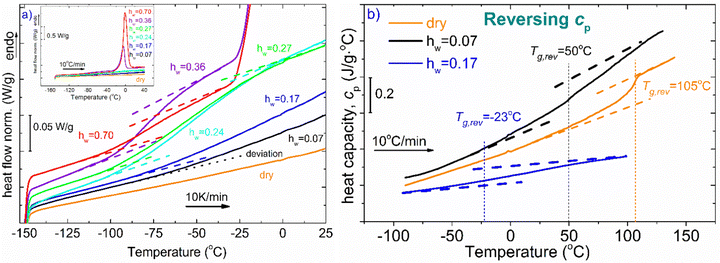
Fig. 2(a) represents DSC heating curves in the glass transition temperature region. Regarding water and its effect on glass transition, it acts as a strong plasticizer, facilitating the mobility of the polymeric chains resulting in a gradual and steady decrease of Tg as water content increases. The dotted lines denote either the onset and final temperature of the endothermic step or the temperature where the signal deviates from the baseline of each heating curve. Both the dry sample and the hydrated samples with the low water contents (hw = 0.07 and 0.17) do not seem to exhibit glass transition in the temperature range of the other samples. Therefore, for the aforementioned samples along with the dry sample, and to ensure whether glass transition exists or not, apart from standard DSC runs, temperature modulation DSC (TMDSC) experiments were also performed. This option provides improved sensitivity especially for detecting weak transitions because it measures not only the total heat flow (as in traditional DSC) but also its reverse heat capacity component separating this contribution from others of kinetic nature. Interestingly, the Tg endothermic step is recorded for the dry sample at 105 °C (Fig. 2b). In the same figure, we present the corresponding signal for the samples with hw = 0.07 and 0.17. It is remarkable that a small amount of water results in a decrease of Tg by ∼55 °C. With respect to the other samples, the existence of the endothermic step that is associated with the glass transition of the polysaccharide is clearer for the samples with hw = 0.24 and 0.27 (Fig. 2a). In Table 1, we summarize the characteristic values from all the events that have been recorded during DSC scans.
The phase diagram of Fig. 3(a) was drawn using the data from Table 1. The graph gives information on the water content dependence of Tg, crystallization and melting temperatures, Tcr, and Tm respectively. It can be observed that Tg follows a downward trend and decreases sharply as the hydration level increases up to the value of hw = 0.36 which corresponds to a RH of 95%. This behavior of the experimental data follows the trend indicated by the Fox equation55 (eqn (4))
 | (4) |
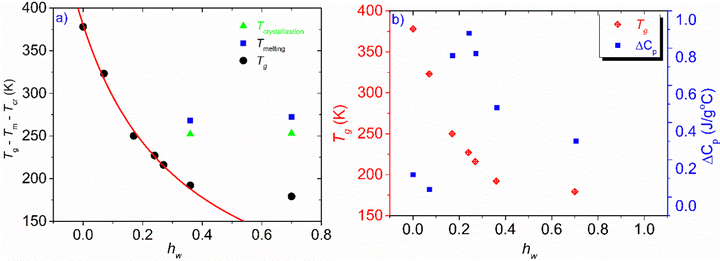 | ||
| Fig. 3 (a) Phase diagram of the hw dependence of Tg, Tcr, and, Tm, (b) hydration water dependence of Tg and heat capacity variation at the glass transition, ΔCp. The red solid line represents the result of the fitting procedure using the Fox equation.55 For a fully hydrated sample (hw = 1), i.e., pure water, the Tg value was estimated to be 110 K, below the generally accepted value which is ∼135 K. | ||
3.2. Broadband dielectric spectroscopy (BDS)
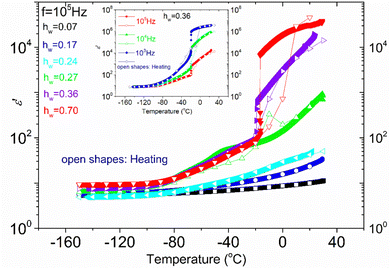
In Fig. 4, the temperature dependence of the real part of dielectric permittivity, (ε′), during cooling and heating for all the samples recorded at f = 105 Hz is presented. It can be observed that the coincidence of the response during cooling and heating is perfect in the whole temperature range only for the samples with the lower hydration levels (hw = 0.07–0.24). As for the samples with higher hydration levels (hw = 0.27–0.70), the signal does not perfectly match during cooling and heating, indicating some rearrangements of water organization with temperature changes. More specifically, for the samples with hw = 0.36 and hw = 0.70, we observe a sudden drop of ε′ during cooling at about −20 °C, which denotes a first-order transition (ice formation). However, below that temperature, the signals merge. On the other hand, the response of the sample with hw = 0.27 deviates at about 3 °C during cooling and the two responses (during cooling and heating) merge again at about −70 °C, below the calorimetric glass transition temperature detected during calorimetric measurements (−57 °C). In the low-temperature range, the signal is almost identical for all the samples during cooling and heating as expected because polysaccharide chains are immobilized. In the inset of Fig. 4, data for the sample with hw = 0.36 are presented for two additional frequencies (f = 104 and 103 Hz), showing the existence of the sudden drop of ε′ at each curve, i.e., a drop that is independent of the monitoring frequency. This fact confirms that a first-order transition (ice formation) occurs during cooling, not only for this sample but also for the sample with the highest hydration level (hw = 0.70).Fig. 5(a) illustrates ε′ and Fig. 5(b)ε′′, isothermal data, for the dry XG sample. The data from this sample were chosen to be presented separately so that the information is not eliminated due to scaling. In Fig. 5(a) we can see that the dielectric response is in general low but there is an upward trend with increasing temperature. In Fig. 5(b), it can be seen that at low frequencies and for temperatures above 50 °C, a wide and symmetric peak can be detected within the experimental window range; however, values are rather low confirming that the dielectric response of this sample is quite low. Nevertheless, since this sample does not contain water, we can assume that this peak (centered at about 20 Hz at −30 °C) corresponds to a relaxation of side polar groups of the polysaccharide that shifts to higher frequencies with increasing temperature (process Idry).
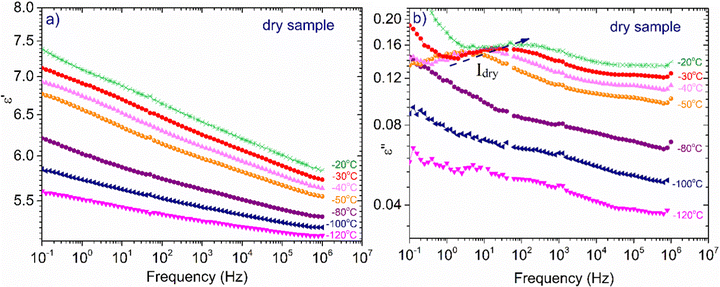 | ||
| Fig. 5 Frequency dependence of (a) ε′, and (b) ε′′ for the dry XG sample at selected temperatures indicated in the plots. | ||
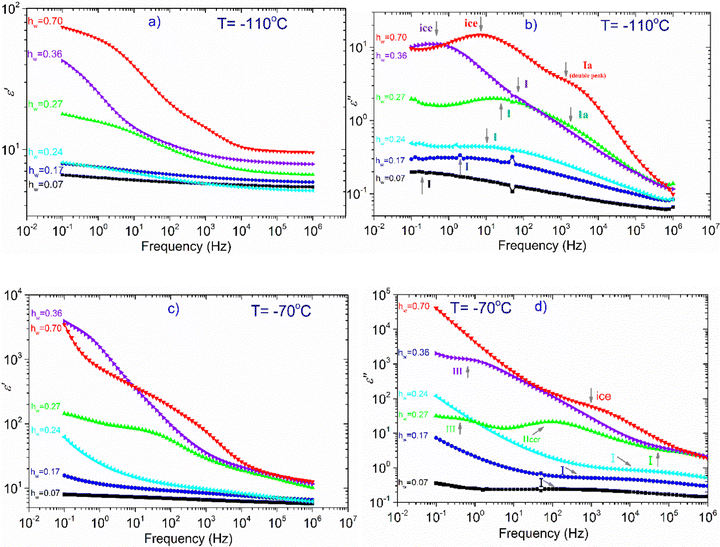
In the next part of this section, we deal with all the other samples except the dry one. At T = −110 °C (Fig. 6a), we can see that there is only a slight increase of ε′ for the samples with hw = 0.07–0.24, whereas ε′ increases more rapidly for the rest of the samples (hw = 0.27–0.70) as the water content increases. Looking at the dielectric loss shown in Fig. 6(b), it is observed that at −110 °C, at least one relaxation process has already entered the experimental window for all the samples, while for those with the highest hydration levels, at least two relaxation processes have been detected. For the three samples with the lowest water content (hw = 0.07, 0.17, 0.24), a wide and symmetric peak is detected at the lower part of the frequency range centered at about 0.1, 1, and 10 Hz, respectively (process I). Concerning the sample with the next highest water content (hw = 0.27), the spectra become more complex: the process I is still recorded but with higher intensity, while another faster relaxation process (process Ia) could be seen at higher frequencies, centered at about 103 Hz as revealed by the fitting procedure. For both samples with the highest water content, the spectra are rather complex: the peak that is related to the relaxation of ice formed during cooling was detected at about 1 Hz (hw = 0.36) and 15 Hz (hw = 0.70). The fitting procedure in the spectrum of the sample with hw = 0.36 has also revealed another relaxation process, (process I) though its peak is not clear due to the superposition with the ice relaxation peak. In addition, looking at the spectrum of the sample containing the maximum amount of water, a double (as revealed by the fitting) and fast relaxation process can be observed, centered at about 2k Hz (process Ia).
At −70 °C, (Fig. 6c) the dielectric permittivity increases with hw except for the sample with the lowest water content (hw = 0.07) whose signal remains almost unchanged in the whole frequency range. Regarding the sample with the next higher water content (hw = 0.17), there is only a slight increase in the low-frequency regime, meaning that there is a limited number of charged species that can follow the changes of the electric field and therefore contribute to the polarization process. The response of the next sample (hw = 0.24) follows an upward trend, whereas this increase is more significant at frequencies lower than 50 Hz. The dielectric loss spectra (Fig. 6d) of the three aforementioned samples revealed the same process (I) recorded at −110 °C, with the difference that the peak of the relaxation is shifted to higher frequencies, as expected. Of particular interest is the behavior of the sample with hw = 0.27 because a Vogel–Tammann–Fulcher (VTF) relaxation process (namely process IIccr) has been recorded during BDS measurements. As can be seen in Fig. 6(c), ε′ increases already in the high-frequency range, while a step is detected between 101 and 103 Hz. This step in the dielectric permittivity spectrum is accompanied by a peak in the same frequency region in the dielectric loss spectrum (Fig. 6d). As it will be shown later, this peak is probably related to the conduction current relaxation mechanism. As for the two samples with the highest water content (hw = 0.36, 0.70), we can see that ε′ increases sharply at low frequencies implying the activation of strong, interfacial polarization processes. It is worth mentioning that in the low frequency range (0.1–1 Hz), another process has been recorded for the samples with hw = 0.27 and hw = 0.36 (process III).
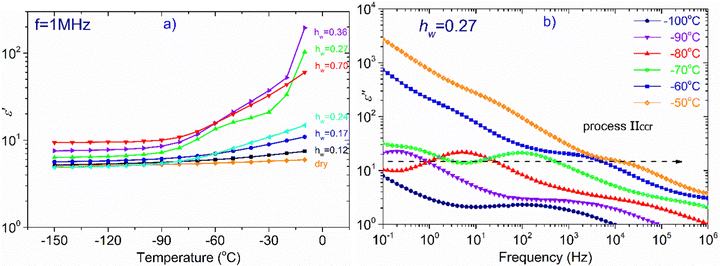
In Fig. 7, we focus on the sample with hw = 0.27. Though this particular sample does not exhibit water crystallization events either in the DSC measurements (Fig. 1a and b), or in the isochronal dielectric measurements during cooling (Fig. S3 in ESI†), interestingly, it behaves similarly to the samples that crystallize upon cooling. More specifically, in Fig. 7(a) is shown the temperature dependence of ε′, recorded at frequency f = 1 MHz, for all hydrated samples and obviously ε′ values of the sample with hw = 0.27 follow an upward trend during heating similar to the two samples with the highest water content, i.e., with the samples that contain the ice phase. It is worth mentioning that this sample exhibits a strong polarization process, called process IIccr, which is shown in Fig. 7b. This process can be monitored already at −90 °C and so clearly only for this water content. In Fig. S4 in ESI,† are shown the real, ε′, and imaginary, ε′′, parts of the dielectric permittivity recorded in the temperature range of −70 °C up to −10 °C, for the samples with hw = 0.24, 0.27 and 0.36, respectively. For the comparison, it is obvious that process IIccr is observed only for water contents around 0.27. This process may be related to specific features of the hydrogen bond network of absorbed water, just before the formation of the crystalline phase (water phase separation) that occurs at higher amounts of adsorbed water. In the following section, we will deal with this polarization process.
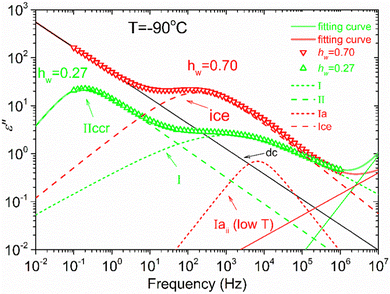
Fig. 8 illustrates an example of the fitting procedure for two samples with hw = 0.27 and hw = 0.70 at −90 °C. For hw = 0.27, a broad peak (process I) is detected centered at about 103 Hz, while a second peak (process IIccr) can be observed at about 10−1 Hz. Concerning the other sample with hw = 0.70, a relaxation peak centered at about 200 Hz, related to the ice relaxation, is observed together with a second weak process (relaxation Iaii) centered at about 104 Hz. This process can be resolved at very low temperatures (low-T double peak).
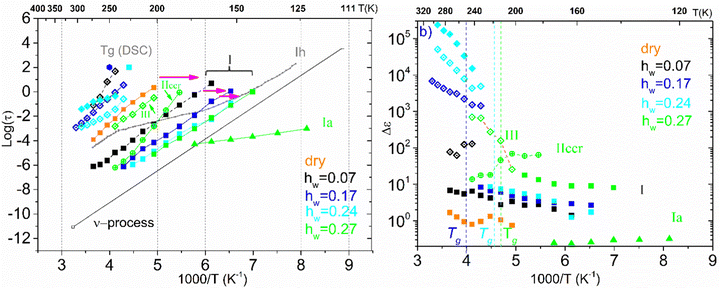
We now turn our attention to the time scale of all the relaxation processes recorded and the corresponding dielectric strength Δε. Fig. 9 outlines the results of the analysis of BDS spectra obtained on the samples with low hydration levels (dry up to hw = 0.27) by showing the Arrhenius plot for the mean relaxation times of all relaxation processes detected (a), as well as the corresponding diagram for their dielectric strength (b). Starting with the Arrhenius plot in Fig. 9(a), it can be seen that process I exhibits Arrhenius-like temperature dependence and is detected in all the samples. The fact that this relaxation is observed not only in the hydrated samples but also in the dry ones, allows us to conclude that this is a secondary relaxation process of polar-hydrophilic groups of the polysaccharide, that is, this process is related either to the local main chain dynamic or/and to the side group motions (β-relaxation). Our data reveal a strong impact of water molecules on the dynamics of process I. Indeed, the process becomes faster with increasing water content, especially for low water contents, while its magnitude increases with increasing water content. Many dielectric studies on hydrated polymers revealed the existence of similar relaxation processes that are based on the local mobility of the matrix and are enhanced by the absorbed water molecules becoming faster and increasing in strength gradually with the increase of water content. The evolution of this low temperature relaxation with the increasing hydration level has revealed an interplay between a local dielectric relaxation mode of polar groups on the macromolecular chains interacting with water molecules and a relaxation process originated in the reorientation of water molecules themselves (the main secondary relaxation process of water or ν-process) above a critical water content.59–63
For the samples with higher water fractions, a saturation of plasticization is observed, i.e., the first hydration shell has been established. For comparison purposes, in Fig. 9(a), we have added the bottom limit for the time scale of the secondary process in bulk water (ν-process).57 If we focus on the sample with hw = 0.27, we can see that there is an additional activated process (process IIccr) that shows (VTF) temperature dependence, which is typical of cooperative relaxation processes. Nevertheless, given that the calorimetric Tg was found in different temperature ranges (as is indicated in Fig. 9a), this process could not be associated with α-relaxation. It is also interesting to comment that the dielectric strength of process IIccr (Fig. 9b) increases with decreasing temperature close to the calorimetric Tg. As for the low-temperature relaxation (process Ia), it follows the Arrhenius law with a very low activation energy (0.11 eV) and its dielectric strength is rather low. We speculate that this process is related with a particular form of water organization but more experimental studies are needed for the clarification of the origin of this peak. It is worth mentioning that similar relaxations have been recorded in other biopolymers.59 To further investigate the origin of process IIccr, the corresponding relaxation times were calculated using the following empirical Barton-Nakajima–Namikawa (BNN) relation (eqn (5)):
 | (5) |
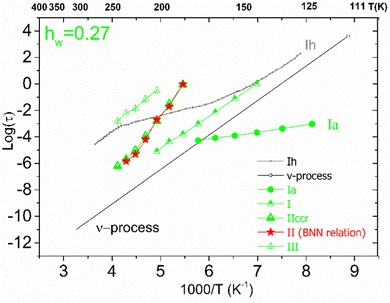 | ||
| Fig. 10 Arrhenius plots for the mean relaxation times for the sample with hw = 0.27. Using the red stars, we present the time scale of the corresponding BNN-type polarization process. | ||
Concerning the two samples that contain ice phases and have the highest hydration levels (hw = 0.36 and 0.70), Fig. 11 illustrates the Arrhenius plot for the mean relaxation times (a), and the dielectric strength of the processes recorded (b). It seems that two almost identical fast relaxation processes are recorded for the sample with hw = 0.70 (marked as Iai and Iaii). These processes have a time scale similar to process Ia that has been recorded for the sample with hw = 0.27 (Fig. 9a). Considering process Iaii, it has the same activation energy as Ia (Table 2). For both samples, process II is related to the relaxation of ice that has been formed during cooling and is monitored during BDS measurements. For comparison, in Fig. 11(a) is also shown the trace of the dielectric relaxation time reported in the literature, illustrating the relaxation process in bulk hexagonal ice, Ih.59,66 As for the sample with hw = 036, except for the aforementioned process II, we can also see another faster relaxation (namely process I), which might be the same secondary relaxation process of polar-hydrophilic groups that has been recorded for all the samples with lower hydration levels (dry up to hw = 0.27). Interestingly, an additional process has been recorded (process III) with a trace that coincides with that of the same process of the sample with hw = 0.27.
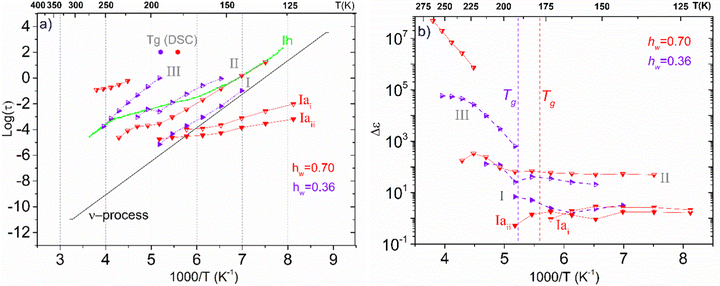 | ||
| Fig. 11 (a) Arrhenius plots of mean relaxation times of processes recorded on the samples with the highest hydration levels (hw = 0.36 and 0.70), (b) the corresponding dielectric strength Δε. | ||
| h w | ||||||
|---|---|---|---|---|---|---|
| Process | ||||||
| Idry | I | Ia | Ia (i) | Ia (ii) | ice | |
| dry | 0.74 | |||||
| 0.07 | 0.66 | |||||
| 0.17 | 0.54 | |||||
| 0.24 | 0.52 | |||||
| 0.27 | 0.50 | 0.11 | ||||
| 0.36 | 0.44 | 0.34 | ||||
| 0.70 | 0.19 | 0.11 | 0.42 | |||
In Fig. 11(b), we present the corresponding dielectric strength for each process that has been recorded. We can see that the values of Δε for process I of the sample with hw = 0.36 are almost coincident with the values of the same process that has been recorded in the samples with low hydration levels (Fig. 9b). Processes Iai and Iaii are characterized by almost constant Δε values in the low-temperature range. However, a gradual decrease is observed at −110 °C and −90 °C, respectively, for the dielectric strength of process II (ice relaxation), it is more or less stable with Δε values ∼60–80, which are typical values for ice relaxation. In the high-temperature range, a fluctuation of the values is observed. Δε values of process III become higher with increasing temperature like the corresponding values of this process for the sample with hw = 0.27, but with higher values.
In Table 2, the activation energies of all processes recorded are presented. We should highlight that the values for processes Idry and I are quite high for a local relaxation of side chain hydroxyl groups. Nevertheless, similar values have been previously reported in the literature. More specifically, Montes et al. who studied secondary relaxations in amorphous cellulose reported Eact = 85 kJ mol−1 (0.88 eV), which decreases with increasing water content e.g., Eact = 60 kJ mol−1 (0.62 eV) for the sample with water content 6 w/w%.67 According to Heijboer, these activation energies are too high to ascertain that only lateral groups are responsible for these relaxations and it is clear that these processes could not correspond to the glass transition. Therefore, they may also be associated with localized motions of the main chain.68,69 Furthermore, Panagopoulou et al. reported Eact = 0.67 eV for the secondary relaxation on the dry BSA sample, a value which also decreases with increasing water content.59 At this point, it is useful to mention that given that there is a strong correlation in the dynamics of the polysaccharides and of biopolymers in general, the different modes of molecular motions are not independent of each other and it is therefore difficult to assign the relaxation process found experimentally to the corresponding orientational processes on the molecular level.
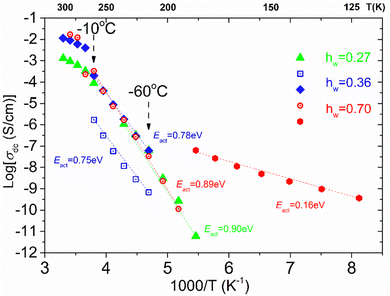
From the frequency dependence of the real part of conductivity in σ′(f) plots, like those shown in ESI,† Fig. S1(a), we are able to estimate the dc conductivity values which allow us to create the dc conductivity Arrhenius plot presented in Fig. 12 by plotting σ′ values at the frequency in which a dc plateau is observed at a given temperature, as a function of 1000/T, for each isothermal curve. There are some interesting features worth mentioning. To start with, a low temperature and mid-frequency conduction process that is of Arrhenius type is recorded in the sample with the highest water content (hw = 0.70) with low activation energy (Eact = 0.16 eV). This process can be attributed to the crystalline ice phase, i.e., conducive paths are created via the bulk-like ice structures. At higher temperatures, we can see that another dc conduction process is established in the low frequency range. This dc conduction process is recorded similarly in all the samples with water content hw ≥ 0.27, at least in the temperature range from −60 to −10 °C. For all the samples, this process is characterized by almost the same activation energy, Ea = 0.78–0.90 eV. This behavior allows us to assume that similar conduction processes for the charge carriers exist in all the samples, at this temperature range, providing the existence of a specific network of the adsorbed water molecules. Given that we have recorded a low-temperature conduction process that can be associated with the presence of the ice phase in the sample with hw = 0.70, we assume that above −80 °C (approximately), similar charge transport processes are possibly activated via the HB network of the existed non-freezing water fraction that is almost constant (0.20–0.28) irrespective of the total water content. Such rather high apparent activation energies have been also observed in other water containing systems53,70,71 and may be attributed to the specific features of the HB network of the interfacial water and the particular mechanism for the proton transfer.72,73
4. Conclusions
This work aimed to study XG gum, in terms of glass transition and molecular mobility over a wide range of hydration (hw varied from 0 to 0.70) by employing DSC and broadband BDS techniques. More specifically, DSC measurements were carried out to investigate thermal events and to estimate Tg. BDS experiments were conducted to study the dielectric behavior of the polysaccharide and the activated conduction processes and the way water affects the aforementioned processes.At the hydration levels of this study, we found that the samples under investigation contain either only non-freezing water, or an additional amount of water that can crystallize during cooling. This means that depending on the water content, there is an amount of bound water, clustered water and bulk-like water that can form a separate phase at subzero temperatures. The critical water fraction for ice formation was found as hw = 0.35. Tg which is associated with α-relaxation was recorded for all the samples studied during standard DSC experiments. To provide improved sensitivity, and to detect any weak glass transition, apart from the standard DSC scans, we have also performed TMDSC measurements, in particular for the dry one and the two samples with the lowest water contents (hw = 0.07 and 0.17). These experiments revealed that though the glass transition was not recorded during standard DSC scans, these samples are also subjected to glass transition. As shown in Table 1, there is a strong water content dependence of Tg, e.g., the dry sample undergoes glass transition at 105 °C, while a very small amount of water (hw = 0.07) results in a remarkable decrease of Tg by 55 °C. This decrease is expected, as water molecules act as strong plasticizers, and Tg decreases with the increasing water content of the samples.
With respect to the BDS experiments, a secondary relaxation process (namely process Idry, process I) has been detected in all the samples, including the dry one, except the sample with the maximum water content. This finding allows us to assume that this relaxation process is related to the relaxation of polar-hydrophilic groups of the polysaccharide that is being plasticized by water molecules. Consequently, we believe that processes I and Idry can be attributed either to the side groups (D-mannose groups, D-glucuronic acid) or/and to the local motions of the main chain (hydroxymethyl groups –CH2OH). This interpretation is also driven by the strong plasticization of this particular process by water, which has been observed in biomolecules where the plasticization of the matrix is accompanied by the acceleration of the local molecular mobility. Concerning the sample with hw = 0.27, a VTF-like relaxation process has been recorded (process IIccr). This process is controlled by the long-range dc conductivity, which is influenced by the conductivity current relaxation mechanism, as shown in Fig. 10 and by using the BNN relationship. A fast but weak process (namely process Ia) has been also recorded for this sample that follows an Arrhenius behavior with low activation energy (0.11 eV) and its origin remains unclear. Another process (III) has been also recorded for this sample that follows an Arrhenius law. As for the two samples with the highest water content (hw = 0.36 and 0.70), the fitting procedure revealed the peak that is related to ice relaxation. Furthermore, process I, i.e., the same process that has been recorded in the samples with lower hw, was also identified for the sample with hw = 0.36, while two additional but low energy processes (Iai and Iaii) have been recorded for the sample with hw = 0.70. Process III was recorded for the sample with hw = 0.36 at high temperatures.
Concerning the dc conductivity of the samples, our measurements reveal that two types of long-range charge transport processes are activated. The first one has its origin in the conductive paths that can be formed through the bulk-like ice structures in the low-temperature range (T < −110 °C) and are detected only for the sample with the highest water content. Taking into account that the second process was recorded at higher temperatures (T > −85 °C) in all the samples with hw ≥ 0.27, we conclude that this common charge transport process is realized via the HB network of the non-freezing clustered water molecules and its characteristics are independent of the hydration level.
As far as we are aware, it is the first time that XG is studied in terms of glass transition and molecular mobility in a wide range of temperatures, frequencies, and water fractions using DSC and BDS techniques. To conclude, the results of our measurements reveal that the molecular mobility of XG molecules is strongly affected by the presence of water molecules.
Conflicts of interest
The authors have no conflicts of interest to disclose.Acknowledgements
S. N. T. would like to acknowledge Dr Daniel Fragiadakis from the Naval Research Laboratory, Polymer Physics Section, Washington DC, USA for kindly providing his ‘grafity’ data analysis software (https://grafitylabs.com/).References
- E. Westhof, Water and Biological Macromolecules, Red Globe Press, London, 1993 Search PubMed.
- D. Saha and S. Bhattacharya, J. Food Sci. Technol., 2010, 47, 587–597 CrossRef CAS PubMed.
- S. E. Hill, D. A. Ledward and J. R. Mitchell, Functional properties of food macromolecules, Aspen Publishers, Gaithersburg, 1998 Search PubMed.
- A. Jeanes, Food technology, 1974, 28, 34–40 CAS.
- D. F. S. Petri, J. Appl. Polym. Sci., 2015, 132, 42035 CrossRef.
- X. Hu, K. Wang, M. Yu, P. He, H. Qiao, H. Zhang and Z. Wang, Biomolecules, 2019, 9, 730 CrossRef CAS PubMed.
- A. M. Grumezescu and A. M. Holban, Handbook of Food Bioengineering, Biopolymers for Food Design, Academic Press, London, San Diego, 2018 Search PubMed.
- I. A. Challen, in Food Hydrocolloids, ed. K. Nishinari and E. Doi, Springer, Boston, MA, 1994, Xanthan Gum: A Multifunctional Stabiliser for Food Products, pp. 135–140 Search PubMed.
- M. Milas and M. Rinaudo, Carbohydr. Res., 1979, 76, 189–196 CrossRef CAS PubMed.
- D. H. Hanna and G. R. Saad, Bioorg. Chem., 2019, 84, 115–124 CrossRef CAS PubMed.
- A. Jain, S. K. Singh, S. K. Arya, S. C. Kundu and S. Kapoor, ACS Biomater. Sci. Eng., 2018, 4, 3939–3961 CrossRef CAS PubMed.
- J. Patel, B. Maji, N. S. Hari Narayana Moorthy and S. Maiti, RSC Adv., 2020, 10, 27103 RSC.
- W. Lohcharoenkal, L. Wang, Y. C. Chen and Y. Rojanasakul, BioMed Res. Int., 2014, 180549 Search PubMed.
- J. H. Roh, Macromol. Chem. Phys., 2016, 217, 256–265 CrossRef CAS.
- D. Laage, T. Elsaesser and J. T. Hynes, Chem. Rev., 2017, 117, 10694 CrossRef CAS PubMed.
- S. Cerveny and J. Swenson, J. Chem. Phys., 2019, 150, 234904 CrossRef PubMed.
- G. Kerch, Int. J. Biol. Macromol., 2018, 118, 1310–1318 CrossRef CAS PubMed.
- A. Panagopoulou, A. Kyritsis, R. Sabater Serra, J. L. Gómez Ribelles, N. Shinyashiki and P. Pissis, Biochim. Biophys. Acta, Proteins Proteomics, 2011, 1814, 1984–1996 CrossRef CAS PubMed.
- H. Jansson and J. Swenson, Biochim. Biophys. Acta, 2010, 1804, 20–26 CrossRef CAS PubMed.
- B. Wunderlich, J. Therm. Anal. Calorim., 2011, 106, 81–84 CrossRef CAS.
- T. Hatakeyama, M. Tanaka, A. Kishi and H. Hatakeyama, Thermochim. Acta, 2012, 532, 159–163 CrossRef CAS.
- P. Pissis and A. Kyritsis, J. Polym. Sci., Part B: Polym. Phys., 2013, 51, 159–175 CrossRef CAS.
- S. Kripotou, E. Stefanopoulou, M. C. Martínez, R. M. M. Román, G. Ferrer and A. Kyritsis, Polymer, 2019, 178, 121598 CrossRef CAS.
- S. Cerveny, F. Mallamace, J. Swenson, M. Vogel and L. Xu, Chem. Rev., 2016, 116, 7608–7625 CrossRef CAS PubMed.
- M. Grossutti and J. R. Dutcher, Biomacromolecules, 2020, 21, 4871–4877 CrossRef CAS PubMed.
- V. Kocherbitov, Carbohydr. Polym., 2016, 150, 353–358 CrossRef CAS PubMed.
- M. Fujii, K. Sasaki, Y. Matsui, S. Inoue, R. Kita, N. Shinyashiki and S. Yagihara, J. Phys. Chem. B, 2020, 124, 1521–1530 CrossRef CAS PubMed.
- J. Swenson, Phys. Chem. Chem. Phys., 2018, 20, 30095–30103 RSC.
- Y. Beilinson, V. Schiller, J. Regentin, J. H. Melillo, A. Greenbaum, T. Antropova, S. Cerveny, M. Vogel and Y. Feldman, J. Phys. Chem. B, 2023, 127, 5128–5140 CrossRef CAS PubMed.
- Q. Wang, X. Huang, W. Guo and Z. Cao, Phys. Chem. Chem. Phys., 2019, 21, 10293–10299 RSC.
- B. Vijayakumar, M. Takatsuka, K. Sasaki, R. Kita, N. Shinyashiki, S. Yagiharad and S. Rathnasabapathy, Phys. Chem. Chem. Phys., 2023, 25, 22223 RSC.
- P. Talik and U. Hubicka, J. Therm. Anal. Calorim., 2018, 132, 445–451 CrossRef CAS.
- W. G. Liu and K. D. Yao, Polymer, 2001, 42, 3943–3947 CrossRef CAS.
- N. Shinyashiki, M. Shimomura, T. Ushiyama, T. Miyagawa and S. Yagihara, J. Phys. Chem. B, 2007, 111, 10079–10087 CrossRef CAS PubMed.
- K. Sasaki, A. Panagopoulou, R. Kita, N. Shinyashiki, S. Yagihara, A. Kyritsis and P. Pissis, J. Phys. Chem. B, 2017, 121, 265–272 CrossRef CAS PubMed.
- K. Sasaki, I. Popov and Y. Feldman, J. Chem. Phys., 2019, 150(20), 204504 CrossRef PubMed.
- J. H. Melillo, E. Nikulina, M. A. Iriarte-Alonso, S. Cerveny and A. M. Bittner, Sci. Rep., 2022, 12, 16512 CrossRef CAS PubMed.
- A. Průšová, F. J. Vergeldt and J. Kučerík, Carbohydr. Polym., 2013, 95, 515–521 CrossRef PubMed.
- H. Hatakeyama and T. Hatakeyama, Thermochim. Acta, 1998, 308, 3–22 CrossRef CAS.
- C. E. Brunchi, M. Bercea, S. Morariu and M. Dascalu, J. Polym. Res., 2016, 23, 123 CrossRef.
- A. Gamini, J. de Bleijser and J. C. Leyte, Carbohydr. Res., 1991, 220, 33–47 CrossRef CAS PubMed.
- T. Sato, T. Norisuye and H. Fujita, Macromolecules, 1984, 17, 2696–2700 CrossRef CAS.
- T. A. Camesano and K. J. Wilkinson, Biomacromolecules, 2001, 2, 1184–1191 CrossRef CAS PubMed.
- A. Papagiannopoulos, K. Sotiropoulos and A. Radulescu, Carbohydr. Polym., 2016, 153, 196–202 CrossRef CAS PubMed.
- H. Yoshida, T. Hatakeyama and H. Hatakeyama, Polymer, 1990, 31, 693–698 CrossRef CAS.
- S. Basu, U. S. Shivhare and A. S. Mujumdar, Drying Technol., 2007, 25, 1581–1586 CrossRef CAS.
- I. E. Raschip, I. Yakimets, C. P. Martin, S. S. Paes, C. Vasile and J. R. Mitchell, Powder Technol., 2008, 182, 436–443 CrossRef CAS.
- V. Kocherbitov, S. Ulvenlund, L. E. Briggnerb, M. Koberb and T. Arnebranta, Carbohydr. Polym., 2010, 82, 284–290 CrossRef CAS.
- F. Kong and R. P. Singh, in Food and Beverage Stability and Shelf Life, ed. D. Kilcast and P. Subramaniam, Woodhead Publishing, 2011, 12, pp. 381–404 Search PubMed.
- F. Kremer and A. Schönhals, Broadband Dielectric Spectroscopy, Springer, Berlin, 2002 Search PubMed.
- S. Tatsuoka and H. Sato, Spectrochim. Acta, Part A, 2018, 197, 95–102 CrossRef CAS PubMed.
- S. Havriliak and S. Negami, Polymer, 1967, 8, 161–210 CrossRef CAS.
- S. Kripotou, K. Zafeiris, M. Culebras-Martínez, G. Gallego Ferrer and A. Kyritsis, Eur. Phys. J. E., 2019, 42, 109 CrossRef PubMed.
- J. A. Dean, Lange's Handbook of Chemistry, McGraw-Hill, New York, 1999 Search PubMed.
- J. C. Lee and M. H. Litt, Polym. J., 2000, 32, 228–233 CrossRef CAS.
- S. Capaccioli and K. L. Ngai, J. Chem. Phys., 2011, 135, 104504 CrossRef CAS PubMed.
- G. P. Johari, A. Hallbruckert and E. Mayert, Nature, 1987, 330, 552–553 CrossRef CAS.
- P. Lucas, J. Pries, S. Wei and M. Wuttig, J. Non-Cryst. Solids: X, 2022, 14, 100084 CAS.
- A. Panagopoulou, A. Kyritsis, N. Shinyashiki and P. Pissis, J. Phys. Chem. B, 2012, 116, 4593–4602 CrossRef CAS PubMed.
- S. Kripotou, S. N. Tegopoulos, A. Kyritsis, L. O. Cervelló, A. Vallés-Lluch and G. G. Ferrer, IEEE Trans. Dielectr. Electr. Insul., 2020, 27, 1387–1394 CAS.
- C. Gainaru, A. Fillmer and R. Böhmer, J. Phys. Chem. B, 2009, 113, 12628–12631 CrossRef CAS PubMed.
- A. Panagopoulou, J. V. Molina, A. Kyritsis, M. M. Pradas, A. Vallés Lluch, G. G. Ferrer and P. Pissis, Food Biophys., 2013, 8, 192–202 CrossRef.
- S. Capaccioli, K. L. Ngai, S. Ancherbak, P. A. Rolla and N. Shinyashiki, J. Non-Cryst. Solids, 2011, 357, 641–654 CrossRef CAS.
- J. C. Dyre, P. Maass, B. Roling and D. L. Sidebottom, Rep. Prog. Phys., 2009, 72, 046501 CrossRef.
- C. Gainaru, E. W. Stacy, V. Bocharova, M. Gobet, A. P. Holt, T. Saito, S. Greenbaum and A. P. Sokolov, J. Phys. Chem. B, 2016, 120, 11074–11083 CrossRef CAS PubMed.
- G. P. Johari and E. Whalley, J. Chem. Phys., 1981, 75, 1333–1340 CrossRef CAS.
- H. Montes, K. Mazeau and J. Y. Cavaille, Macromolecules, 1997, 30, 6977–6984 CrossRef CAS.
- J. Heijboer, Proceedings of the International Conference on the Physics of Non-crystalline Solids, 1965, p. 231 Search PubMed.
- J. Heijboer, J. M. A. Baas, B. Van der Graaf and M. A. Hoefnagel, Polymer, 1987, 28, 509 CrossRef CAS.
- K. D. Kreuer, Solid State Ionics, 2000, 136–137, 149–160 CrossRef CAS.
- A. B. Mostert, J. Mater. Chem. B, 2022, 10, 7108 RSC.
- I. Popov, Z. Zhu, A. R. Young-Gonzales, R. L. Sacci, E. Mamontov, C. Gainaru, S. J. Paddison and A. P. Sokolov, Commun. Chem., 2023, 6, 77 CrossRef CAS PubMed.
- K. D. Kreuer, Chem. Mater., 1996, 8, 610–641 CrossRef CAS.
Footnote |
| † Electronic supplementary information (ESI) available. See DOI: https://doi.org/10.1039/d3cp04643e |
| This journal is © the Owner Societies 2024 |

