 Open Access Article
Creative Commons Attribution 3.0 Unported Licence
Modelling bulk and surface characteristics of cubic CeO2, Gd2O3, and gadolinium-doped ceria using a partial charge framework†
Josef M.
Gallmetzer
 ,
Jakob
Gamper
 ,
Felix R. S.
Purtscher
 and
Thomas S.
Hofer
 *
*
Theoretical Chemistry Division Institute of General, Inorganic and Theoretical Chemistry Center for Chemistry and Biomedicine University of Innsbruck, Innrain 80–82, A-6020 Innsbruck, Austria. E-mail: T.Hofer@uibk.ac.at; Fax: +43-512-507-57199; Tel: +43-512-507-57111
First published on 12th April 2024
Abstract
The development and characterization of materials for solid oxide fuel cells (SOFC) is an important step towards sustainable energy technologies. This present study models cubic CeO2, Gd2O3, and gadolinium-doped ceria (GDC) using newly constructed interaction potentials based on a partial atom charge framework. The interaction model was validated by comparing the structural properties with experimental reference data, which were found to be in good agreement. Validation of the potential model was conducted considering the surface stability of CeO2 and Gd2O3. Additionally, the accuracy of the novel potential model was assessed by comparing the oxygen diffusion coefficient in GDCn (n = 4–15) and the associated activation energy. The results demonstrate that the novel potential model is capable of describing the oxygen diffusion in GDC. In addition, this study compares the vibrational properties of the bulk with density functional theory (DFT) calculations, using a harmonic frequency analysis that avoids the need for computationally expensive quantum mechanical molecular dynamics (QM MD) simulations. The potential is compatible with a reactive water model, thus providing a framework for the simulation of solid–liquid interfaces.
1 Introduction
Although significant advances in science and technology have been achieved during the last century, meeting the growing global demand for energy represents a continuously increasing challenge of the new millennium.1 The quest for alternative energy sources has emerged as an increasingly active research area, which is directly linked to concerns over accelerated climate change.2 One promising method for creating sustainable and environmentally friendly energy systems in the heavy transportation industry, particularly in heavy-duty transport3 and aviation,4 utilizes fuel cell (FC) technology. FCs directly convert chemical energy into usable electricity.5 Various implementations, such as proton-exchange membrane FCs,6 phosphoric and solid acid FCs,7 or alkaline FCs,8 have been developed. Solid oxide fuel cells (SOFCs) are a type of implementation that uses solid materials, typically ceramics, as the ion-conducting electrolyte.9–12 One of the most prominent compounds acting as a solid-state oxygen conductor in modern SOFC technologies is yttria-stabilized zirconia (YSZ).11,13 Doping of ZrO2 with other oxide materials such as Y2O3 is known to stabilize the cubic phase of zirconia. Due to the valence mismatch between Zr(IV) and Y(III), a vacancy in the anionic sub-lattice is created upon twofold substitution of Zr-atoms by Y. This is known to enable oxygen diffusion throughout the solid material.14–16This property of YSZ, to function as a solid electrolyte, makes it an advanced material for SOFCs11,13 and other applications, including oxygen sensors17,18 and advanced catalysis procedures.19,20 To achieve a sufficiently high diffusivity of the oxygen ions, comparably high operation temperatures in the range of 600 to 800 °C are required.21,22 Therefore, finding alternative electrolyte materials with sufficient ion mobility below 700 °C is essential and a highly active field in contemporary research. One highly prominent alternative is gadolinia-doped ceria (GDC).5,15,23 Similarly to YSZ, doping of CeO2 with Gd2O3 introduces vacancies in the cubic crystal structure again promoting oxygen conduction. However, because of the increased ionic radii of Ce(IV) and Gd(III), the activation energy associated with the migration of oxygen atoms through the lattice is reduced compared to that of YSZ, thus resulting in enhanced diffusive properties at lower operating temperatures.
A promising route to study ion mobility in solid-state systems is the use of theoretical approaches such as molecular dynamics (MD) simulations.24 However, when considering the required system sizes and simulation periods to explicitly monitor ion diffusion in the long-time limit, the application of quantum chemical approaches, such as density functional theory (DFT), is typically not feasible, see Table S1 (ESI†). Therefore, a molecular mechanical (MM) method based on pre-parameterized potential functions describing interactions between all involved species provides the only viable alternative approach.24 Although, MM-based MD simulations can easily reach the required simulation time to analyze the respective diffusion coefficient D via the associated mean-squared-displacement (MSD), an adequate parametrization of the model is a prerequisite to achieve accurate results. In a recent study, a parametrization strategy to obtain effective potential parameters for the description of ZrO2, Y2O3, and YSZ has been outlined.24 Although, several interaction potentials for these systems have already been described in the literature,25–27 these potential models proved to be unsuitable for describing associated interface systems, i.e. simulation systems subject to 2D periodic boundary conditions.24 The use of integer atomic charges derived from the formal oxidation number of ions in the material, i.e. qZr = +4e, qY = +3e, qO = −2e have been shown to cause nonphysical reorganization of both the surface as well as the bulk region, in the case of pure cubic ZrO2.24
Similar to the case of YSZ and its constituents, there are only very few theoretical studies on GDC available in the literature. Gunn and co-workers25 investigated the surface of gadolinia-doped ceria using a Monte Carlo simulation approach. As with most potential models developed for YSZ, the formal oxidation numbers of the respective ions were considered as integer charges, i.e. qCe = +4e, qGd = +3e and qO = −2e.
This work applies the previously described strategy used to obtain appropriate interaction potentials for ZrO2, Y2O3, and YSZ to generate novel force field parameters for cubic CeO2, Gd2O3, and GDC. This procedure facilitates effective partial charges rather than relying on integer atomic charges derived from formal oxidation numbers. In addition, the parametrization strategy was based on parameters obtained from a dissociative water model,28,29 which should enable integration of the novel potential model. A recent study30 showed that extending a dissociative water model by including solid-state parameters allows MM MD to describe surface phenomena of heterogeneous systems, such as SiO2/H2O. This framework provides a basis for simulating solid–liquid interfaces and describing surface protonation, which is a key step in the formation of a Helmholtz double layer and a fundamental step related to surface degradation.
To avoid the cost of using more expensive QM MD simulations (Table S1, ESI†) to analyze the vibrational properties of the target systems employed in the previous study of YSZ, a comparison of the harmonic vibrational modes with DFT-based frequency calculations has been carried out. The vibrational behavior of CeO2 and Gd2O3 with the novel parameter set has been compared to DFT calculations.
Potential applications of this novel model in simulations of interfacial structures and 2D periodic QM/MM-type simulations are discussed in the conclusion.
2 Methods
2.1 Potential model
The parameters derived for CeO2, Gd2O3, and GDC are based on a dissociative water model28–31 previously developed for describing bulk water, oxonium (H3O+) and hydroxide (OH−) ions along with their associated proton transfer reactions in solution. The main objective of the parametrization is to ensure compatibility between the novel derived solid-state potentials and the reactive water model.28,29 The latter explicitly accounts for proton transfer reactions. Therefore, it is not possible to apply various atom types per element. All interactions, including those at liquid–solid interfaces, must be treated using the same potential model, regardless of the chemical species involved. Therefore, all O–O interactions should be treated using the same potential model, regardless of whether the oxygen atoms are part of the liquid or solid state. An MD simulation study of SiO2/H2O30 demonstrates that the protonation of a solid oxygen atom through two successive proton transfer events could result in a water molecule that may dissociate into the liquid part of the simulation system. To ensure that the water molecule has the same properties as those of the bulk liquid, it is necessary to consider only a single type of oxygen.The associated interaction potential consists of a Coulomb and a Buckingham term to describe the electrostatic and non-coulombic contributions between the atom pair ij
 | (1) |
 | (2) |
A key prerequisite when applying dissociative molecular mechanical potentials is the employment of only a single atom type per element.28,29,32 This is critical for the parametrization since oxygen atoms on the surface of a solid-state system can be transformed into H2O through two consecutive protonation steps, thereby becoming part of the liquid state (or vice versa). As a result, the associated partial oxygen charge of qO = −0.898e, applied to all oxygen atoms in the parametrization, is predetermined by the water potential.28,29 The atomic charges of the cationic species are then determined to obtain neutral units of CeO2 and Gd2O3. The respective values for qCe and qGd are thus given as +1.796e and +1.347e, respectively. The same consideration also applies to non-coulombic contributions. Therefore, the use of the same Buckingham parameters as in the liquid is required for all O–O pairs irrespective of whether those are present in the solid or the liquid phase of a simulation system. For cation–cation (M–M) interactions, repulsive coulombic contributions are usually sufficient due to the contraction of the electron density, typically observed for cations. As a result, the dispersive interaction (i.e. r−6) is negligible, while the repulsive non-coulombic contributions are only significant for very small M–M distances (usually not observed in MD simulations, due to the small ionic radii). From this perspective, the only parameters required to formulate the interaction model are those associated with cation–anion interactions, i.e. {A, B, C}ij (i = Ce, Gd; j = O). However, a previous study focused on YSZ24 has shown that due to the more complex crystal structure of yttria (space group Ia![[3 with combining macron]](https://www.rsc.org/images/entities/char_0033_0304.gif) ), it proved necessary to apply a non-coulombic Y–Y potential to achieve a structural description consistent with the experimental reference. Considering that Gd2O3 and Y2O3 are isotypic phases, it is reasonable to assume that a suitable non-coulombic M–M potential is necessary as well.
), it proved necessary to apply a non-coulombic Y–Y potential to achieve a structural description consistent with the experimental reference. Considering that Gd2O3 and Y2O3 are isotypic phases, it is reasonable to assume that a suitable non-coulombic M–M potential is necessary as well.
As discussed before, the formulation of the described interaction potential was particularly successful for the treatment of ZrO2 and Y2O3, as well as modelling O diffusion in YSZ systems with various compositions.24 It is expected that a similar successful result can be achieved in this study for the compounds under consideration.
2.2 Construction of the potential
In this work, the ion–oxygen interactions are described based on a coulombic (eqn (1)) plus Buckingham potential formulation (eqn (2)), leading to the following equation | (3) |
Aside from the aforementioned partial charges, the three Buckingham potential parameters must be specified for each type of interactions. As mentioned before, for the Ce–Ce interactions only the Coulomb term is required, as the non-Coulomb term can be expected to not contribute significantly to the total interaction potential.
The parameters – Aij, Bij, and Cij – have been changed to adapt the system to the partial charges. However, when considering a specific cation–anion target distance reqij obtained from experimental reference data, the exponential prefactor Aij can be determined from three parameters {reqij, Bij, Cij} via
 | (4) |
 | (5) |
The values for reqij were selected close to the experimental cation–anion equilibrium distance taken from the corresponding crystal structures, while Bij and Cij were systematically varied over a suitable search grid ranging from −20.0 to −4.0 Å−1 and −5000 to −200.0 Å6 kcal mol−1, respectively. Short-scale MD simulations were performed at 10 K for only 1 ps for each cation–anion interaction, defined by the three parameters {reqij, Bij, Cij}, which is sufficient to estimate the density ρ. The various values for ρ obtained from the different simulations were then projected on the Bij and Cij plane, as depicted in Fig. 2. In addition, the thermal expansion was analyzed and compared to the reference for the selected parameters. Temperatures of 298.15, 698.15, 1098.15, and 1498.15 K were chosen.33,34 Once agreement with the experimental densities had been reached, additional analysis was carried out to further refine the parameters.
2.3 Analysis
Both c-CeO2 and c-Gd2O3 were analyzed in detail based on their densities and their ion–ion radial distribution functions (RDFs),35 determined from the respective sampling period (NPT ensemble). In addition, vibrational power spectra have been determined via the Fourier transform of the velocity autocorrelation function (VACF)35C(t) defined as follows | (6) |
To analyze the oxygen diffusion in the GDC system, the Einstein relation35 was used, which is expressed as
 | (7) |
| D = D0·e−EA/RT, | (8) |
 | (9) |
The calculation of the vibrational modes requires the construction of the Hessian matrix H. Individual single-point calculations were performed with each atom of the minimized structure being displaced in each dimension for a certain Δr, which for this specific work was set to ±0.01 Å. H was then constructed via numerical differentiation of the individual forces fiμ
 | (10) |
| H′ = HTH | (11) |
| u = UTH′U | (12) |
 | (13) |
2.4 MD simulation protocol
The MD simulations were performed using the velocity Verlet algorithm38 with a time step of 2 fs. To simulate the system in the NPT ensemble, pressure and temperature control was performed using the Berendsen weak coupling manostat and thermostat algorithms,39 with relaxation times set to τp = 1.0 ps and τT = 0.1 ps, respectively. The Wolf summation technique40 was used to account for long-range coulombic contributions, employing a cutoff distance of 10 Å and a damping factor κ = 0.22 Å−1.For the potential construction, the systems were equilibrated at 10 K and 1.013 bar for 0.5 ps, followed by a 0.5 ps sampling period. The analysis of the RDF and VACF required 50 ps equilibration and a sampling period of 100 ps. The diffusion coefficient calculations used different GDC systems, which were equilibrated for 50 ps, with a subsequent sampling period of 5 ns.
2.5 System setup
The experimental crystal structures of the cubic unit cells were obtained from the Crystallography Open Database (COD).41–47 CeO2 has a unit cell length of 5.411 Å (space group number 225, COD entry 900900848). In the case of Gd2O3, the unit cell length is 10.79 Å (space group number 199, COD entry 101033849), see Fig. 1. The cubic supercells of CeO2 and Gd2O3 contained 5 × 5 × 5 and 3 × 3 × 3 unit cells with a total of 1500 and 2160 atoms, respectively. To counteract possible simulation artifacts arising from an ideal placement of atoms in the periodic crystal, a random modification of the atomic positions in the initial structure was carried out by up to ±10−2 Å along every principal axis.The GDC systems were created by using the cubic CeO2 supercell, in which Ce was randomly substituted by Gd atoms. To maintain charge neutrality, one randomly selected oxide anion was removed per two cationic substitutions, resulting in vacancies in the lattice to promote oxygen conduction. Table 1 specifies the various GDC systems investigated in this study.
| x Gd2O3/% | N CeO2 | N Gd2O3 | N atoms | |
|---|---|---|---|---|
| GDC04 | 3.95 | 462 | 19 | 1481 |
| GDC5.3 | 5.30 | 450 | 25 | 1475 |
| GDC06 | 5.93 | 444 | 28 | 1472 |
| GDC07 | 7.07 | 434 | 33 | 1467 |
| GDC08 | 7.99 | 426 | 37 | 1463 |
| GDC09 | 8.93 | 418 | 41 | 1459 |
| GDC10 | 9.89 | 410 | 45 | 1455 |
| GDC11 | 11.11 | 400 | 50 | 1450 |
| GDC12 | 11.86 | 394 | 53 | 1447 |
| GDC13 | 13.12 | 384 | 58 | 1442 |
| GDC14 | 13.90 | 378 | 61 | 1439 |
| GDC15 | 14.94 | 370 | 65 | 1435 |
For the harmonic vibrational analysis, supercells with dimensions of 4 × 4 × 4 (768 atoms) and 2 × 2 × 2 (640 atoms) unit cells were used for CeO2 and Gd2O3, respectively.
2.6 Reference DFT Calculations
DFT calculations were conducted using the CRYSTAL23 program50 employing the HSEsol51,52 functional in combination with basis sets featuring ECPs developed by El-Kelany53 and Desmarais54 for Ce and Gd. A double zeta valence basis set reported by Vilela-Oliveira55 was assigned to the oxygen atoms in both solids. The structures of the system have been optimized prior to the frequency calculation.3 Results and discussion
3.1 Potential construction
For CeO2, the reference point for the theoretical equilibrium distance was taken from the respective crystal structure (COD entry 900900848) as reqCe–O = 2.34 Å. The results indicate a slightly lower equilibrium distance at rCe–O = 2.24 Å, consistent with the previously recorded values in the study of ZrO2.24 Sameshima et al.34 reported the density of CeO2 at 298 K and 1.013 bar to be 7.218 g cm−3, corresponding to a lattice parameter of the cubic unit cell a = 5.410 Å. The calculated density at standard conditions obtained in this work is 7.216 g cm−3 (a = 5.410 Å) and agrees perfectly with the experimental value. When using the potential reported by Gunn et al.,25 the calculated equilibrium density at these simulation settings amounts to 7.316 g cm−3 (a = 5.386 Å).The most accurate results for Gd2O3 were achieved through a parameter scan based on a Gd–O radius of reqGd–O = 2.21 Å. However, the RDF analysis revealed that the peaks in the Gd–Gd distribution were not in ideal agreement as previously also observed in the case of Y2O3.24 Consequently, a non-coulombic Gd–Gd potential had to be constructed using the equilibrium radius of reqGd–Gd = 3.85 Å, which is located between the first two ideal crystal pair distributions. After the addition of the Gd–Gd non-coulombic pair potential, the density of Gd2O3 was determined to be 7.677 g cm−3 with a corresponding value for a = 10.79 Å at standard conditions, which is in good agreement with Krishnan et al.,33 who reported the density of cubic Gd2O3 to be 7.664 g cm−3 (a = 10.80 Å). Conversely, the potential reported by Gunn et al. estimated the density to be 8.406 g cm−3 (a = 10.46 Å), which is significantly higher than the experimental value by approx. 10%.
For GDC, the pair potential parameters were obtained by combining the potential parameters for Gd2O3 and CeO2, as listed in Table 2. The parameters for the Ce–Gd interaction were added, comprising solely of a repulsive Coulomb term.
| Aij/kcal mol−1 | Bij/Å−1 | Cij/Å6 kcal mol−1 | |
|---|---|---|---|
| Ce–Ce | — | — | — |
| Ce–Gd | — | — | — |
| Gd–Gd | 7.6481 × 10¹² | 8.2029 | −3491.6 |
| Ce–O | 7.2958 × 10¹⁶ | 16.4572 | −500.0 |
| Gd–O | 7.5282 × 10⁹ | 8.7830 | −4500.0 |
| O–O | 2.7970 × 10⁵ | 4.0199 | −835.0 |
3.2 Radial distribution
The RDFs of CeO2 and Gd2O3 were calculated to characterize the respective structural properties. To evaluate the thermal stability of the newly parametrized interaction model, RDFs were calculated for simulations conducted at 298.15, 698.15, 1098.15, and 1498.15 K. The RDFs of CeO2 and Gd2O3 are shown in Fig. 3 and 5, respectively. Moreover, a comparison of the RDFs at 298 K with the potential reported by Gunn et al.25 is presented in Fig. S1 and S2 (ESI†).Fig. 3 displays the RDFs of all ion pairs of CeO2 over a wide temperature range. The pair distributions are in perfect agreement with the experimental values estimated based on the crystal structure reported by Wyckoff.48 Furthermore, the distribution at larger distances is also accurately represented, showing that the crystal structure is well portrayed in the short-range as well as the long-range order. At higher temperatures, it is apparent that the distributions are slightly shifted towards larger distances, which is a result of the thermal expansion of the crystal. Fig. S2 (ESI†) compares the RDFs from this work to the RDFs of the potential reported by Gunn et al. The reference distribution appears to be broader, indicating higher atom mobility. Nevertheless, the maxima of the distributions appear at the same distance values, suggesting that the reference potential also accurately describes the crystal structure, although with a slight but noticeable shift towards shorter interatomic distances.
For Gd2O3, a non-coulombic potential was added to account for the initial mismatch in the RDF of the Gd–Gd pair distribution, as shown in Fig. 4. The introduction of the non-coulombic cation–cation potential greatly improved the distribution, as can be seen in the RDFs shown in Fig. 5. The pair distributions are in perfect agreement with the distribution determined from the experimental crystal structure. The off-axis displacement of the oxygen atoms (Fig. 1(b)) results in a higher degree of disorder in Gd2O3. For this reason, the pair distributions including oxygen atoms show a higher number of peaks, as seen in Fig. 5(a) and (b). This disorder cannot be observed in the RDFs because a thermally averaged ensemble is analyzed. Nevertheless, it can be concluded that the crystal structure is accurately represented. When compared to the potential of Gunn et al. shown in Fig. S2 (ESI†), which overall displays a significant shift to lower distances, the newly parametrized potential provides an improved description of cubic Gd2O3. The large deviation was already apparent when comparing the obtained densities to the experimental value as discussed before.
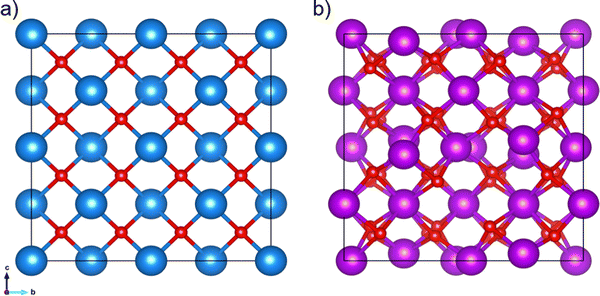 | ||
| Fig. 1 (a) 2 × 2 × 2 supercell of cubic CeO2 (COD entry 900900848) with a unit cell length of 2a = 10.822 Å and (b) unit cell of Gd2O3 (COD entry 101033849) with a unit cell length of 10.79 Å. Red spheres represent the oxygen atoms, while the blue and purple spheres represent Ce and Gd atoms, respectively. | ||
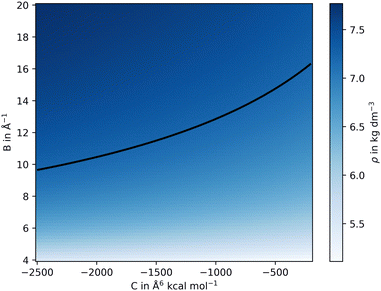 | ||
| Fig. 2 2D representation of the resulting density obtained from a scan performed over parameters B and C of the Buckingham potential at the example of CeO2. The iso-density line (shown in black) is set to the experimental reference value of 7.218 g cm−3.34 Three selected points of the iso-density were taken to further refine the non-coulombic potential, here C = −200, −1125 and −2500 Å6 kcal mol−1. | ||
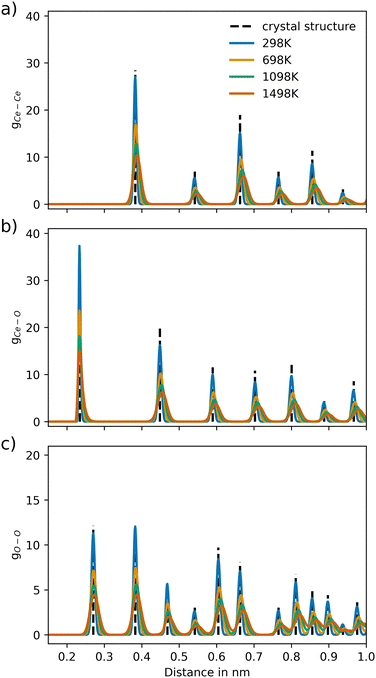 | ||
| Fig. 3 Ion–ion pair distribution for CeO2 over different temperature settings for the pairs (a) Ce–Ce, (b) Ce–O and (c) O–O, respectively. The dashed vertical lines represent the pair distances of the associated crystal structure (COD entry 900900848). | ||
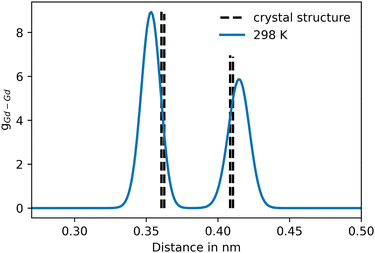 | ||
| Fig. 4 Pair distribution of the initial Gd–Gd distribution, prior to the addition of the non-coulombic cation–cation potential contribution. The dashed vertical lines represent the pair distances of Gd–Gd in the associated crystal structure (COD entry 101033849). | ||
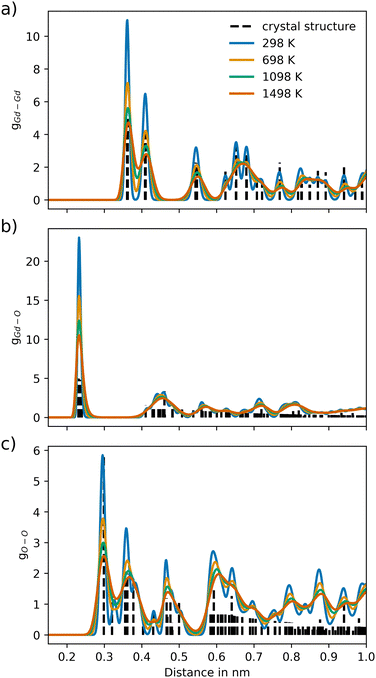 | ||
| Fig. 5 Ion–ion pair distribution for Gd2O3 over different temperature settings for the pairs (a) Gd–Gd, (b) Gd–O and (c) O–O, respectively. The dashed vertical lines represent the pair distances of the associated crystal structure (COD entry 101033849). | ||
3.3 Surface stability
One of the main motivations for the development of the novel potential was the improvement of the surface stability enabling simulation studies of surface processes, e.g. surface protonation using a dissociative water model. This is particularly important when simulating solid/gas interfaces or materials in contact with liquid water as surface protonation facilitates surface degradation. Solid–liquid interfaces are typically simulated using a 2D treatment for the solid, necessitating a potential that is capable of describing the surface without any nonphysical surface reconstruction, as also reported for ZrO2 and Y2O3.24 Surface reconstruction usually results in a rearrangement of surface atoms, however, it should have no impact on the bulk properties of the investigated solid. This leads to a non-ideal description of the crystal structure. Thus, partial charge models, which are compatible with water models, are a prerequisite to accurately represent material surfaces. In contrast, integer-charge models, typically used to describe the bulk of the material, are in general not compatible with other potential models based on effective partial charges.The surface stability was tested through the construction of various interfacial systems, followed by simulating these structures at different temperatures using a 2D periodic pressure control. These surfaces comprised slabs of CeO2 and Gd2O3 with (001), (101) and (111) orientations. The simulations were conducted over a temperature range of 10 to 2000 K.
The (001) surface is known to be polar and, therefore, expected to be less stable on the surface, however, it was found to remain stable at lower temperatures. Fig. S3 (ESI†) displays the surface stability of (001) when compared to the full charge potential of Gunn et al.25 The latter case reveals deviations from the ideal crystal geometry observed near the surface propagating into the bulk, which is a prime example of nonphysical surface reconstruction. For the (101) plane of CeO2, it was also discovered that the surface is highly stable. The structural motif agrees with the bulk structure, although featuring minor deviations in the surface region. With the potential of Gunn et al., the bulk shows a significant deviation from the bulk crystal structure. In the case of the (111) surface, the 2D periodic crystal was found to be stable at all temperatures for both potentials.
In contrast, the (001) surface of Gd2O3 was found to be less stable than that of CeO2, seen in Fig. S4 (ESI†). Compared to Gunn et al.,25 the (101) and (111) surface structures were found to perform similarly. However, when using a (001) surface, the partial-charge potential model utilized in this work performs much better without major surface reconstruction. For the potential of Gunn et al., the surface reconstruction is visible, which can be attributed to the use of the formal atomic charges employed in this interaction model.
Thus, the novel potential presented in this work is capable of describing the surface of CeO2 and Gd2O3 without any major surface reconstruction, which was one of the main goals of the parametrization. This represents a significant improvement over the potential of Gunn et al.
3.4 Oxygen diffusion in GDC
The oxygen diffusion in GDC was analyzed to determine the diffusion coefficient and the associated activation energy. Equilibration included a 50 ps heating and pressurization period. Afterwards, sampling was conducted for 5 ns by simulating the GDC systems at 800, 1000, 1200, 1400, 1600, and 1800 K following equilibration to ensure much longer simulation periods compared to the correlation length used in the determination of the diffusion coefficient D.Fig. 6 shows the oxygen diffusion in GDC at different temperatures and mole percentages of Gd2O3, in comparison to the potential of Gunn et al.25 Significant variations in the diffusion coefficient can be observed between the different GDC systems at lower temperatures due to a lower number of individual diffusion events. Fewer sampled oxygen transitions lead to larger variations in the calculated diffusion coefficients, which is especially visible at 800 K. At higher temperatures, the variance in the diffusion coefficient is reduced, as the atoms are more mobile and oxygen diffusion is more likely to occur. Compared to Gunn et al., the diffusion coefficients are significantly higher at all temperatures and mole percentages of Gd2O3, by at least one order of magnitude.
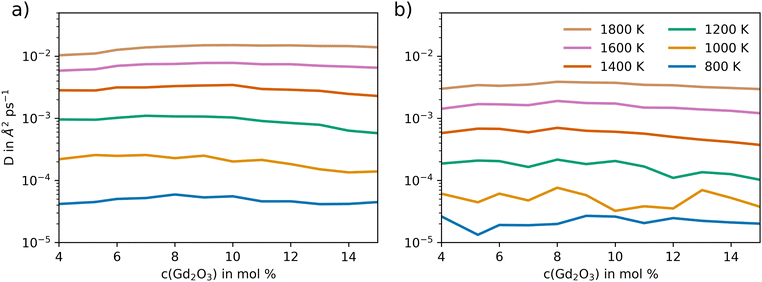 | ||
| Fig. 6 Self-diffusion coefficient of oxygen atoms in GDC as a function of Gd2O3 concentration and temperature obtained via extended MD simulations using (a) the newly developed potential model and (b) the potential reported by Gunn et al.25 | ||
Fig. 7(a) depicts the linearized Arrhenius representation (eqn (9)) of O diffusion in GDC at 5.3 mol% of Gd2O3 (GDC5.3). The diffusion coefficients accurately follow the experimental trend reported by Manning et al.56 Conversely, the oxygen diffusion using the potential of Gunn et al. is lower than the experimental values by up to one order of magnitude. In addition, further experimental data from Ruiz-Trejo et al.57 was included, which was reported for a GDC system including 18.3 mol% Gd2O3. The experimental data from Ruiz-Trejo et al. shows a significantly larger slope, implying that the activation energy increases with higher concentrations of Gd2O3.
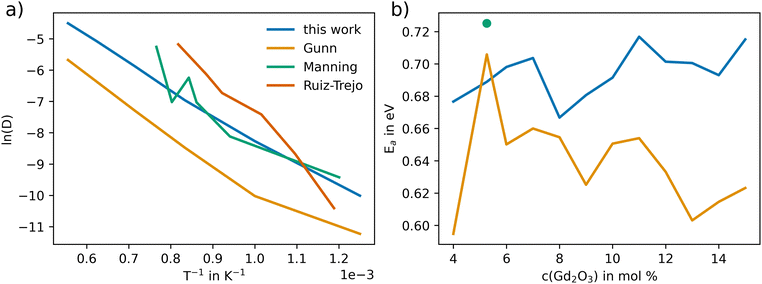 | ||
| Fig. 7 Arrhenius representation of the oxygen diffusion coefficient (D in Å−2 ps−1) in GDC (5.3% Gd2O3) obtained via MD simulations employing the potential derived in this work in comparison to results obtained via the potential model of Gunn et al.25 and experimental data from Manning et al.56 In addition, the results of Ruiz-Trejo et al.57 at 18.36 mol% are shown. (b) Activation energy EA obtained for different mol% of Gd2O3 in GDC including the results reported by Manning et al.56 The EA value resulting from the data of Ruiz-Trejo et al.57 of 1.15 eV is not shown in the figure. | ||
The activation energy at different Gd2O3 concentrations is shown in Fig. 7(b). At 5.3 mol% the EA using the potential of Gunn et al. with 0.706 eV does more closely match the 0.724 eV reported by Manning et al. However, the EA remains at constant values for higher concentrations of Gd2O3. The activation energy using the potential of this work resulted in a value at 5.3 mol% of 0.688 eV, which deviates by approximately 0.03 eV from the experimental value. The higher value can be explained to be most likely due to statistical deviation. The overall tendency is towards higher EA with higher mol%. The EA of 1.15 eV at 18.3 mol% reported by Ruiz-Trejo et al. is in line with our findings, indicating that at higher concentrations the activation energy increases. This is also consistent with the results observed previously for YSZ.24
3.5 Vibrational power spectrum
To analyze the VACF, individual simulations of 20 ps and a sampling frequency of 1 MD step were executed, which were started from an already pre-equilibrated configuration. As shown in the previous study of YSZ,24 due to averaging over many atoms and the short-time nature of the atomic vibrations, short trajectories proved to be sufficient to obtain reliable estimations of the respective vibrational power spectra.Additionally, as a reference for the vibrational properties of c-CeO2 and c-Gd2O3, calculations were performed using the potential of Gunn et al.25 The power spectrum of CeO2 (Fig. 8(a)) reveals a more narrow spectral distribution that is overall shifted to higher wave numbers. Nevertheless, the potential developed in this work is capable of describing the crystal in a similar way, as the bands appear in nearly the same wave number range. For Gd2O3 the vibrational power spectrum (Fig. 8(b)) shows substantial similarity to the reference. However, as in the case of CeO2, higher wave numbers compared to the potential of Gunn et al. can be observed. This points towards different curvatures in the two potential formulations.
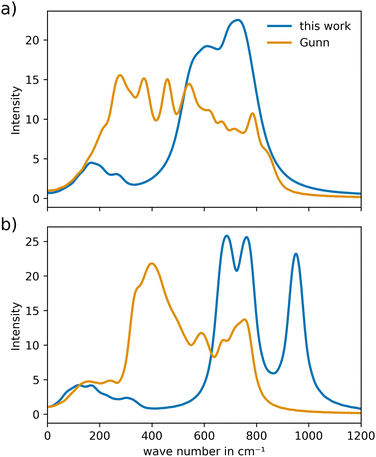 | ||
| Fig. 8 Comparison of the vibrational power spectra of (a) CeO2 and (b) Gd2O3 obtained from the novel potential and the potential reported by Gunn et al.25 | ||
The vibrational power spectra for both CeO2 and Gd2O3 are shifted to higher wave numbers in both cases, indicating slightly increased effective force constant resulting in more tightly bond ion-pairs as already seen in the RDFs that were compared to the reference potential, see Fig. S1 and S2 (ESI†).
3.6 Harmonic frequency spectrum
There are limitations in comparing the vibrational power spectra obtained from different force field potentials. The high cost involved in producing a vibrational power spectrum and the inability to distinguish between infrared- and Raman-active modes through a QM MD calculation, led to the eventual addition of the vibrational analysis. A comparison between the cost of the harmonic frequency calculation and the vibrational power spectrum is shown in Table S1 (ESI†). The harmonic infrared spectrum is compared to the spectrum resulting from the potential of Gunn et al.25 As a reference to the results obtained by both potentials, a DFT frequency calculation was added, as shown in Fig. 9.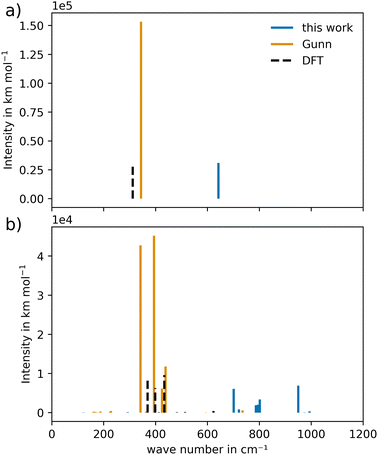 | ||
| Fig. 9 Harmonic infrared spectra of (a) CeO2 and (b) Gd2O3 of the newly constructed potential compared to Gunn et al.25 and DFT calculations at HSEsol level. | ||
To conduct the harmonic vibrational analysis, the systems were minimized using the respective parameter sets. To reduce the computational demand, the supercell dimensions were kept to a minimal size, while still maintaining consistency with the Coulomb cutoff distance. As a result, the supercell sizes were set to 4 × 4 × 4 and 2 × 2 × 2 unit cells in the case of CeO2 and Gd2O3, respectively.
For CeO2, the IR active frequency modes display good agreement with the DFT calculations, as shown in Fig. 9(a). The band shows a slight blue shift, suggesting a higher effective curvature in the potential. In contrast, the potential of Gunn et al. displays modes that closely match the wave number of the DFT calculation, indicating that the lower curvature is a more appropriate description of the system's vibrational properties. On the other hand, peak intensities differ significantly due to the different charge models. The potential of Gunn et al. uses integer charges, while the novel potential is based on partial atomic charges. This in turn leads to a lower intensity in the latter case that is more in line with the results determined by the DFT calculation. In the case of CeO2, the vibrational behavior suggests that additional adjustments to the potential parameters would be necessary to obtain a more accurate description of the wave numbers. However, from the perspective of the intensities, the novel potential model seems to be more suitable for the description of the vibrational properties.
In the case of Gd2O3, a similar result was obtained, shown in Fig. 9(b). The wave numbers observed for the novel potential are again blue-shifted, indicating a higher curvature in the potential between the ion pairs. The wave numbers of the potential of Gunn et al. are in line with the results obtained from the DFT frequency calculation. The increased number of visible frequency modes could be attributed to the disordered position of the O atoms in the crystal structure, illustrated in Fig. 1(b). This renders the crystal structure less ideal compared to that of CeO2. Additionally, the intensities, when compared to the DFT calculations, are similar to the result obtained for CeO2.
Fig. S5 (ESI†) shows the comparison of the spectra obtained from the harmonic frequency calculation with those determined via the MD simulation, i.e. vibrational power spectrum, for CeO2 and Gd2O3. The results are in good agreement, showing that the harmonic frequency calculation is a good replacement for the vibrational power spectrum since the latter is much more computationally demanding.
3.7 Comparison of the M–O potential
In Fig. S6a and b (ESI†) the M–O contribution of both the newly developed potential and those published by Gunn et al.25 are compared. At first sight, several notable differences are visible, foremost the strongly differing magnitude of the interaction. The latter is a direct result of the different partial charges employed in the model, which in turn result in differences in the coulombic contributions. Although these differences are compensated by the corresponding M–M and O–O interactions, it can be seen that they have a notable impact on the curvature of the potential near the minimum distances, which directly influences the vibrational wave numbers. However, when comparing the respective equilibrium distances in the M–O interactions, it is evident that the minima observed in the potential by Gunn et al. does not coincide with the ion–oxygen pair distance in the crystal structure. In fact, the minimum distances deviate from the M–O equilibrium distance by approx. 0.60 and 0.55 Å in case of CeO2 and Gd2O3, respectively (see also comparison in Fig. S6c and d, ESI†). This implies that in the simulation the correct M–O distances are only formed due to an error compensation between the attractive M–O interaction and the repulsive M–M and O–O contributions.In contrast, the equilibrium positions in the newly developed model are perfectly aligned with the expected M–O distances. However, this property comes at the price of a much steeper repulsive branch in the M–O contributions, which ultimately influences the vibrational wave numbers in a negative way. While it would be certainly possible to adjust the curvature of the potential to improve this particular aspect, it can be expected that other properties such as the lattice constant/density and O-diffusivity would be negatively impacted. In order to properly adjust the vibrational properties without introducing any additional shortcomings, a more complex description of the interactions beyond the capabilities of a pairwise additive Coulomb plus Buckingham potential would be required. While this not only requires a more complicated parametrization procedure, the use of uncommon functional forms of the potential greatly reduces the benefit of the newly derived interaction model, as alternative potentials are commonly not available in the majority of the available simulation packages.
4 Conclusion and outlook
In this work, a newly parametrized set of interaction potentials aimed at the description of CeO2, Gd2O3 and GDC has been derived based on the strategy already applied successfully in the case of ZrO2, Y2O3 and YSZ.24 Again, the use of atomic partial charges in the potentials significantly enhances the description of the crystal structure, as demonstrated by the RDFs as well as the density values. The surface stability was also greatly improved over existing potential models for all surfaces tested. Additionally, the use of a non-coulombic Gd–Gd pair potential greatly enhanced the description of Gd2O3, which was not accounted for in the potential of Gunn et al.25Application of this potential significantly improved the oxygen diffusivity by at least one order of magnitude compared to an early potential model reported by Gunn et al. Furthermore, the tendency of the activation energy with increasing concentration is in good agreement with the experimental data provided by Manning et al.56 and Ruiz-Trejo et al.57
However, a detailed analysis of the vibrational properties employing both harmonic frequency calculations as well as VACFs analyzed over the MD trajectory revealed, that the wave numbers obtained using the description of Gunn et al. are in better agreement with results obtained via DFT calculations at HSEsol level of theory, while the observed intensities of the vibrations are more in line with the results obtained from the novel potential formulation.
Based on a detailed comparison of the associated M–O potentials it was shown that the newly developed potential is capable of describing the crystal structure more accurately, as the equilibrium distances are in perfect agreement with the crystal structure. In contrast, the potential by Gunn et al. does not accurately describe the crystal structure, as the equilibrium distances deviate from those observed in the crystal structure. While this shortcoming has an overall positive influence on the vibrational wave numbers, it implies that the correct M–O distances are only formed due to an error compensation between the attractive M–O interaction and the repulsive M–M and O–O contributions. This, on the other hand, explains the deviations in the ion diffusion as well as the too large density observed in the case of Gd2O3.
The newly developed potential presented in the work was shown to successfully describe the crystal structure of CeO2 and Gd2O3 at ambient conditions and elevated temperatures. The benefit of using partial charges is that the model can be used in conjunction with existing partial charge models such as a reactive water model developed earlier by Wiedemair28,29 as well as force fields aimed at the description of organic and biomolecular systems.58,59 This would enable simulations of surface processes such as the formation of a Helmholtz double layer and associated reactive corrosion process as well as the adsorption of organic molecules at GDC interfaces in the presence of liquid water. Furthermore, it enables in-depth analysis of surface reactions, such as water dissociation and surface hydroxyl group formation, without requiring a complex and computationally expensive ab initio approach. However, these reactive potentials would facilitate a QM/MM approach, which would allow for a more detailed description of the surface processes. In addition, the effect of surface protonation on the oxygen diffusivity and overall performance of different GDC systems in solid oxide fuel cells and electrolyzers can be thoroughly examined. This is because diffusion phenomena can only be observed using larger time scales and system sizes, which are made possible by the newly developed potential.
Conflicts of interest
There are no conflicts to declare.Acknowledgements
The computational results presented were achieved (in part) using the HPC infrastructure of the University of Innsbruck.References
- M. K. Singla, P. Nijhawan and A. S. Oberoi, Hydrogen fuel and fuel cell technology for cleaner future: a review, Environ. Sci. Pollut. Res., 2021, 28, 15607–15626 CrossRef CAS PubMed.
- P. R. Shukla, J. Skea, R. Slade, A. Al Khourdajie, R. van Diemen, D. McCollum, M. Pathak, S. Some, P. Vyas, R. Fradera, M. Belkacemi, A. Hasija, G. Lisboa, S. Luz and J. Malley, Climate Change 2022 – Mitigation of Climate Change: Working Group III Contribution to the Sixth Assessment Report of the Intergovernmental Panel on Climate Change, Cambridge University Press, 2023, pp.51–148 Search PubMed.
- D. A. Cullen, K. C. Neyerlin, R. K. Ahluwalia, R. Mukundan, K. L. More, R. L. Borup, A. Z. Weber, D. J. Myers and A. Kusoglu, New roads and challenges for fuel cells in heavy-duty transportation, Nat. Energy, 2021, 6, 462–474 CrossRef CAS.
- T. Kadyk, R. Schenkendorf, S. Hawner, B. Yildiz and U. Römer, Design of Fuel Cell Systems for Aviation: Representative Mission Profiles and Sensitivity Analyses, Front. Energy Res., 2019, 7, 35 CrossRef.
- N. Brandon, S. Skinner and B. Steele, Recent Advances in Materials for Fuel Cells, Annu. Rev. Mater. Res., 2003, 33, 183–213 CrossRef CAS.
- D. Cheddie and N. Munroe, Review and comparison of approaches to proton exchange membrane fuel cell modeling, J. Power Sources, 2005, 147, 72–84 CrossRef CAS.
- N. Mohammad, A. B. Mohamad, A. A. H. Kadhum and K. S. Loh, A review on synthesis and characterization of solid acid materials for fuel cell applications, J. Power Sources, 2016, 322, 77–92 CrossRef CAS.
- T. Ferriday and P. H. Middleton, Alkaline fuel cell technology - A review, Int. J. Hydrogen Energy, 2021, 46, 18489–18510 CrossRef CAS.
- S. J. Skinner and J. A. Kilner, Oxygen ion conductors, Mater. Today, 2003, 6, 30–37 CrossRef CAS.
- J. W. Fergus, Electrolytes for solid oxide fuel cells, J. Power Sources, 2006, 162, 30–40 CrossRef CAS.
- S. Y. Gómez and D. Hotza, Current developments in reversible solid oxide fuel cells, Renewable Sustainable Energy Rev., 2016, 61, 155–174 CrossRef.
- F. S. da Silva and T. M. de Souza, Novel materials for solid oxide fuel cell technologies: A literature review, Int. J. Hydrogen Energy, 2017, 42, 26020–26036 CrossRef CAS.
- B. S. Prakash, S. S. Kumar and S. Aruna, Properties and development of Ni/YSZ as an anode material in solid oxide fuel cell: A review, Renewable Sustainable Energy Rev., 2014, 36, 149–179 CrossRef.
- H. L. Tuller and A. S. Nowick, Doped Ceria as a Solid Oxide Electrolyte, J. Electrochem. Soc., 1975, 122, 255–259 CrossRef CAS.
- B. Steele, Appraisal of Ce1−yGdyO2−y/2 electrolytes for IT-SOFC operation at 500 °C, Solid State Ionics, 2000, 129, 95–110 CrossRef CAS.
- J. Koettgen, S. Grieshammer, P. Hein, B. O. H. Grope, M. Nakayama and M. Martin, Understanding the ionic conductivity maximum in doped ceria: trapping and blocking, Phys. Chem. Chem. Phys., 2018, 20, 14291–14321 RSC.
- T. Liu, X. Zhang, L. Yuan and J. Yu, A review of high-temperature electrochemical sensors based on stabilized zirconia, Solid State Ionics, 2015, 283, 91–102 CrossRef CAS.
- A. Iio, H. Ikeda, S. A. Anggraini and N. Miura, Sensing characteristics of YSZ-based oxygen sensors attached with BaxSr1−xFeO3 sensing-electrode, Solid State Ionics, 2016, 285, 234–238 CrossRef CAS.
- P. Wózniak, M. A. Małecka, P. Kraszkiewicz, W. Miśta, O. Bezkrovnyi, L. Chinchilla and S. Trasobares, Confinement of nano-gold in 3D hierarchically structured gadolinium-doped ceria mesocrystal: synergistic effect of chemical composition and structural hierarchy in CO and propane oxidation, Catal. Sci. Technol., 2022, 12, 7082–7113 RSC.
- A. Bhalkikar, T.-S. Wu, T. J. Fisher, A. Sarella, D. Zhang, Y. Gao, Y.-L. Soo and C. L. Cheung, Tunable catalytic activity of gadolinium-doped ceria nanoparticles for pro-oxidation of hydrogen peroxide, Nano Res., 2020, 13, 2384–2392 CrossRef CAS.
- M. Mogensen, Physical, chemical and electrochemical properties of pure and doped ceria, Solid State Ionics, 2000, 129, 63–94 CrossRef CAS.
- A. Solovyev, A. Shipilova, E. Smolyanskiy, S. Rabotkin and V. Semenov, The Properties of Intermediate-Temperature Solid Oxide Fuel Cells with Thin Film Gadolinium-Doped Ceria Electrolyte, Membranes, 2022, 12, 896 CrossRef CAS PubMed.
- A. Aguadero, L. Fawcett, S. Taub, R. Woolley, K.-T. Wu, N. Xu, J. A. Kilner and S. J. Skinner, Materials development for intermediate-temperature solid oxide electrochemical devices, J. Mater. Sci., 2012, 47, 3925–3948 CrossRef CAS.
- T. S. Hofer, F. M. Kilchert and B. A. Tanjung, An effective partial charge model for bulk and surface properties of cubic ZrO2, Y2O3 and yttrium-stabilised zirconia, Phys. Chem. Chem. Phys., 2019, 21, 25635–25648 RSC.
- D. S. Gunn, J. A. Purton and S. Metz, Monte Carlo simulations of gadolinium doped ceria surfaces, Solid State Ionics, 2018, 324, 128–137 CrossRef CAS.
- H. Inaba, Molecular dynamics simulation of gadolinia-doped ceria, Solid State Ionics, 1999, 122, 95–103 CrossRef CAS.
- F. Ye, T. Mori, D. R. Ou and A. N. Cormack, Dopant type dependency of domain development in rare-earth-doped ceria: An explanation by computer simulation of defect clusters, Solid State Ionics, 2009, 180, 1127–1132 CrossRef CAS.
- M. J. Wiedemair and T. S. Hofer, Towards a dissociative SPC-like water model – probing the impact of intramolecular Coulombic contributions, Phys. Chem. Chem. Phys., 2017, 19, 31910–31920 RSC.
- T. S. Hofer and M. J. Wiedemair, Towards a dissociative SPC-like water model II. The impact of Lennard-Jones and Buckingham non-coulombic forces, Phys. Chem. Chem. Phys., 2018, 20, 28523–28534 RSC.
- T. S. Mahadevan and S. H. Garofalini, Dissociative Chemisorption of Water onto Silica Surfaces and Formation of Hydronium Ions, J. Phys. Chem. C, 2008, 112, 1507–1515 CrossRef CAS.
- T. S. Mahadevan and S. H. Garofalini, Dissociative Water Potential for Molecular Dynamics Simulations, J. Phys. Chem. B, 2007, 111, 8919–8927 CrossRef CAS PubMed.
- T. P. Senftle, S. Hong, M. M. Islam, S. B. Kylasa, Y. Zheng, Y. K. Shin, C. Junkermeier, R. Engel-Herbert, M. J. Janik, H. M. Aktulga, T. Verstraelen, A. Grama and A. C. T. van Duin, The ReaxFF reactive force-field: development, applications and future directions, npj Comput. Mater., 2016, 2, 15011 CrossRef CAS.
- R. V. Krishnan, G. Panneerselvam, P. Manikandan, M. Antony and K. Nagarajan, Heat Capacity and Thermal Expansion of Uranium-Gadolinium Mixed Oxides, J. Nucl. Radiochem. Sci., 2009, 10, 19–26 CAS.
- S. Sameshima, M. Kawaminami and Y. Hirata, Thermal Expansion of Rare-Earth-Doped Ceria Ceramics, J. Ceram. Soc. Jpn., 2002, 110, 597–600 CrossRef CAS.
- M. Allen and D. Tildesley, Computer Simulation of Liquids, Oxford University Press, London, 2017 Search PubMed.
- J. W. Ochterski, Vibrational analysis in Gaussian, Gaussian, 1999, http://gaussian.com/vib/ Search PubMed.
- J. M. Gallmetzer and J. Gamper, VibrationalAnalysis.jl., 2024, https://github.com/MolarVerse/VibrationalAnalysis.jl. Search PubMed.
- W. C. Swope, H. C. Andersen, P. H. Berens and K. R. Wilson, A computer simulation method for the calculation of equilibrium constants for the formation of physical clusters of molecules: Application to small water clusters, J. Chem. Phys., 1982, 76, 637–649 CrossRef CAS.
- H. J. C. Berendsen, J. P. M. Postma, W. F. van Gunsteren, A. DiNola and J. R. Haak, Molecular dynamics with coupling to an external bath, J. Chem. Phys., 1984, 81, 3684–3690 CrossRef CAS.
- D. Wolf, P. Keblinski, S. R. Phillpot and J. Eggebrecht, Exact method for the simulation of Coulombic systems by spherically truncated, pairwise r-1 summation. The, J. Chem. Phys., 1999, 110, 8254–8282 CrossRef CAS.
- A. Vaitkus, A. Merkys and S. Gražulis, Validation of the Crystallography Open Database using the Crystallographic Information Framework, J. Appl. Crystallogr., 2021, 54, 661–672 CrossRef CAS PubMed.
- M. Quirós, S. Gražulis, S. Girdzijauskaitė, A. Merkys and A. Vaitkus, Using SMILES strings for the description of chemical connectivity in the Crystallography Open Database, J. Cheminf., 2018, 10, 23 Search PubMed.
- A. Merkys, A. Vaitkus, J. Butkus, M. Okulič-Kazarinas, V. Kairys and S. Gražulis, COD::CIF::Parser: an error-correcting CIF parser for the Perl language, J. Appl. Crystallogr., 2016, 49, 292–301 CrossRef CAS PubMed.
- S. Gražulis, A. Merkys, A. Vaitkus and M. Okulič-Kazarinas, Computing stoichiometric molecular composition from crystal structures, J. Appl. Crystallogr., 2015, 48, 85–91 CrossRef PubMed.
- S. Gražulis, A. Daškevič, A. Merkys, D. Chateigner, L. Lutterotti, M. Quirós, N. R. Serebryanaya, P. Moeck, R. T. Downs and A. L. Bail, Crystallography Open Database (COD): an open-access collection of crystal structures and platform for worldwide collaboration, Nucleic Acids Res., 2011, 40, D420–D427 CrossRef PubMed.
- S. Gražulis, D. Chateigner, R. T. Downs, A. F. T. Yokochi, M. Quirós, L. Lutterotti, E. Manakova, J. Butkus, P. Moeck and A. L. Bail, Crystallography Open Database – an open-access collection of crystal structures, J. Appl. Crystallogr., 2009, 42, 726–729 CrossRef PubMed.
- R. T. Downs and M. Hall-Wallace, The American Mineralogist Crystal Structure Database, Am. Mineral., 2003, 88, 247–250 CrossRef CAS.
- R. W. G. Wyckoff, Crystal Structure, Interscience Publishers, New York, 1963 Search PubMed.
- W. Zachariasen, The crystal structure of the modification C of the sesquioxides of the rare earth metals, and of indium and thallium, Nor. Geol. Tidsskr., 1927, 9, 310–316 CAS.
- A. Erba, J. K. Desmarais, S. Casassa, B. Civalleri, L. Doná, I. J. Bush, B. Searle, L. Maschio, L. Edith-Daga, A. Cossard, C. Ribaldone, E. Ascrizzi, N. L. Marana, J.-P. Flament and B. Kirtman, CRYSTAL23: A Program for Computational Solid State Physics and Chemistry, J. Chem. Theory Comput., 2022, 19, 6891–6932 CrossRef PubMed.
- L. Schimka, J. Harl and G. Kresse, Improved hybrid functional for solids: The HSEsol functional. The, J. Chem. Phys., 2011, 134, 024116 CrossRef PubMed.
- J. P. Perdew, A. Ruzsinszky, G. I. Csonka, O. A. Vydrov, G. E. Scuseria, L. A. Constantin, X. Zhou and K. Burke, Restoring the Density-Gradient Expansion for Exchange in Solids and Surfaces, Phys. Rev. Lett., 2008, 100, 136406 CrossRef PubMed.
- K. E. El-Kelany, C. Ravoux, J. K. Desmarais, P. Cortona, Y. Pan, J. S. Tse and A. Erba, Spin localization, magnetic ordering, and electronic properties of strongly correlated Ln2O3 sesquioxides (Ln = La, Ce, Pr, Nd), Phys. Rev. B, 2018, 97, 245118 CrossRef CAS.
- J. K. Desmarais, A. Erba and R. Dovesi, Generalization of the periodic LCAO approach in the CRYSTAL code to g-type orbitals, Theor. Chem. Acc., 2018, 137, 28 Search PubMed.
- D. V. Oliveira, J. Laun, M. F. Peintinger and T. Bredow, BSSE-correction scheme for consistent Gaussian basis sets of double- and triple-zeta valence with polarization quality for solid-state calculations, J. Comput. Chem., 2019, 40, 2364–2376 CrossRef PubMed.
- P. Manning, Oxygen self-diffusion and surface exchange studies of oxide electrolytes having the fluorite structure, Solid State Ionics, 1996, 93, 125–132 CrossRef CAS.
- E. Ruiz-Trejo, Oxygen ion diffusivity, surface exchange and ionic conductivity in single crystal Gadolinia doped Ceria, Solid State Ionics, 1998, 113–115, 565–569 CrossRef CAS.
- Y. Duan, C. Wu, S. Chowdhury, M. C. Lee, G. Xiong, W. Zhang, R. Yang, P. Cieplak, R. Luo, T. Lee, J. Caldwell, J. Wang and P. Kollman, A point-charge force field for molecular mechanics simulations of proteins based on condensed-phase quantum mechanical calculations, J. Comput. Chem., 2003, 24, 1999–2012 CrossRef CAS PubMed.
- B. R. Brooks, R. E. Bruccoleri, B. D. Olafson, D. J. States, S. Swaminathan and M. Karplus, CHARMM: A program for macromolecular energy, minimization, and dynamics calculations, J. Comput. Chem., 1983, 4, 187–217 CrossRef CAS.
Footnote |
| † Electronic supplementary information (ESI) available. See DOI: https://doi.org/10.1039/d3cp05053j |
| This journal is © the Owner Societies 2024 |
