Shell thickness-induced thermal dependence: highly sensitive core–shell CdSe/ZnS/POSS-based temperature probes†
Jiannan
Sun
a,
Ke
Yan
 *a,
Aizhao
Pan
 *b,
Pan
Zhang
*a,
Xuehang
Chen
a,
Xinyi
Shi
a and
Chengyu
Shi
b
aKey Laboratory of Education Ministry for Modern Design & Rotor-Bearing System, Xi’an Jiaotong University, Xi’an, 710049, PR China. E-mail: yanke@mail.xjtu.edu.cn; zhangpan@xjtu.edu.cn
bDepartment of Chemistry, School of Chemistry, Xi’an Jiaotong University, Xi’an, 710049, PR China. E-mail: panaizhao2017032@xjtu.edu.cn
First published on 18th March 2024
Abstract
Fluorescence nanothermometry based on quantum dots is a current research hotspot for novel non-contact temperature monitoring, and is of vital significance for the modulation and design of the sensing properties of sensors. Herein, a design strategy to modulate the temperature-sensing characteristics of quantum dots based on the thickness of a shell is proposed. In this study, CdSe/ZnS quantum dot/POSS-based temperature probe films with varying fluorescence characteristics were developed, and the influence of the ZnS shell on temperature sensing was examined by varying the thickness of the ZnS shell. The temperature dependency, linearity, range of applications, and reversibility of quantum dot thin film probes were all considerably regulated by the ZnS shell, according to research on quantum dot/POSS-based films coated with various shell thicknesses. The CdSe/ZnS temperature probe with 4 monolayers (MLs) stood out among the rest due to its strong thermal stability (at least 5 cycles), large usable temperature range (20–80 °C), and excellent temperature sensitivity (R2 > 0.994). The results demonstrated that the temperature sensing performance of quantum dots was the consequence of the combined effect of multiple temperature response properties induced by the thickness of the shell, and the shell control of quantum dots to optimize the temperature sensing performance was an essential approach for the design of temperature probes. This work demonstrates the great potential of the shell in tuning the temperature sensing performance of quantum dots and provides a viable approach for the design of quantum dot temperature probes.
Introduction
With the development of integrated and high-speed devices in the mechanical, optoelectronic, biological, and medical fields, traditional methodologies for temperature monitoring have fallen short of the demand, and the exploration of non-invasive in situ thermal sensing has attracted much attention.1–5 For example, in the monitoring of biological organ signals or high-speed rotating devices (e.g., bearings), traditional contact detection technologies are bottlenecked by their size limitations and wired signaling methods. Furthermore, the spatial resolution of traditional non-contact sensing methods renders them challenging to employ for temperature monitoring when the typical dimensions of functional structures reach the nanoscale. As a result, numerous novel testing methods have been developed to handle a variety of circumstances. Among them, sensing materials based on fiber-optic chemical sensing are gradually favored by researchers due to their microscopic size, high sensitivity, and rich and adjustable physicochemical properties, and have demonstrated significant application potential in multiple monitoring fields such as temperature, humidity, pH value, and gas. For instance, the luminescence properties of certain examples of lanthanide metals were utilized to investigate their possible application in temperature-dependent luminescence sensors for temperature sensing.6,7 In addition, materials such as fluorescent dyes have also demonstrated potential for temperature measurement, with Andrew W. Wood et al.8 using rhodamine B to measure temperature changes induced by radiofrequency radiation in biological samples. Among the methods, temperature detection methods based on material fluorescence changes are suitable for non-contact in situ monitoring of localized tiny sites in target devices, thus becoming a favorite in the field of temperature monitoring.As a new class of semiconductor nanomaterials, quantum dots have been favored as sensor materials due to their high fluorescence quantum yield, favorable photostability, and high fluorescence intensity.9–12 In recent years, the potential of semiconductor quantum dots for temperature-detection applications has been gradually confirmed. Previous studies have demonstrated that the spectral properties of quantum dots vary with temperature, thus enabling the possibility of thermal testing of quantum dots. For instance, in line with recent reports,13–16 quantum dot materials, such as chalcogenides, cadmium tellurides, selenides, and so forth, are growing increasingly prevalent as temperature sensing materials. By modifying their surfaces, these materials can be developed into temperature sensors with a wide range of potential uses.17–19 However, there are still some limitations in the quantum dot-based thermal measurement technique. There are still certain issues with quantum dots in practical applications. These issues include low thermal stability, undesired errors in fluorescence intensity caused by laser fluctuations, and inadequate sensitivity, all of which have brought about some trouble in the acquisition of temperature information.20–22 To overcome these drawbacks, further applications of quantum dots have been rendered feasible with the development of a series of sensors based on surface optimization and other fluorescence features (peak intensity ratio, peak wavelength, full width at half maximum, etc.)23–28 Nevertheless, most of the previously reported studies have concentrated on the material selection and appropriate management of synthesis conditions, but relatively little investigation has been carried out into the variables affecting the temperature characteristics of quantum dots.
The study of quantum dot-based temperature sensor devices benefits greatly from the understanding of their temperature-dependent photoluminescence properties. However, the implementation of quantum dots is constrained by issues of suboptimal response sensitivity, poor thermal stability, and a narrow temperature response range.29,30 Thus, constructing a sensing material with great sensitivity and stability is still problematic. A particular significance of the design of quantum dot-based sensing materials is figuring out how to adjust the temperature characteristics of quantum dots.
In this work, CdSe/ZnS quantum dots were used to design temperature sensors with high thermal stability and high sensitivity based on peak wavelength. We found that the controllable thermal properties of quantum dots can be achieved by controlling different thicknesses. Through attempting to synthesize core–shell quantum dots with different amounts of reactive feedstock, the thickness of the shell layer with different dimensions caused the quantum dots to exhibit distinctly differing temperature-sensitive properties, and thus we introduced ZnS shell layers with different gradients (1, 4, and 7 MLs) in the synthesis process. By varying the ZnS shell's thickness, we were able to synthesize CdSe/ZnS quantum dots with various fluorescence properties. Based on these quantum dots, we fabricated temperature probe films that exhibited both high sensitivity and stability at high temperatures. Then, the role of the shell in affecting the temperature sensing of quantum dots was further investigated by testing the temperature response characteristics of the films. The experimental results demonstrated that the quantum dot thin-film probes exhibited significant temperature dependence according to the peak wavelength of the fluorescence spectra, in which the shell played an obvious role in regulating the sensitivity, temperature dependence, and applicable temperature range of the quantum dots. Among them, the CdSe/ZnS temperature probe of 4 MLs exhibited comprehensively optimal temperature response properties, including good temperature sensitivity (R2 > 0.99732), a high-temperature applicability range (20–80 °C) and excellent thermal stability (at least 5 cycles). This indicates that the key to optimizing a temperature probe is determining the shell thickness that will maximize the quantum dots' ability to sense temperature. The above work demonstrates the great potential of shells for modulating the temperature-sensing properties of quantum dots and provides a feasible approach for designing efficient optical sensing probes.
Experimental section/methods
Chemicals
All starting materials were obtained from commercial sources and were ready to use without further purification. Selenium powder (99.5%, powder) and sulfur (99.5%, powder) were obtained from Sigma. 1-Octadecene (ODE, 90%), cadmium oxide (99.99%), zinc acetate dihydrate (99.99%, powder), N,N,N′,N′,N′′-pentamethyldiethylene triamine (PMDETA, 97%) and azobisisobutyronitrile (AIBN, C8H12N4, Fw = 164.21) were provided by Aladdin. Tri-n-octylphosphine (TOP, 97%), oleic acid (OA, 90%), and other organic solvents were purchased from Rhawn. The supplier of MAPOSS (99.9%, C35H74O14Si8, Fw = 943.64) powder was Hybrid Plastics (USA). In anhydrous ethanol, GMA (97%, C7H10O3, Fw = 142.15) and AIBN were recrystallized. Before being used, dibutyl ketone was distilled under low pressure after being agitated over CaH2 for 12 hours at room temperature. Toluene, methanol, and ethyl acetate were used exactly as supplied.Synthesis of the CdSe core
The synthesis process was performed according to the standard procedure in the literature.31 Usually, 0.1 mmol of Se powder was prepared with 4.9 ml of ODE and 0.1 ml of TOP at 220 °C to form a solution of the Se precursor. 1 mmol of CdO was dissolved in 4 ml of ODE and 1 ml of oleic acid at 150 °C to form a Cd precursor. Then, 1 ml of the Cd precursor was taken and quickly injected into the Se precursor solution at 220 °C with rapid stirring, and the green-emitting CdSe core quantum dots were obtained by withdrawing the heat source after a certain period and cooling to room temperature.Synthesis of core/shell CdSe/ZnS QDs with distinct shell thicknesses
CdSe/ZnS core–shell QDs were prepared using the tri-n-octylphosphine assisted successive ionic layer adsorption and reaction (TOP-SILAR) method.32 That is, with TOP solution injected as the activator, specific amounts of Zn precursor and S precursor solutions were added alternately into the reaction vials via a syringe to achieve the cyclic growth of ZnS shell monolayers. CdSe/ZnS products with varying shell thicknesses were eventually developed using this methodology. Using the empirical mathematical functions as a reference, the molar concentration of the core CdSe NCs and the amount of precursors with the required number of layers to grow on the surface of the core NCs were determined33 (ESI†). In this way, CdSe/ZnS quantum dots with ZnS shell thicknesses of 1, 4, and 7 monolayers (MLs) were prepared (Scheme 1).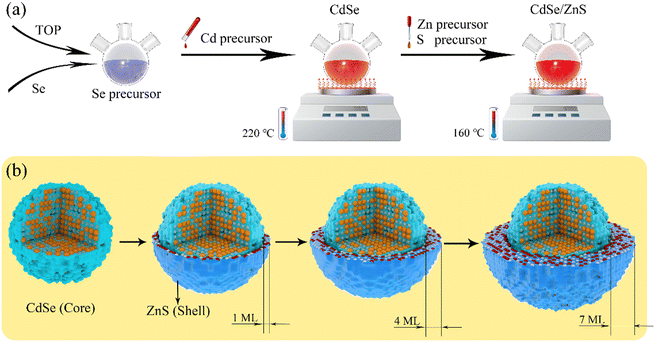 | ||
| Scheme 1 Schematic diagram of the preparation of core/shell CdSe/ZnS QDs. (a) Preparation process of CdSe/ZnS quantum dots. (b) CdSe/ZnS quantum dots with different shell thicknesses. | ||
Fabrication of QD-POSS-based films
POSS-based glycidyl methacrylate copolymers used for the formulation of thin film probes were synthesized according to the procedure outlined in the literature.34 Generally, anhydrous dibutyl ketone was used to dissolve a specific amount of AIBN, MAPOSS, and GMA. The solution was then rotary evaporated, flocculated with excess methanol added, and vacuum dried to produce P(GMA-MAPOSS) white powder. After dissolving the P(GMA-MAPOSS) powder (10 wt%) and CdSe/ZnS powder (6 wt%) in toluene and stirring, PMDETA (1 wt%) was added dropwise as a catalytic curing agent, and the mixture was stirred for 30 minutes. The resultant solution was evenly spread across the substrate's surface, and as it evaporated, a homogenous film was fabricated.Results and discussion
Morphology and luminescence characterization
In this study, we synthesized CdSe/ZnS core–shell quantum dots with shell numbers of 1 ML, 4 MLs, and 7 MLs based on CdSe core quantum dots with green emission. The UV-vis absorbance and photoluminescence spectra with excitation at 405 nm of the CdSe core and CdSe/ZnS core–shell quantum dots with different ZnS monolayers are demonstrated in Fig. 1a and b, respectively. It was discovered that the quantum dots showed a notable redshift upon the encapsulation of the CdSe core NCs by the ZnS shell, and a minor blue shift upon the increase in the shell thickness. This was attributed to the widening of the bandgap of the core–shell quantum dots due to the larger bandgap of the ZnS shell compared to the CdSe core, which further led to the blue shift of the PL peak when the thickness of the ZnS shell of the quantum dots is increased to a certain extent.35–37 As can be verified from Fig. 1a, the quantum dot core's absorption intensity gradually diminished as the coating of the quantum dot shell increases. This results in the absorption peak of the quantum dot's first exciton gradually flattening. Besides, the trend of the position change of the absorption peak is in line with that of the PL peak, which is red-shifted and then bluish-shifted.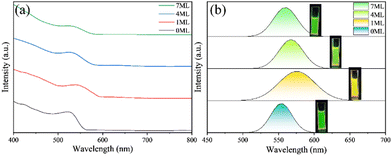 | ||
| Fig. 1 (a) UV absorption spectra and (b) photoluminescence spectra of CdSe/ZnS quantum dots with different shell thicknesses. | ||
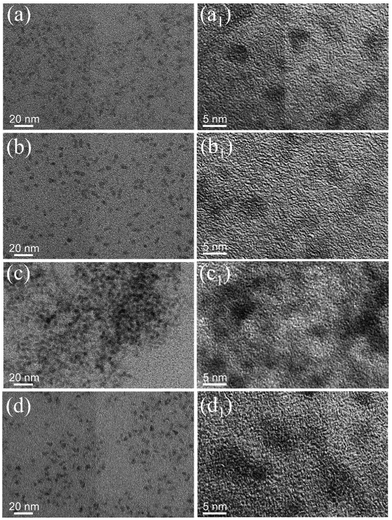
Fig. 2 displays typical TEM images of CdSe/ZnS QDs with varying shell thicknesses. As shown in the figure, the quantum dots were all more uniformly distributed and exhibited irregular particle shapes (Fig. 2a–d). The high-resolution transmission electron microscopy (TEM) images of the quantum dots are displayed in the right half of Fig. 2. These images allowed for the unambiguous observation of the lattice stripes of the quantum dots, demonstrating the great crystallinity of the produced quantum dot crystals. After encapsulating the ZnS shell, the average particle size of the CdSe/ZnS quantum dots was significantly larger (3.26 nm for 1 ML, 3.99 nm for 4 MLs, and 4.93 nm for 7 MLs) as compared to the core size (2.91 nm), which was roughly consistent with the number of added ZnS monolayers (Fig. S1, ESI†). This also proved that the CdSe core successfully encapsulated the ZnS shell.
Characterization of CdSe/ZnS QD/POSS-based films
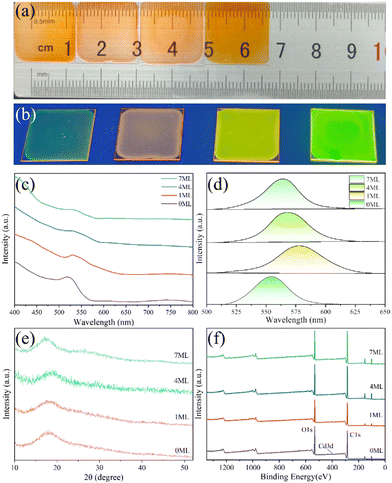
We have demonstrated the adhesive strength and hydrophobic properties of POSS-based thin film coatings as functional sensor materials in our previous work.15 The CdSe/ZnS QD films formed on the glass substrate are shown in Fig. 3a. When the QD films were exposed to normal daylight, the scale of the straightedge covered by the manufactured films could be observed. This indicated that the film had a high transparency level, which expanded the range of applications for it as a transparent temperature sensor. In addition, the fluorescence properties of the quantum dot/POSS-based films were examined (Fig. 3b). It was observed that the PL intensity of the QD films increased significantly with the growth of the ZnS shell under UV laser irradiation, which was especially obvious for the QD films with shell thicknesses of 4 MLs and 7 MLs. Furthermore, greater luminescence intensity as a sensing material facilitated the possibility of capturing the fluorescence information from the sensor, which was of inescapable importance for optical sensing. The UV-vis absorbance and photoluminescence spectra of the CdSe core and CdSe/ZnS core–shell QD/POSS-based films with varying ZnS monolayers, respectively, are demonstrated in Fig. 3c and d. These spectra essentially agreed with those of the quantum dot solutions, indicating a favorable stability of the QD films. The X-ray diffractogram and X-ray photoelectron spectra of the QD films are illustrated in Fig. 3e and f, respectively, which demonstrated the successful encapsulation and synthesis of quantum dots within POSS-based films through the analysis of elemental and lattice information in the figures.Temperature sensing performance
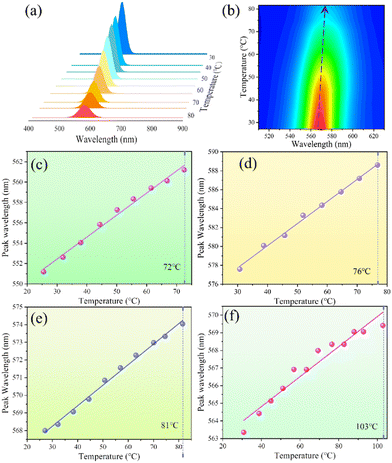
The temperature response properties of four quantum dot/POSS-based films were tested utilizing the constructed temperature test platform. A PT100 sensor was adopted for the rapid and accurate temperature regulation of the platform. In this manner, we obtained the PL spectra of the QD film probes at different temperatures. Fig. 4a demonstrates the fluorescence spectra (excited at 405 nm) of the quantum dot/POSS-based film (4 ML shell thickness) during the heating process, and it could be recognized that the fluorescence intensity of the temperature probe exhibited a decreasing trend with the elevation of temperature. However, the decreasing trend of the fluorescence intensity of the probe did not exhibit a well-defined linearity, suggesting that fluorescence intensity is not a favored temperature indication. Fig. 4b shows the mapping plot of Fig. 4a, and it was observed that the peak position of the spectra was red-shifted with increasing temperature with an approximately linear trend, which implied an excellent correlation between the temperature parameter and the peak wavelength of the fluorescence spectra of the probes. The redshift of the peak wavelength of the semiconductor PL reflected the contraction of the energy band gap with increasing temperature due to the lattice deformation potential and exciton–phonon coupling.The spectral information obtained from the tests was collected to analyze the thermal response characteristics of QD films with varying ZnS shell thicknesses. Fig. 4c–f illustrate the temperature dependence of the peak wavelength during the heating process for each of the four probes, which can be fitted with a linear function over a certain range. As depicted, various QD film probes exhibited differing temperature dependencies, which was reflected in the dispersion of the data points as well as the tolerance performance of the probes. To evaluate the temperature dependence of the probes at an improved degree, goodness of fit (square of the Pearson correlation coefficient) was introduced to express the linearity of the curves, with its value being closer to 1 the better. The values of the four probes were 0.99062, 0.99529, 0.99465, and 0.94, respectively. The ZnS shell thickness of 1 ML and 4 MLs in the QD films proved a favorable temperature correlation above that of the core quantum dots. However, as the ZnS shell grew bigger, the wavelength-temperature correlation rapidly decreased. It can be concluded that the encapsulation of ZnS shells exerted a modulating effect on the temperature-dependent properties of the quantum dots. ZnS shells optimized the temperature-dependent curves of the quantum dots to a certain degree, but further thickening of the ZnS shells results in a more significant decrease in thermal sensitivity. Furthermore, the figure unambiguously demonstrated the applicable temperature response range for each QD film probe. The ZnS shell encapsulation caused the temperature tolerance range of the probes to display a notable growth trend between core CdSe and 7 ML-CdSe/ZnS of roughly 30 °C. This implied that the ZnS shell exerted a positive feedback impact on the quantum dots’ temperature measurement range. Among them, the CdSe/ZnS QD film probe revealed a high linearity and tolerance range when the Zns shell thickness was 4 monolayers. The temperature-varying characteristics of the peak wavelength of the PL spectrum in the figure are determined by the temperature-varying characteristics of the forbidden bandwidth of the quantum dots, which is mainly dominated by the quantum size effect and exciton–phonon coupling when the temperature is increased. Since the forbidden bandwidth temperature coefficient of the semiconductor material is negative, the forbidden bandwidth temperature coefficient of the quantum size effect is negative, and the forbidden bandwidth temperature coefficient of the phonon coupling is positive, the forbidden bandwidth temperature coefficient of the quantum dot is negative for the CdSe/ZnS quantum dots with small-size characteristics used in the present experiments, i.e., the peak wavelengths of PL spectra of the core–shell quantum dots increase with the increase of the temperature in the temperature range.38
Fig. 5 illustrates the cycling characteristics of the peak fluorescence wavelength of the thin-film probe with respect to temperature to investigate the temperature reversibility index of the film. The film probes were subjected to heating and cooling cycles at temperatures ranging from 20 to 80 °C to observe the trend of the peak fluorescence wavelength of the films. As illustrated in Fig. 5, the ZnS shell was crucial in controlling the film throughout the thermal cycling test, and as the thickness of the shell increases, so did the reversibility of the QD film's thermal sensing. When the shell thickness reached 7 MLs, the reversibility demonstrated a certain decrease, which may be attributed to the misfit defects near the core/shell interface due to the thick shells exceeding the critical thickness.39 The probe with a shell thickness of 4 MLs, in particular, was noteworthy for its excellent optical properties; that is, the temperature switching operation could be reproduced continuously for at least 5 cycles without significant changes, demonstrating the probe's reversibility and dependability as an optical thermometer probe. Furthermore, we discussed the temperature reversibility of the luminescent material, where there is a continuous redshift of the PL peaks as the temperature increases, where the shift of the bandgap is described by the Varshni equation,40,41 and this shift phenomenon is reversible within a certain number of heating–cooling cycles. As the number of cycles increases, the reversibility of the film decreases, which means that some irreversible quenching occurs in the high temperature range. Irreversible quenching may result from the formation of permanent surface trap states, which may be related to structural changes. Structural changes at high temperatures may be due to lattice mismatches, which may generate interfacial strains and favor dislocations of atoms. Finally, the reversible quenching of quantum dots in the previous cycles may be the result of carrier thermal activation escaping to existing (surface) trap states and/or thermal activated creation of trap states which relax upon cooling.42 In addition, taking all the temperature response properties into account, the quantum dot thin film probe with a ZnS shell thickness of four monolayers appeared to be the preferred choice for the core–shell quantum dot-type temperature probes with relatively high fluorescence intensities, excellent linearity, a wide temperature applicability range, and the highest reversibility.
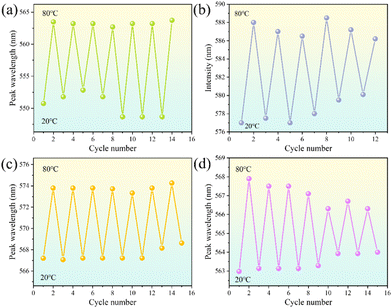 | ||
| Fig. 5 Temperature-dependent reversibility of a thin-film temperature detector for CdSe/ZnS with a shell thickness of (a) 0 ML, (b) 1 ML, (c) 4 MLs, and (d) 7 MLs. | ||
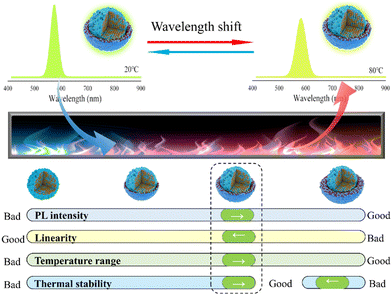
Conceivably, this CdSe/ZnS quantum dot probe has promising applications in mechanical, electrical, aerospace, and other areas of life (e.g., non-contact temperature testing on the rotating components of bearings). In summary, the shell thickness of the core–shell quantum dots had a modulating effect on multiple temperature sensing-related features of the quantum dots, and the temperature-dependent behavior of the QD film was the result of the combined effect of these sensing properties (Fig. 6). The spectrum of the quantum dot sensing probe redshifts with increasing temperature, which made temperature monitoring possible. In particular, the ZnS shell thickness functioned as a positive feedback on the fluorescence intensity and the relevant temperature range and a negative feedback on the quantum dot probe's linearity. The thickness of the shell will enhance the reversibility and reliability of the probe, but an overly thick shell will also reduce the reversibility and reliability of the probe. The thickening of the ZnS shell layer reduces the defects on the surface of the nuclear quantum dots and enhances the thermal stability and fluorescence intensity of the quantum dots. However, it is also worth noting that the excessively thick shell layer also leads to a decrease in the temperature reversibility of the quantum dots, which may be attributed to the decrease in the magnitude of the redshift of the quantum dots with the temperature as well as the formation of a large number of interfacial traps at the interface between the CdSe nucleus and the ZnS shell layer with the increase of the thickness of the shell layer.43 Thus, a complex trade-off was involved in controlling the ZnS shell thickness to achieve a relatively ideal temperature response performance. Besides, it is clear that stability and sensitivity are of great importance for the further advancement and development of CdSe/ZnS quantum dot temperature probes. However, the research and development of quantum dot-based thermometer materials has only just begun and enhancing the detection sensitivity of quantum dots as well as their tolerance and cycling characteristics at high temperatures has become an important technological challenge. The development of quantum dots combined with neural network (NN) or deep learning techniques for temperature measurements or the introduction of nanomaterials with matched energy levels could be high-potential solutions.
Conclusions
In this work, CdSe/ZnS quantum dot/POSS-based films with different shell thicknesses were fabricated successfully to investigate the effect of the ZnS shell on the temperature-sensing properties of quantum dots. The results demonstrated that the thickness of the ZnS shell has a significant modulating effect on the temperature performance of the quantum dot probe, which acts as a negative feedback on the linearity, a positive feedback on the fluorescence intensity and the applicable temperature range, and shows an increasing effect and then a decreasing effect on the reversibility and reliability of the probe. Thus, engineering of the shell is the linchpin in the development of CdSe/ZnS temperature probes with high performance. Among the four monolayers of quantum dot probes designed, we found that the QD film with a shell thickness of four monolayers (4 MLs) simultaneously possessed a high level of fluorescence intensity, monitorable temperature range, linearity, and test reversibility, demonstrating excellent potential for application in a high-performance temperature sensing platform. This work provides a well-established guideline for the design of quantum dot optical temperature probes based on the modulation of the shell.Author contributions
J. S. prepared the samples; J. S. performed the experiments and characterization; K. Y., A. P., and P. Z. conceived the project; K. Y. and A. P. analyzed the data; J. S. and P. Z. drafted the original manuscript; X. C., X. S. and C. S. reviewed and edited the original manuscript with contributions from all authors.Conflicts of interest
There are no conflicts to declare.Acknowledgements
This work was supported by the Science Center for Gas Turbine Project (no. P2023-B-I-002-001).References
- D. Wawrzynczyk, A. Bednarkiewicz, M. Nyk, W. Strek and M. Samoc, Nanoscale, 2012, 4, 6959–6961 RSC.
- Z. Lu, Y. Li, W. Qiu, A. L. Rogach and S. Nagl, ACS Appl. Mater. Interfaces, 2020, 12, 19805–19812 CrossRef CAS PubMed.
- S. Hajian, S. Ahmadi, D. Maddipatla, P. Eskandari, S. Masihi, M. Panahi, B. B. Narakathu, B. J. Bazuin and M. Z. Atashbar, 2022 IEEE International Conference on Flexible and Printable Sensors and Systems (FLEPS), 2022, 1–4 Search PubMed.
- T. M. Silveira, P. Pinho and N. B. Carvalho, IEEE Microw. Wirel. Compon. Lett., 2022, 32, 1239–1242 Search PubMed.
- S. Zheng, W. Chen, D. Tan, J. Zhou, Q. Guo, W. Jiang, C. Xu, X. Liu and J. Qiu, Nanoscale, 2014, 6, 5675–5679 RSC.
- I. E. Kolesnikov, D. V. Mamonova, M. A. Kurochkin, V. A. Medvedev, G. Bai and E. Y. Kolesnikov, J. Alloys Compd., 2023, 965, 171388 CrossRef CAS.
- X. Cai, Z. Niu, Y. Jiang, L. Ke, G. Xie, Z. Nie and Y. Zhang, Mater. Today Commun., 2023, 36, 106771 CrossRef CAS.
- Y. Y. Chen and A. W. Wood, Bioelectromagnetics, 2009, 30, 583–590 CrossRef CAS PubMed.
- P. Dwivedi, J. Li, P. Divyashree, K. Crawford and J. Thomas, MRS Commun., 2023, 13, 1156–1162 CrossRef CAS.
- G. Azzellino, F. S. Freyria, M. Nasilowski, M. G. Bawendi and V. Bulović, Adv. Mater. Technol., 2019, 4, 1800727 CrossRef CAS.
- S. Jun, J. Lee and E. Jang, ACS Nano, 2013, 7, 1472–1477 CrossRef CAS PubMed.
- C. Foy, L. Zhang, M. E. Trusheim, K. R. Bagnall, M. Walsh, E. N. Wang and D. R. Englund, ACS Appl. Mater. Interfaces, 2020, 12, 26525–26533 CrossRef CAS PubMed.
- P. Haro-González, L. Martínez-Maestro, I. R. Martín, J. García-Solé and D. Jaque, Small, 2012, 8, 2652–2658 CrossRef PubMed.
- M. Runowski, P. Woźny, N. Stopikowska, I. R. Martín, V. Lavín and S. Lis, ACS Appl. Mater. Interfaces, 2020, 12, 43933–43941 CrossRef CAS PubMed.
- J. Sun, P. Zhang, K. Yan, A. Pan, F. Chen, J. Hong, C. Zhao, X. Chen and W. Xiong, ACS Appl. Nano Mater., 2023, 6, 12087–12094 CrossRef CAS.
- X. Li, Y. Yu, J. Hong, Z. Feng, X. Guan, D. Chen and Z. Zheng, J. Lumin., 2020, 219, 116897 CrossRef CAS.
- H. Zhao, A. Vomiero and F. Rosei, Small, 2020, 16, 2000804 CrossRef CAS PubMed.
- Y. Iso, M. Eri, R. Hiroyoshi, K. Kano and T. Isobe, R. Soc. Open Sci., 2022, 9, 220475 CrossRef CAS PubMed.
- X. Liu and Y. Luo, Chin. J. Anal. Chem., 2014, 42, 1061–1069 CAS.
- M. Grabolle, J. Ziegler, A. Merkulov, T. Nann and U. Resch-Genger, Ann. N. Y. Acad. Sci., 2008, 1130, 235–241 CrossRef CAS PubMed.
- B. Gidwani, V. Sahu, S. S. Shukla, R. Pandey, V. Joshi, V. K. Jain and A. Vyas, J. Drug Delivery Sci. Technol., 2021, 61, 102308 CrossRef CAS.
- A. Mukherjee, Y. Shim and J. Myong Song, Biotechnol. J., 2016, 11, 31–42 CrossRef CAS PubMed.
- M. Guan, Y. Wu, Z. Kuang, Y. Guo, S. Xu and J. Zhang, J. Alloys Compd., 2023, 965, 171497 CrossRef CAS.
- R. Marin, A. Vivian, A. Skripka, A. Migliori, V. Morandi, F. Enrichi, F. Vetrone, P. Ceroni, C. Aprile and P. Canton, ACS Appl. Nano Mater., 2019, 2, 2426–2436 CrossRef CAS.
- G. Huang, C. Wang, X. Xu and Y. Cui, RSC Adv., 2016, 6, 58113–58117 RSC.
- K. Kniec, K. Ledwa, K. Maciejewska and L. Marciniak, Mater. Chem. Front., 2020, 4, 1697–1705 RSC.
- L. Tang, Y. Zhang, C. Liao, Y. Guo, Y. Lu, Y. Xia and Y. Liu, Sensors, 2022, 22, 8993 CrossRef CAS PubMed.
- S. Xiang, F. Wan, W. Chen, Z. Zhang, J. Wang and J. Lei, 2020 IEEE International Conference on High Voltage Engineering and Application (ICHVE), 2020, 1–4 Search PubMed.
- S. Li, K. Zhang, J.-M. Yang, L. Lin and H. Yang, Nano Lett., 2007, 7, 3102–3105 CrossRef CAS PubMed.
- G. W. Walker, V. C. Sundar, C. M. Rudzinski, A. W. Wun, M. G. Bawendi and D. G. Nocera, Appl. Phys. Lett., 2003, 83, 3555–3557 CrossRef CAS.
- K. J. Nordell, E. M. Boatman and G. C. Lisensky, J. Chem. Educ., 2005, 82, 1697 CrossRef.
- C. Ren, J. Hao, H. Chen, K. Wang and D. Wu, Appl. Surf. Sci., 2015, 353, 480–488 CrossRef CAS.
- B. Dong, L. Cao, G. Su and W. Liu, Chem. Commun., 2010, 46, 7331–7333 RSC.
- Y. Ma, L. He, L. Zhao and A. Pan, Soft Mater., 2016, 14, 253–263 CrossRef CAS.
- J. Yang, Q. Ma and P. Yang, Mater. Chem. Phys., 2012, 135, 486–492 CrossRef CAS.
- H. Li, J. Jiao, Q. Ye, Z. Wu, D. Luo and D. Xiong, J. Mater. Sci.: Mater. Electron., 2021, 32, 22024–22034 CrossRef CAS.
- X. Xia, Z. Liu, G. Du, Y. Li and M. Ma, J. Phys. Chem. C, 2010, 114, 13414–13420 CrossRef CAS.
- Z. Chen, H. Wang, C. Sui, G. Wei and Y. Geng, Chin. J. Lumin., 2014, 35(10), 1215–1220 CrossRef.
- J. Ko, B. G. Jeong, J. H. Chang, J. F. Joung, S.-Y. Yoon, D. C. Lee, S. Park, J. Huh, H. Yang, W. K. Bae, S. G. Jang and J. Bang, NPG Asia Mater., 2020, 12, 19 CrossRef CAS.
- D. Valerini, A. Cretí, M. Lomascolo, L. Manna, R. Cingolani and M. Anni, Phys. Rev. B: Condens. Matter Mater. Phys., 2005, 71, 235409 CrossRef.
- P. Jing, J. Zheng, M. Ikezawa, X. Liu, S. Lv, X. Kong, J. Zhao and Y. Masumoto, J. Phys. Chem. C, 2009, 113, 13545–13550 CrossRef CAS.
- Y. Zhao, C. Riemersma, F. Pietra, R. Koole, C. de Mello Donegá and A. Meijerink, ACS Nano, 2012, 6, 9058–9067 CrossRef CAS PubMed.
- M. Çadırcı, J. Lumin., 2020, 228, 117551 CrossRef.
Footnote |
| † Electronic supplementary information (ESI) available. See DOI: https://doi.org/10.1039/d4cp00099d |
| This journal is © the Owner Societies 2024 |

