 Open Access Article
Coalescence of AuPd nanoalloys in implicit environments†
Sofia
Zinzani
 and
Francesca
Baletto
 *
*
Università degli Studi di Milano – Dipartimento di Fisica, Via Celoria 16, Milano I-20133, Italy. E-mail: francesca.baletto@unimi.it
First published on 18th June 2024
Abstract
The optimal design of nanoparticles and nanoalloys arises from the control of their morphology which depends on the synthesis process they undergo. Coalescence is widely accepted as one of the most common synthetic mechanisms, and it occurs both in the liquid and gas phases. Coalescence is when two existing seeds collide and aggregate into a larger object. The resulting aggregate is expected to be far from the equilibrium isomer, i.e. the global minimum of the potential energy surface. While the coalescence of nanoparticles is well studied in a vacuum, sparse computational studies are available for the coalescence in an environment. Using molecular dynamics simulations, we study the coalescence of Au and Pd nanoseeds surrounded by an interacting environment. Comparing the initial stages of the coalescence in a vacuum and the presence of an interacting environment, we show that the formation kinetics strongly depends on the environment and on the size of the nanoalloy. Furthermore, we show that it is possible to tune the resulting nanoalloys’ surface chemical composition by changing their surrounding environment.
1 Introduction
Since Granqvist's work and the Japanese project Erato,1 interest in nanoparticles (NPs) has remained high as they have several technological applications. To cite a few, they are the building blocks of sensors, energy harvesting devices, catalysts, and randomly assembled neuromorphic systems.2–9 NPs are discrete objects with three dimensions below 100 nm, showing peculiar properties depending on their morphology. Among NPs, metallic nanoalloys (NAs) – referring to NPs made of two or more metals – possess unique chemophysical features.10–13 We define NP morphology as the combination of NA size, shape, chemical composition, and chemical ordering of the inner and surface layers.14,15 At the core of a rational design process, we must understand how NAs form, evolve, and agglomerate. Numerical methods can shed light on the atomistic processes and the kinetics of the formation/agglomeration processes, providing complementary information to experimental techniques.16–18 Generally speaking, the formation of NPs and NAs follows three possible paths: (i) by the subsequent deposition of atoms over an existing core – the so-called one-by-one growth;19 (ii) by coalescence – the sintering of two or more individual seeds; and (iii) annealing of a melted seed with a specific rate.20 During the coalescence and one-by-one growth processes, surface rearrangements are mainly driven by adatom diffusion and the formation of small islands. Annealing might be driven by pressure effects and the minimisation of the surface energy contribution. Among the three growth modes, coalescence plays a non-negligible role in gas aggregation cluster sources and liquid laser ablation. The latter is acquiring increasing importance in the large-scale production of Au-based NAs.21 In the modelling of coalescence, we appreciate considerable efforts in understanding the coalescence of Au-based NAs.22–25 Nonetheless, to our knowledge, those studies refer to coalescence in a perfect vacuum, although the surroundings may likely affect both NA stability, i.e., surface energy, and kinetics, i.e., adatom diffusion. Our interest is in understanding the effect of the environment around NAs during their formation process. We focus on Au–Pd NAs because of their role in heterogeneous thermal catalysis and electrocatalysis, as they exhibit superior activity and enhanced selectivity.26–29 The rationale for combining Au with Pd is the plasmonic and versatile character of the Au-seed with the strong catalytic flavour of Pd. Nano Au–Pd is employed in industrial processes such as hydrogen peroxide synthesis from H2 and O2, alcohol oxidation,30 vinyl acetate monomer synthesis,31 and formic acid de-hydrogenation.32Several studies report the complex energy landscape of Au–Pd.33,34 They show a tendency to form Au-rich surfaces, with a ball (Pd)–cup (Au) chemical ordering predicted at sizes up to 3 nm.35 We investigate and compare the kinetics of the coalescence of gold and palladium seeds over a few tens of ns both in a vacuum and in a plethora of environments. We use the Cortes-Huerto formalism36 to mimic a uniform medium around the NA, and we can tune the type and the strength of the interaction for each chemical species. We reveal that the surface chemical composition and the sintering process timescale depend significantly on the environment.
2 Methodology
We study the first steps of the coalescence of a 55-atom gold icosahedron (Ih), AuIh55, against a 55-atom Ih of palladium, PdIh55, leading to AuPd110. We, then, consider the coalescence of AuIh561 against a PdIh561. In Fig. 1, we report a pictorial representation of the coalescence process.To understand the effect of the medium, we vary the strength and the type of interaction between metal atoms and the environment (metal–environment interaction, MEI).
We keep the chemical composition equal to 50% and select the same initial geometrical shape, namely an icosahedron, for both seeds. The rationale behind our choice is that often noble and quasi-noble clusters in the 1–3 nm size-range shape as an Ih, which is the closest structure to a sphere.16
We perform classical molecular dynamics simulations using the open-source package LoDiS.37 The systems are thermalised using an Andersen thermostat with a frequency of 1011 Hz. We choose 400 K for the coalescence of AuIh5–PdIh55 and 600 K for AuIh561–PdIh561. At 600 K, the gold region in any AuPd110 almost melts, leading to more mixed and structurally disordered NA independent of the metal–environment interaction. As we want to address the effect of the environment before melting occurs, we do not comment on this case further.
Because we are interested in the first stages of the formation process, the trajectories are collected over t* ∈ (10![[thin space (1/6-em)]](https://www.rsc.org/images/entities/char_2009.gif) :
:![[thin space (1/6-em)]](https://www.rsc.org/images/entities/char_2009.gif) 20) ns, sampling the geometrical configuration every 0.01 ns. Preliminary simulations over 100 ns show that major structural changes occur in the first 20 ns. We average our results over four independent simulations. The Hamiltonian of our system is the sum of two contributions: the metal–metal interaction EM–Mi and the metal–environment EM–Ei, per atom i
20) ns, sampling the geometrical configuration every 0.01 ns. Preliminary simulations over 100 ns show that major structural changes occur in the first 20 ns. We average our results over four independent simulations. The Hamiltonian of our system is the sum of two contributions: the metal–metal interaction EM–Mi and the metal–environment EM–Ei, per atom i
 | (1) |
The metal–metal interaction is modelled according to the second moment approximation (SMA) in the tight-binding (TB) model,38 which is widely used to mimic the growth of NPs and NAs.39–41 In such a framework, the total energy of each atom i contains an attractive many-body term and a 2-body repulsive Born–Mayer term as
| Chemical | p | q | A [eV] | ξ [eV] |
|---|---|---|---|---|
| Au–Au | 10.139 | 4.033 | 0.2095 | 1.8153 |
| Pd–Pd | 11.0 | 3.794 | 0.1715 | 1.7019 |
| Au–Pd | 10.543 | 3.8862 | 0.1897 | 1.7536 |
We model the metal–environment interaction (MEI), EM–Ei, via the CortesHuerto, Goniakowski, Noguera formalism36,43,44 that approximates the presence of a non-inert, homogeneous environment, in terms of the number of unsaturated bonds of surface atoms i, concerning their positioning in bulk CNbulk = 12. The contribution to the atom i of chemical type α is represented by EM–Ei∈α,
| EM–Ei∈α = −ηα(CNbulk − CNi∈α)ρα, | (2) |
The strength of the interaction is tuned by the parameter ηα while ρα controls the type of interaction. For example, ρα = 1 stands for a pairwise interaction; while covalent interaction occurs when ρα < 1 and ρα > 1 is for strongly-interacting environments.36,44
For AuPd NAs, we have four parameters ρAu, ρPd, ηAu, ηPd to vary. The choice of ηα and ρα has been made by exploring different types of interactions. We identify 37 MEIs listed in Table S1 of the ESI.† Several of them identify poorly interacting environments and have a negligible effect on the kinetics of the coalescence process. Environments interacting with only one metal have a significant effect on both the nanoalloy energy and the kinetics of the coalescence process. When ρα = 1.5 and ηα exceeds 0.04 eV per atom, the interaction could approximate the presence of strongly interacting capping agents, as CTAB on Au or C2-polyol on Pd. Nonetheless, we should note that eqn (2) is a mean-field approximation without reproducing any specific environments.44 The choice for ηα and ρα could alter the relative stability of Miller-index surfaces, as it favours low coordinated Pd (Au) atoms. An estimate of the surface energy of a generic plane p, γp, can be approximated as  , with kα the energy per surface atom of a certain material. For ρα below or equal 1, the surface energy order is still (111) < (100) < (110). In any event, ηα below 0.04 eV per atom preserves the same order. Apart from the vacuum (set 0), we split MEIs into three groups.
• MEI-A: Only Au atoms interact with the environment, setting ηPd = 0 eV. ρAu is 0.5, 1.0, 1.5 and ηAu between 0.02 and 0.08 eV per atom, respectively.
• MEI-P: Only Pd atoms interact with the environment, ηAu = 0 eV. ρPd is 0.5, 1.0, 1.5 and ηPd equal to 0.02 eV per atom, 0.08 eV; ηPd = 0.06 eV with ρPd = 1.5.
• MEI-AP: Both Au and Pd atoms interact. We fix the Au values to (0.02 eV per atom, 0.5). Pd–E interactions vary with ρPd equal to 0.5, 0.75, 1.0, and 1.5 and ηPd = 0.02, 0.04, 0.06, 0.08, and 0.2 eV per atom.
For the coalescence of AuIh561–PdIh561 we select fewer MEIs among group P and AP: (i) P-group: ρPd = 1.5 and ηPd = 0.08 eV per atom; (ii) AP: ρPd is 0.5, 1.0, 1.5 and ηPd = 0.02 eV, and 0.08 eV per atom. Such reduction is motivated by the results obtained on the 110-atom system and to save computational time. In the main text, we discuss four cases: the vacuum, MEI-AP, MEI-P, and MEI-A. All the results from other environments are available in the ESI.†
2.1 Characterisation tools
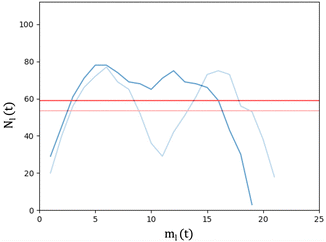
We analyse and characterise the classical MD trajectories using the Sapphire suite.45 We select a few descriptors to quantify the structural and chemical changes during the AuPd coalescence. Our aim is to show the effect of the environment on the kinetics of the coalescence and the surface chemical ordering. We focus on the evolution of the neck region, i.e., the spatial region where coalescence occurs, the MEI effect on NA shrinking, and any significant change in the surface chemical composition. We do not report any structural classification of the resulting NAs, but we have calculated common neighbour analysis signatures and patterns. where N is the total number of atoms and ml(t) is the number of layers at that time. If Nl(t) crosses Nexpectedl(t) more than twice, we conclude that a neck is still present, as visible from Fig. 2. We define the neck lifetime (LTN) as the first instant since Nexpectedl(t) is crossed only twice.
 | (3) |
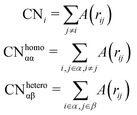
Counting homo and hetero pairs follows the introduction of a cut-off distance, Rcut, as the first minimum of the pair-distance distribution function, PDDF, as in Sapphire. We build the adjacency matrix from that cutoff, A(rij). A(rij) is set to 1 if the distance between atoms is less than the Rcut and 0 if it is greater. The atomic coordination number CNi, is then the sum over a row/column of A(rij)
 | (4) |
The PDDF is a crucial quantity to characterise the geometry of an NP, not only because it enables to define Rcut but also because a second peak of the PDDF in correspondence of the bulk lattice parameter (a0) stems for a geometrical order.46 We note that the maximum of the PDDF, Dmax, provides an estimate of the NP size.
The local atomic environment (LAE) counts the total number of hetero-bonds the atom i forms. LAE = 0 indicates no hetero-bonds; 1 ≥ LAE ≤ 6 shows a mild mixing tendency. Finally, LAE ≥ 9 indicates that β-atoms are encapsulated into a α-matrix. Counting the occurrence of each LAE provides a clear representation of the overall chemical of the NA. For example, a core–shell nanoalloy with a one-layer thick shell of α-atoms is characterised by a negligible value of LAEα = 0 but a high occurrence of 1 ≤ LAE ≤ 6, for both chemical species.
We evaluate the chemical radius of gyration Rαgyr, the radius of gyration referred to each chemical species. Rαgyr quantifies by which extent atoms are spread around their centre of mass (CoMw);
 | (5) |
 . In the ESI,† we provide the behaviour of the relative percentage PαS,rel, defined as the percentage of atoms of a given type with respect to its total number.
3 Results
We compare the initial stages of the coalescence in the vacuum and in a certain MEI. We clarify how the neck dynamics and the shrinking process are affected by the surroundings. In particular, we report whether the nanoalloy still presents an elongated shape or not after the observation time of 20 ns. The top row of Fig. 3 shows the evolution of the number of layers, ml(t), and their population, namely the number of atoms per each layer, Nl(t), for a typical run for AuIh55–PdIh55 and AuIh561–PdIh561. Time is set to zero when the two seeds collide, and the layers are counted from the Pd-seed. ml(t) decreases with time, and the effect is stronger at small sizes, where in just a few frames ml(t) almost halves. On the other hand, at 1122 atoms, only a few layers are lost over 20 ns. The resulting shape is still elongated, with a peak of the most populated layers located in the Pd region. In any event, we observe a smooth population behaviour per layer.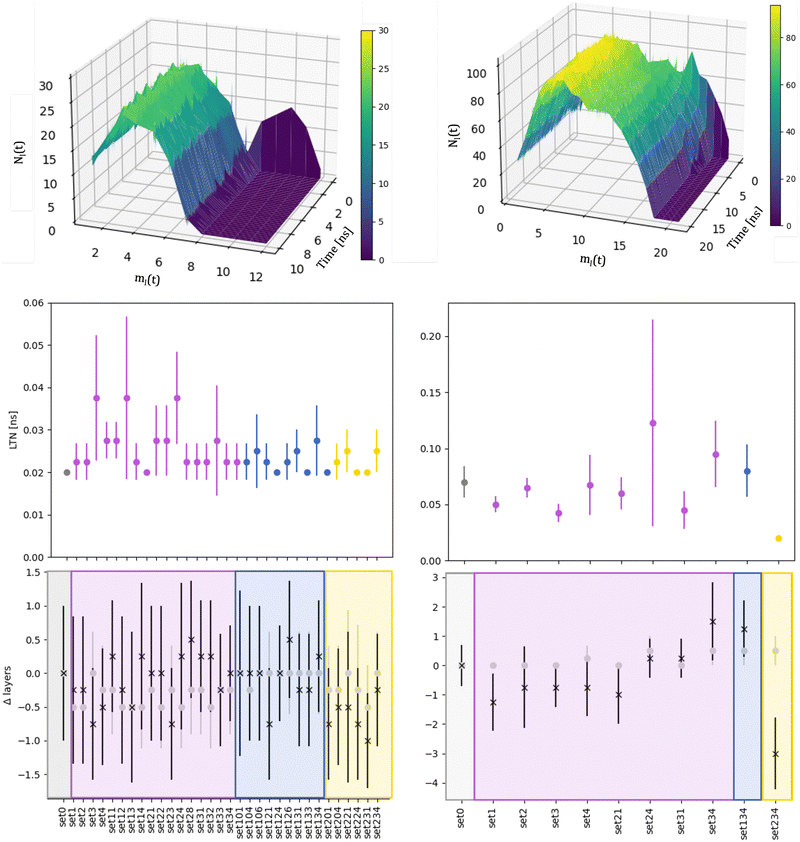 | ||
| Fig. 3 Left column refers to AuIh55–PdIh55 and right column to AuIh561–PdIh561 Top: Distribution of the number of atoms per layer with ρAu = 0.5, ρPd = 1.5, ηAu = 0.02 eV and ηPd = 0.8 eV, aka set 34. The colour gradient represents Nl(t). Middle: Mean value of the LTN and its standard deviation over independent simulations for each MEI. Vacuum, labelled as set0, is in grey. Bottom: Difference between the number of layers Nl(t) in an MEI and the vacuum (Δlayers) averaged over the independent simulations and their standard deviation at the initial time (grey full circles) and after 10 ns for AuIh55–PdIh55 and 20 ns for AuIh561–PdIh561 (black stars). For the middle and bottom rows, the x-axis labels the environment; MEIs are coloured in accordance with chemical species interactions: only Pd is blue (MEI-P); only Au is yellow (MEI-A); both Au and Pd interacting (MEI-AP) are violet. For a full description of the MEI, see Table S1 of the ESI.† | ||
The neck lifetime, LTN, middle row of 3, averages at 0.02 ns and always less than 0.06 ns for 110 atoms, while it ranges between 0.05 and 0.2 ns for 1122 atoms. At AuIh561–PdIh561, a mild effect due to the environment occurs with respect to the vacuum. A few MEIs, set24, set34, set134, increase the LTN but others, set1, set3, fasten it. See the ESI† for details on those MEIs.
To further characterise the shrinking process, we compare the difference between the number of layers for a certain MEI, ml(t)MEI, and the same quantity in a vacuum, ml(t)v, Δlayers = ml(t)MEI–ml(t)v, shown in Fig. 3 at the start (grey circles) of the coalescence and after 10 ns for AuIh55–PdIh55 and 20 ns for AuIh561–PdIh561 (black stars). We note that the environment influence is negligible when the two seeds come in contact, suggesting that our choice of the MEI mainly affects the surface diffusion and hence the dynamics of the shrinking process.
The dynamics of the aggregation of AuIh55 and PdIh55 remains almost unchanged, with Δlayers less than half of a layer. On the other hand, the shrinking process of AuIh561–PdIh561 depends on the surroundings, and it can be either fastened up or slowed, down. The interaction between Pd atoms and the environment becomes the critical factor, while the Au-environment interaction poorly affects the process. If Pd is strongly interacting, e.g. set34, set134, it is more likely to observe elongated shapes. However, if Pd interacts weakly (ρ = 0.5, set1, set2, set3, set4), the shape of the NA is more compact than in a vacuum after 20 ns.
To investigate whether the MEI affects the chemical ordering and surface composition, we compare various descriptors. Fig. 4 and 5 show the behaviour at 110 and 1122 atoms, respectively, in a vacuum and within the set34, a MEI-AP with Pd strongly interacting and Au weakly.
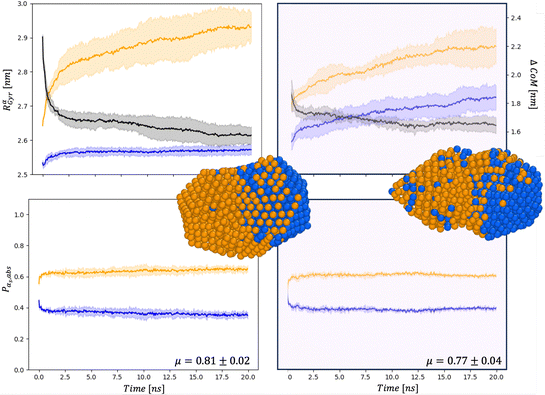 | ||
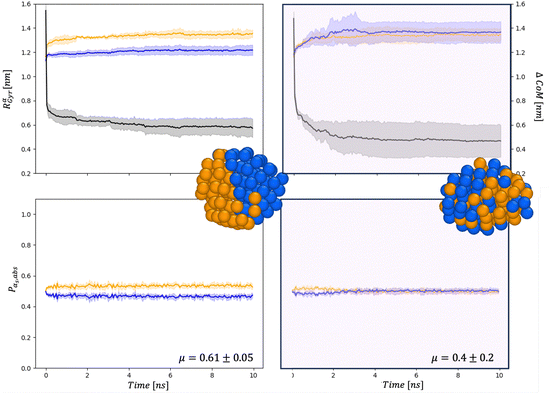
| Fig. 5 Chemical distribution for AuIh561–PdIh561 in a vacuum (right) and and in set34 (right) for Rαgyr in nm and ΔCoM in nm (top), and Pα,abs (bottom). Snapshots are taken after 20 ns with the same colour-coding as in Fig. 4. | ||
First, the chemical Rαgyr values are spread, mainly for Au. We further observe an increment of the radius of gyration per each chemical species after the collision. In a vacuum, the Pd-spread is tiny, and at small sizes, the chemical radii of gyration are similar to those in the MEI-AP. When RPdgyr ∼ RAugyr, or even longer, it is suggested that Pd atoms populate the external layer. For AuIh561–PdIh561, RPdgyr evolves at the same pace as RAugyr, indicating that both chemical species diffuse at the surface, while they were almost constant in a vacuum. The behaviour of RPdgyr together with the drop of ΔCoM suggests the presence of a partial core–shell chemical ordering in the AuPd in a vacuum. At the same time, we expect an intermixed surface layer in the MEI-AP.
Such a picture is confirmed by the relative abundance of surface atoms; see bottom rows of Fig. 4 and 5. For coalescence in a vacuum, the surface is mainly composed of Au atoms. Introducing a strongly interacting environment with Pd only, this chemical species tends to be at the surface, occupying about 50% of the surface area, Fig. 4, and a μ(t) of just 0.4, much less than 0.6 in a vacuum. The more we decrease the values of ρ and η, the more the μ tends to its value in a vacuum. Those results suggest that mildly interacting environments, both in terms of the type of interaction and the strength of the interaction, will poorly affect the dynamics of aggregation and the overall chemical stability of NAs. At larger sizes, the MEI affects the chemical ordering, although less pronounced. We believe this is only a kinetic effect, as shown by a more elongated shape. Full details of the μ(t) analysis are reported in the ESI† but they confirm a tendency to mix in the considered MEI-AP.
At 110 atoms, for set0 or the vacuum, we observe a predominance of ball–cup chemical ordering, where the Pd region is only partially covered by an Au-monolayer.
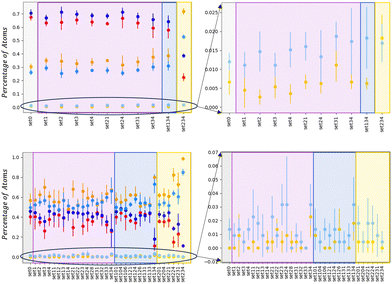
To be more quantitative, we analyse the local atomic environment (LAE) of each chemical species; see Fig. 6. For AuIh55PdIh55 after 10 ns in a vacuum, LAEAu = 0–40% < LAEAu ∈ (3–6) ∼ 55% and LAEPd = 0 ∼ LAEPd ∈ (3–6) ∼ 45%, while there is a negligible occurrence of Au and Pd atoms in a thoroughly mixed local environment (LAE ≥ 9). We note that LAEAu = 0 is always less or equal to LAEPd = 0, supporting the idea that Au atoms diffuse over Pd. Furthermore, a feature of LAEPd = 0 about 50% suggests that the Pd-seed is at least partially preserved. At the same time, but in a few cases, we observe individual Pd atoms embedded in an Au-matrix (LAEPd ≥ 9, see the inset panel of 6). For example, set34, set134, set 124, set224, set 231, set 234 suggest a different chemical ordering than the vacuum highlighted by a drop of each LAE = 0 together with an increment of the LAE ∈ (3–6). In particular, the LAE signatures for set234, namely LAE = 0 and LAE ≥ 9 both lower than 10% and LAE ∈ (3–6) above 80% for both chemical species suggest the formation of an Au-shell over a Pd-core. On the other hand, set34, set134, predict a stronger mixing with some Pd atoms dispersed in the Au matrix and a low LAE = 0 and a high LAE ∈ (3–6) for both chemical species.
At 1122, the effect of the MEI seems less evident because the simulation time is relatively shorter than at the 110 atoms. Nonetheless, there is a clear indication that set34, set134 behave differently than the vacuum. In particular, LAEPd ≥ 9 is almost 2%, and there is an increasing trend of mixing both at the surface and in the inside.
For both sizes and all the MEIs, a greater structural order emerges at the end of the simulation (10 ns for AuIh55–PdIh55 and 20 ns for AuIh561–PdIh561) to the time zero, set as the contact time of the two seeds, see PDDFs profiles in Fig. S4–S27 and S28 (ESI†). A deeper look indicates that the Pd region displays a geometrical order, even at small sizes, while the PDDF of the Au-part does not often show a peak at the lattice distance, Fig. S7–S9 (ESI†). In any event, the distance between the two seeds is similar and tends to be close to 1.6.
For AuIh561–PdIh561 in a vacuum, the Pd region tends to remain as the original icosahedral seed, with few Au atoms hopping over its surface. In contrast, in the presence of a strong MEI-P or a MEI-AP, an intermixing of Pd and Au is observed at the surface. As Pd strongly interacts with the surroundings, Pd atoms spread randomly around the surface layer, eventually clustering along low coordinated sites, i.e. edges, to balance the interaction with the implicit environment.
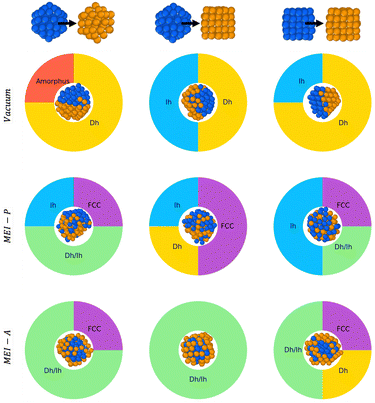
3.1 Effect of the initial seed-shape
Because the symmetry of nanoparticles is a critical parameter, we consider another initial seed for Au and Pd, namely a cuboctahedron (Co) of 55 atoms. The choice is motivated by the fact that Co has the same geometrical shell closure sequence as Ih. We therefore analyse the coalescence of AuIh55–PdIh55, AuCo55–PdIh55, and AuCo55–PdCo55. Fig. 7 summarises and compares all our findings. In a vacuum, Dh-nanoparticles are more likely to grow, albeit incompletely and asymmetrically, featuring a Janus-like chemical ordering, identified by a high percentage of both LAEAu = 0 and LAEPd = 0. When only Pd strongly interacts with the environment, the percentage of FCC is not negligible, alongside Dh and Ih-like geometry. The chemical ordering shows a tendency of Pd atoms to diffuse over gold, and the NA surface is Pd-rich. Conversely, when only Au interacts with the environment, the chemical ordering is core–shell, with a net tendency for incomplete Dh structures covered by an HCP island.3.2 Environment effect on the chemical ordering
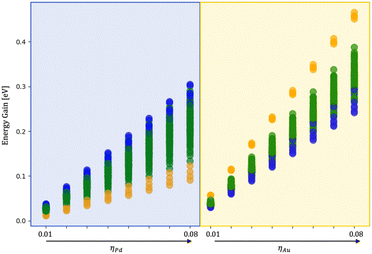
To quantify the effect of the environment, we have performed additional ionic relaxation of the 120 isomers obtained during the coalescence varying the MEI, namely only Pd and only Au interacting fixing ρ = 1.5 and η between 0.01 and 0.08 eV per atom.Fig. 8 shows the energy gain per atom following the embedding of the nanoalloy into a medium. The core–shell chemical ordering is the most favourable in a vacuum with Pd in the core. Such tendency is also evident during melting simulations starting from various configurations obtained during the coalescence. Indeed, even starting from a Janus-like order before melting, a 110-atom AuPd rearranges into an Au-shell over a Pd-core. However, a liquid nanodroplet always displays a randomly mixed chemical ordering with a mild tendency to have gold atoms at the surface.
4 Conclusions
Through classical molecular dynamics simulations, we model the coalescence of gold and palladium NPs, both in a vacuum and embedded in an environment, through an implicit model.We examine the coalescence of two 55-atom seeds, simulated at 400 K, and of two seeds of 561 atoms each, simulated at 600 K. We selected icosahedral seeds of the same size but we checked that similar results are available even for colliding two cuboctahedral seeds and Ih and Co. We tune the parameters of the interacting environment, obtaining more than 30 different scenarios. We focus on the initial steps of the coalescence process, and we provide insights into the kinetics of the process by looking at the different surface chemical compositions after 10–20 ns. We also comment on the temperature stability of various chemical orderings approaching the melting transition.
Our analysis reveals that the neck disappears in 0.06 ns for 110 atoms and 0.2 ns for 1122 atoms, independent of the type of surrounding. We can conclude that the environment poorly affects the neck's lifetime, which is mainly tuned to the seed size. Nonetheless, alongside the size effects, the surrounding interaction is critical concerning the rate of shrinking and the chemical ordering. Notably, when observing the process over 20 ns, specific environments induce a more compact shape than vacuum conditions. In contrast, others slow the process, leading to more elongated shapes than in a vacuum.
At small sizes, we observe a pronounced tendency towards the formation of ball-cup structures, in good agreement with global optimisation studies,47 where the innermost layers are mainly of Pd and gold atoms diffuse above the Pd seed to form a partial external shell. Nonetheless, when Pd interacts strongly with the environment, the preferential chemical ordering changes towards a mixed nanoalloy with both Pd and Au equally abundant at the NA surface, as in Fig. 8. We observe that Pd tends to keep its icosahedral shape at large sizes, and Au diffuses upon it. In strong MEI-AP and MEI-P, we reveal the formation of an intermixed external shell, with Au diffusing over Pd atoms and a few Pd atoms inter-diffusing in Au layers.
In conclusion, our research shows clearly that the presence of an interacting environment affects the kinetics of the coalescence process. In particular, we highlight the effect of the shrinking process on the surface chemical composition of AuPd NAs. Our work shows the need to include the environment when modelling the trajectory of NA formation and, hence, their chemophysical properties. Indeed, as the kinetics of shrinking are dependent on the size and environment, it is not obvious that extrapolation to other sizes or chemical compositions is necessary. Since Au-based nanoalloys play pivotal roles in plasmonic devices and nanocatalysis, variations in environmental conditions can lead to changes and rearrangements in their morphology, thereby influencing their optical response and possibly their performance. Additionally, strongly interacting environments with the dopant transition metals, but not Au, will impact the surface chemical composition of the NAs, affecting their catalytic activity.
Data availability
All the MD trajectories obtained are available on Unimi DATAVERSE?.Conflicts of interest
There are no conflicts to declare.Acknowledgements
S. Z. acknowledges the University of Milan and ISC srl for financially support of her PhD studentship (D. M. 118/2023 PNRR). S. Z. also thanks Dr Mirko Vanzan for kind support during the development of this work. Both authors acknowledge the computational resources provided by the INDACO Platform, a project of High Performance Computing at the Universitá degli Studi di Milano. FB ackwoledges the EPSRC netwrok CPLAS, grant number EP/W017075/1.References
- C. G. Granqvist and R. A. Buhrman, J. Appl. Phys., 1976, 47, 2200–2219 CrossRef CAS.
- V. Amendola, R. Pilot, M. Frasconi, O. M. Maragò and M. A. Iatì, J. Phys.: Condens. Matter, 2017, 29, 203002 CrossRef PubMed.
- A. Longato, M. Vanzan, E. Colusso, S. Corni and A. Martucci, Small, 2023, 19, 2205522 CrossRef CAS PubMed.
- Y. Yao, L. Zhang, E. Orgiu and P. Samorì, Adv. Mater., 2019, 31, 1900599 CrossRef PubMed.
- M. Vanzan, T. Cesca, B. Kalinic, C. Maurizio, G. Mattei and S. Corni, ACS Photonics, 2021, 8, 1364–1376 CrossRef CAS.
- M. Vanzan, G. Gil, D. Castaldo, P. Nordlander and S. Corni, Nano Lett., 2023, 23, 2719–2725 CrossRef CAS PubMed.
- S. Rasappa, H. Hulkkonen, L. Schulte, S. Ndoni, J. Reuna, T. Salminen and T. Niemi, J. Colloid Interface Sci., 2019, 534, 420–429 CrossRef CAS PubMed.
- P. Jena and A. Castleman, Nanoclusters, Elsevier, 2010, vol. 1, pp. 1–36 Search PubMed.
- Z. Chai, A. Childress and A. A. Busnaina, ACS Nano, 2022, 16, 17641–17686 CrossRef CAS PubMed.
- R. Ferrando, J. Jellinek and R. L. Johnston, Chem. Rev., 2008, 108, 845–910 CrossRef CAS PubMed.
- H. C. Zeng, ChemCatChem, 2020, 12, 5303–5311 CrossRef CAS.
- J. Mao, J. Li, J. Pei, Y. Liu, D. Wang and Y. Li, Nano Today, 2019, 26, 164–175 CrossRef CAS.
- A. Gentile, F. Ruffino and M. Grimaldi, Nanomaterials, 2016, 6, 110 CrossRef PubMed.
- R. L. Johnston, Atomic and Molecular Clusters, CRC Press, Location London, 1st edn, 2002 Search PubMed.
- R. Kevin, PhD thesis, Kings College London, 2019.
- F. Baletto, J. Phys.: Condens. Matter, 2019, 31, 113001 CrossRef PubMed.
- P. Grammatikopoulos, M. Sowwan and J. Kioseoglou, Adv. Theory Simul., 2019, 2, 1900013 CrossRef.
- M. Vanzan, R. M. Jones, S. Corni, R. D’Agosta and F. Baletto, Chem. Phys. Chem., 2022, 23, e202200035 CrossRef CAS PubMed.
- D. Escorcia-Díaz, S. García-Mora, L. Rendón-Castrillón, M. Ramírez-Carmona and C. Ocampo-López, Nanomaterials, 2023, 13, 2586 CrossRef PubMed.
- L. Pavan, F. Baletto and R. Novakovic, Phys. Chem. Chem. Phys., 2015, 17, 28364–28371 RSC.
- V. Amendola and M. Meneghetti, Phys. Chem. Chem. Phys., 2009, 11, 3805–3821 RSC.
- V. Coviello, D. Forrer, P. Canton and V. Amendola, Nanoscale, 2024, 16, 4745–4759 RSC.
- D. Nelli, M. Cerbelaud, R. Ferrando and C. Minnai, Nanoscale Adv., 2021, 3, 836–846 RSC.
- V. Coviello, D. Forrer and V. Amendola, Recent Developments in Plasmonic Alloy Nanoparticles: Synthesis, Modelling, Properties and Applications, 2022.
- N. Danielis, L. Vega, G. Fronzoni, M. Stener, A. Bruix and K. M. Neyman, J. Phys. Chem. C, 2021, 125, 17372–17384 CrossRef CAS PubMed.
- D. Astruc, Chem. Rev., 2020, 120, 461–463 CrossRef CAS PubMed.
- Z. C. C. Ozdil, O. Spalla, N. Menguy and F. Testard, J. Phys. Chem. C, 2019, 123, 25320–25330 CrossRef.
- R. Baez-Cruz, L. A. Baptista, S. Ntim, P. Manidurai, S. Espinoza, C. Ramanan, R. Cortes-Huerto and M. Sulpizi, J. Phys.: Condens. Matter, 2021, 33 Search PubMed.
- M. G. Spirin, S. B. Brichkin, E. S. Yushkov and V. F. Razumov, High Energy Chem., 2020, 54, 308–315 CrossRef CAS.
- B. E. Solsona, J. K. Edwards, P. Landon, A. F. Carley, A. Herzing, C. J. Kiely and G. J. Hutchings, Chem. Mater., 2006, 18, 2689–2695 CrossRef CAS.
- F. Calaza, M. Mahapatra, M. Neurock and W. T. Tysoe, J. Catal., 2014, 312, 37–45 CrossRef CAS.
- X. Sun, F. Li, Z. Wang, H. An, W. Xue, X. Zhao and Y. Wang, Chem. Eng. J., 2023, 475, 146143 CrossRef CAS.
- D. Astruc, Chem. Rev., 2020, 120, 461–463 CrossRef CAS PubMed.
- D. Nelli, C. Roncaglia, R. Ferrando and C. Minnai, J. Phys. Chem. Lett., 2021, 12, 4609–4615 CrossRef CAS PubMed.
- C. Fernández-Navarro and S. Mejía-Rosales, J. Phys. Chem. C, 2017, 121, 21658–21664 CrossRef.
- R. Cortes-Huerto, J. Goniakowski and C. Noguera, J. Chem. Phys., 2013, 138, 244706 CrossRef PubMed.
- F. Baletto, LoDis, 2021, https://github.com/kcl-tscm/LoDiS.
- V. Rosato, M. Guillope and B. Legrand, Philos. Mag. A, 1989, 59, 321–336 CrossRef.
- F. Baletto, C. Mottet and R. Ferrando, Phys. Rev. Lett., 2000, 84, 5544–5547 CrossRef CAS PubMed.
- M. Mariscal, S. Dassie and E. Leiva, J. Chem. Phys., 2005, 123, 184505 CrossRef PubMed.
- F. Baletto, R. Ferrando, A. Fortunelli, F. Montalenti and C. Mottet, J. Chem. Phys., 2002, 116, 3856–3863 CrossRef CAS.
- D. J. Borbón-González, A. Fortunelli, G. Barcaro, L. Sementa, R. L. Johnston and A. Posada-Amarillas, J. Phys. Chem. A, 2013, 117, 14261–14266 CrossRef PubMed.
- R. Cortes-Huerto, J. Goniakowski and C. Noguera, Phys. Chem. Chem. Phys., 2015, 17, 6305–6313 RSC.
- Z. C. Canbek, R. Cortes-Huerto, F. Testard, O. Spalla, S. Moldovan, O. Ersen, A. Wisnet, G. Wang, J. Goniakowski, C. Noguera and N. Menguy, Cryst. Growth Des., 2015, 15, 3637–3644 CrossRef CAS.
- M. Jones Robert, K. Rossi, C. Zeni, M. Vanzan, I. Vasiljevic, A. Santana-Bonilla and F. Baletto, Faraday Discuss., 2023, 242, 326–352 RSC.
- L. Delgado-Callico, K. Rossi, R. Pinto-Miles, P. Salzbrenner and F. Baletto, Nanoscale, 2021, 13, 1172–1180 RSC.
- H. Abdulhussein, I. Demiroglu and R. Johnston, Eur. Phys. J. B, 2018, 91, 34 CrossRef.
Footnote |
| † Electronic supplementary information (ESI) available: MEIs selected and supplementary characterization methods: PDDF in sapphire, AuIh55–PdIh55, and AuIh561–PdIh561. See DOI: https://doi.org/10.1039/d4cp00916a |
| This journal is © the Owner Societies 2024 |


