 Open Access Article
Exploring porous structures without crystals: advancements with pair distribution function in metal- and covalent organic frameworks
Ignacio
Romero-Muñiz
 a,
Edward
Loukopoulos
 a,
Ying
Xiong
a,
Félix
Zamora
a,
Ying
Xiong
a,
Félix
Zamora
 ab and
Ana E.
Platero-Prats
 *ab
*ab
aDepartamento de Química Inorgánica Facultad de Ciencias, Universidad Autónoma de Madrid, Campus de Cantoblanco, 28049 Madrid, Spain. E-mail: ana.platero@uam.es
bCondensed Matter Physics Center (IFIMAC), Universidad Autónoma de Madrid, Campus de Cantoblanco, 28049 Madrid, Spain
First published on 14th October 2024
Abstract
The pair distribution function (PDF) is a versatile characterisation tool in materials science, capable of retrieving atom–atom distances on a continuous scale (from a few angstroms to nanometres), without being restricted to crystalline samples. Typically, total scattering experiments are performed using high-energy synchrotron X-rays, neutrons or electrons to achieve a high atomic resolution in a short time. Recently, PDF analysis provides a powerful approach to target current characterisation challenges in the field of metal- and covalent organic frameworks. By identifying molecular interactions on the pore surfaces, tracking complex structural transformations involving disorder states, and elucidating nucleation and growth mechanisms, structural analysis using PDF has provided invaluable insights into these materials. This review article highlights the significance of PDF analysis in advancing our understanding of MOFs and COFs, paving the way for innovative applications and discoveries in porous materials research.
1. Introduction
Metal- and covalent organic frameworks (MOFs and COFs respectively) are well-established and distinct classes of porous materials. Their construction can be achieved by assembling multitopic molecules or building blocks into ordered three-dimensional arrays that present pores within. This strategy can involve purely organic building blocks, yielding COFs, or a combination of organic and inorganic building blocks, leading in this case to MOFs (Fig. 1).1,2Whether to find out the synthesis of a known material or to discover a new one, structural characterisation is a critical step in developing and designing MOF or COFs (and many other materials). Throughout this review, we discuss two scales of crystalline order: local-range and average-range. Since most of these materials are crystalline, they present a long-range order. In the context of structural characterization, this is very convenient, as the structure can be defined in terms of a spatial region restricted to a few tens of atoms, which generates the theoretically infinite crystal through symmetry operations. The portion of the structure that can be described as periodic is known as the average structure. However, this model does not satisfy all the characteristics of metal- and covalent organic frameworks, requiring an additional scale that considers non-periodic features such as vacancies, substitutions, atom displacements or chemical modifications.3–6 This is the local structure, and it is composed of two hierarchical orders.
First, we find the short-range, which describes the structural organisation associated with the first coordination sphere around a given origin atom (less than 5 Å).7 The parameters characterising the short-range order are the nearest-neighbour bond length distribution, the coordination number distribution and the chemical nature of the neighbour. Because chemistry occurs on a short-range scale, the correct understanding of this part of the materials becomes of paramount importance either for optimising chemical processes such as catalysis or gas capture, or to understand the functioning of unknown chemical processes. On the other hand, MOF and COF materials present non-periodic features beyond atom distances, approximately 5 to 20 Å approximately. One of the most important characteristics of this range is the pores, which in many cases are maintained even when the material lacks long-range order like in the case of liquid or amorphous MOFs. This range refers to the medium-range order.
Chemists, physicists, and materials scientists use a wide range of characterisation techniques. Given that crystallinity and permanent porosity are two typical characteristics in MOFs and COFs, powder X-ray diffraction and gas adsorption isotherms represent the most frequently analysed experiments. However, routine analysis of these two techniques alone cannot study our compounds' structure at the local range level. It is necessary to use techniques and analyses that allow us to obtain information not only on the average structure and long-range order but also on the chemical environment of the atoms of our material. Typically, it is required to combine information from different techniques to construct a reliable model that contains short- and medium-range features.8 The most popular techniques for this purpose in such materials are extended X-ray absorption fine structure (EXAFS)9 and solid-state nuclear magnetic resonance (ss-NMR).10,11 Both techniques exhibit an element-sensitive nature, offering precise chemical insights about the first coordination shell or nearest neighbours of a probe atom, that is, the short-range order.
Nevertheless, through non-standard analysis, numerous analytical techniques provide valuable information on the medium and short-range structure in such materials. This is the case for vibrational spectroscopy12,13 and diffraction measurements.14 The latter, specifically, encompasses information at the local level in the diffuse scattering signal. In this context, pair distribution function (PDF) analysis of the diffuse scattering obtained in total scattering experiments emerges as a valuable source of information at the local level.
1.1. PDF applied to the study of MOF and COF materials
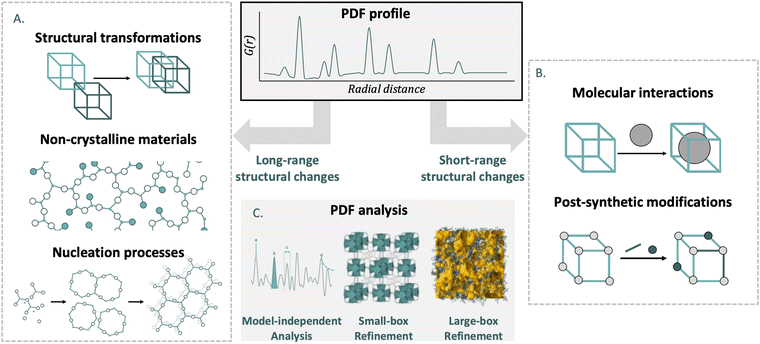
The main objective of this review is to bring the PDF analysis closer to chemists working on metal- and covalent organic frameworks. Although MOFs and COFs differ in structure and formation, their shared features—such as synthesis principles, chemical versatility, and characterization techniques—warrant their combined discussion. To highlight the importance of PDF analysis, we include a section introducing the technique and its ability to reveal valuable short- and medium-range structural information through scattering experiments. Our review offers: (i) a systematic overview of PDF analysis in MOFs, while also expanding this to COFs. (ii) A meta-analysis of issues addressed by PDF analysis in MOFs and COFs.In the main body of the article, we break down the problems tackled in recent years in MOF and COF chemistry from the perspective of PDF analysis. For this task, we have subdivided the research into two fields depending on the range in which the structure of the material is affected (Fig. 2).
In the first part, we discuss studies where PDF was used to investigate materials which have undergone changes in average structure. This includes different structural transformations such as topological transformations, crystalline-to-amorphous transitions, breathing phenomena, and stacking disorders. We also present how PDF has helped characterise amorphous and liquid materials, which lack long-range order but maintain certain structural features in the short- and medium-range. Finally, the nucleation process is presented, from nuclei without long-range order to crystals. In the second part, we describe the application of PDF to materials where the average structure is intact, but there are significant local deviations. This section details PDF studies of gas absorption processes, post-synthetic modifications, local transitions and defects.
At the end of the review, we incorporate a section where the main conclusions obtained from the use of PDF analysis in reticular materials is condensed. In addition to this, an outlook section is included, where we analyse the state of the art of PDF and how the expected advances can be key in solving old problems for MOF and COF materials. Additionally, we include an inverse analysis to see how PDF analysis can be useful in the new issues that arise within the field.
Overall, this review provides a timely update on MOF and COF advancements, emphasizing the critical role of PDF analysis in understanding local structure and dynamics, and aims to foster collaboration between the MOF/COF and PDF communities.
2. Pair distribution function in a nutshell
2.1. Obtaining the pair distribution function
 | (1) |
 | (2) |
λ = 2d![[thin space (1/6-em)]](https://www.rsc.org/images/entities/char_2009.gif) sin(θ) sin(θ) | (3) |
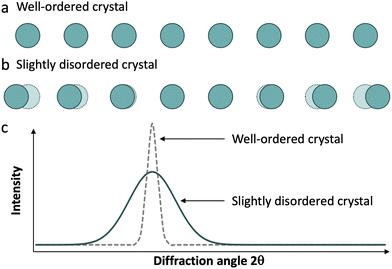
Real materials rarely display ideal structures, and their diffraction patterns usually contain both sharp Bragg peaks and a weak continuous background, referred to as diffuse scattering. This scattering derives from deviations from a perfectly regular array of identical units, including atomic thermal displacements, substitutional disorder (Laue monotonic scattering), and various other departures from ideality, collectively referred to as disorder (Fig. 3).16 Therefore, in a diffraction experiment, we obtain both scattering phenomena: Bragg reflections, which give us information about long-range order, and diffuse scattering, which give us information about local structure.
We can find a very common example of this behaviour in silicates. Amorphous silicates, like glasses, exhibit a broad signal, around 2θ = 27° using a Cu Kα source, typical of amorphous solids. On the other hand, when we analyse a crystalline silicate such as quartz, the diffractogram shows a set of sharp peaks of the corresponding phase. This occurs despite the Si–O local structure being almost the same in both types of materials.
Even though diffuse scattering is very useful in single crystal diffraction experiments,17,18 the direct analysis of it from powder diffraction data is very complex due to its low intensity compared to the Bragg reflections. In this context, the pair distribution function reduced from total scattering experiments becomes a very useful tool for obtaining information on both local- and long-range features in our materials.19
To measure a PDF, a diffraction experiment with certain peculiarities is required. To understand the difference between a standard powder X-ray diffraction (PXRD) experiment and one suitable for PDF reduction we must better understand the data obtained in the experiment. Firstly, the diffraction data intensity should be divided into various components according to the formula (4):
| IT = Icoh + Iinc + Imultiple + Ibackground | (4) |
The mathematical treatment of this background-removed total scattering intensity for obtaining a PDF is out of the scope of this review, but there are excellent examples in the literature.14,19–22 Nevertheless, we believe that a brief explanation of the data treatment is always a good starting point to establish the foundations for understanding the PDF technique. The next step in our data reduction, following background removal, is to obtain the normalized total scattering structure function, S(Q), using eqn (5):
 | (5) |
Once we have S(Q), the reduced total scattering structure function F(Q) can be calculated (eqn (6)).
| F(Q) = Q(S(Q) − 1) | (6) |
 | (7) |
We denote G(r) as the atomic pair distribution function or PDF. In summary, four steps are required to obtain G(r):
1. Measure the scattering intensity: the raw data from a scattering experiment gives the intensity I(Q) as a function of the scattering vector Q.
2. Compute total scattering structure function: from the measured intensity, one can determine the structure factor S(Q). This involves corrections for factors like background noise, instrument effects, and normalization by the number density ρ.
3. Derive reduced total scattering structure function: this can be performed using the relationship F(Q) = Q(S(Q) − 1).
4. Acquisition of the pair distribution function: transform F(Q) to the real-space pair distribution function G(r).
These experimental conditions lead to the first challenges in collecting scattering data for PDF analysis. The form factor (i.e. the strength with which one atom scatters X-rays) decreases with higher angles and shorter wavelengths (Fig. 4), making the scattering intensity weaker, and therefore more complicated to obtain good quality diffraction data at high |Q|.
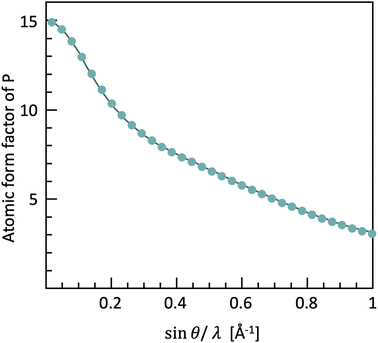 | ||
| Fig. 4 The form factor of phosphorus and carbon as a function of Q, based on the tabulated values in the International Tables for Crystallography vol. C. | ||
To mitigate these problems, we need a very coherent, brilliant and energetic X-ray source. Despite being possible to measure PDF with X-ray tubes with Ag or Mo anodes, synchrotron radiation sources meet these requirements providing high-quality total scattering data. Synchrotron radiation can be emitted using particle accelerators (known as synchrotrons or storage rings), where high-energy particles (typically electrons) are compelled to move in curved paths due to powerful magnetic fields. The high energy of the photon beam (typically above 60 keV for PDF experiments with a wavelength smaller than 0.2066 Å), allows the collection of high Q values. The high brilliance and coherency of the beam facilitate the acquisition of diffraction profiles with very high resolution even at high θ.
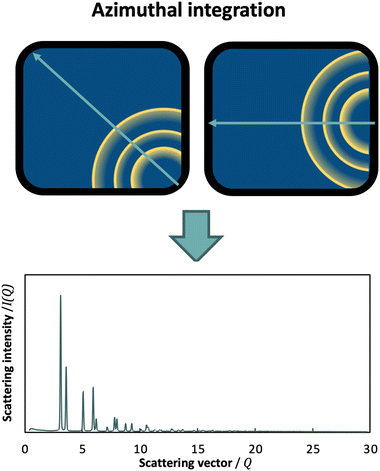
Another important advancement in total scattering data collection has been the use of area detectors,23 which allow for conduction of high-resolution, high-sensitivity and rapid time-resolved scattering experiments for PDF analysis. However, this generates 2D images of the diffraction data, and an azimuthal integration is therefore required (Fig. 5). In this case, the detector position plays a key role towards maximizing Q. By setting the detector so that the beam points towards a corner or a side, azimuthal integration over a broader range is achieved compared to placing it more centrally.
Up to this point, we can sum up some of the most important aspects when collecting data for X-ray PDF analysis:
1. Wavelength of incident radiation, which affects the scattering vector Q inversely: shorter λ leads to higher Q.
2. Scattering angle, which determines the magnitude of the scattering vector Q: higher angle results to higher Q.
3. The distance between the sample and the detector, which affects the range of Q values that can be measured: a shorter detector distance allows for higher Qmax and finer resolution in real space.
4. Detector size and resolution: they determine the accuracy and range of Q values that can be effectively measured.
Additionally, the typical best practices during acquisition of powder diffraction data also apply to total scattering data collection.24 Some of the most important aspects include: uniformly grinding the sample and ensuring correct rotation to prevent preferential orientation, compactly filling the capillary to facilitate background subtraction, among others.
Neutrons suitable for scattering experiments can be produced in two ways: inside a reactor or by spallation25 (Table 1). In the first case, a nuclear fission reactor produces monochromatic neutron beams. The energy and consequently wavelength of these neutrons are determined by the temperature of the moderator. For example, the temperature of the moderator at Institute Laue-Langevin (ILL) is around 2400 K, which yields a de Broglie wavelength of approximately 0.63 Å. On the other hand, spallation is a nuclear process initiated when high-energy protons, typically generated by stripping electrons from hydrogen atoms, are accelerated to near-light speeds in linear accelerators. These protons collide with a heavy nucleus (typically Hg or W) for enhanced cooling. Upon collision, the heavy nucleus undergoes fragmentation into smaller nuclei, releasing a multitude of free neutrons. This process forms the fundamental principle behind spallation neutron sources, which generate neutron pulses typically at frequencies in the tens of hertz range. Alternatively, facilities such as SINQ at the Paul Scherrer Institute (PSI)26 achieve a continuous neutron output by spallation using a steady stream of protons.
| Source/institute | Country |
|---|---|
| Spallation neutron sources | |
| CSNS/IHEP | China |
| JSNS/J-PARC | Japan |
| SNS/ORNL | USA |
| ISIS/RAL | United Kingdom |
| SINQ/PSI | Switzerland |
| Reactor neutron sources | |
| CARR/CIAE | China |
| CMRR/CAEP | China |
| OPAL/ANSTO | Australia |
| JRR-3M/JAERI | Japan |
| HANARO/KAERI | Korea |
| HFIR/ORNL | USA |
| HFR/ILL | France |
| FRM-II/MLZ | Germany |
Another peculiarity of neutron experiments compared to typical X-ray diffraction is the time-of-flight data collection. In a typical X-ray diffraction experiment, the distances between source, sample and detector are fixed, as is the wavelength of the incident radiation. This setup allows us to vary the angle of incident-scattered radiation, producing the classic intensity vs. 2θ diffraction profile using eqn (3). In contrast, neutron diffraction experiments offer flexibility in fixing the incident angle θ while varying the neutron wavelength λ. Due to the mass and de Broglie wavelength of neutrons, scanning λ and converting it to d-spacing allows us to obtain an intensity vs. d-spacing diffraction profile. The advantage of this method lies in fixing detectors at different angles to obtain a series of diffraction profiles with varying d-range/resolution ratios. This type of measurement, known as time-of-flight, is especially useful in spallation sources.
More distinctive features set neutrons apart from photons, including their remarkable penetration power. To illustrate, an iron plate of 1 cm would be penetrated by 35% of the neutrons, whereas it would be opaque to most photons with a wavelength of 1.54 Å.27 Perhaps the most interesting aspect, however, is that the intensity of the scattering varies irregularly with the atomic number Z of the scattering atom (Fig. 6). This property holds significant importance as neutron diffraction is sensitive to closely related atoms, such as Fe and Co, or even isotopes, scenarios where X-ray diffraction would encounter challenges. Additionally, the technique facilitates the analysis of light atoms such as Li or N, which makes it difficult to obtain reliable structural information using photons or electrons. Finally, the neutron scattering length b, serving as an analogue to form factors, remains independent of Q, maintaining constant scattering intensity at high Q values, making neutrons a very interesting scattering probe for this type of experiments.
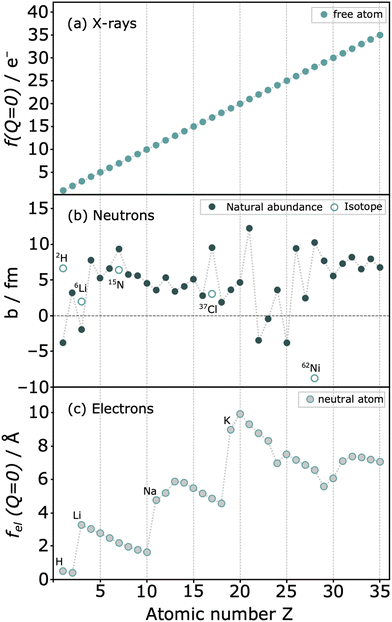 | ||
| Fig. 6 Relative scattering strength of (a) X-rays with structure factor f(Q = 0) (b) coherent neutron scattering lengths b for natural abundant elements and some isotopes (c) form factors for electrons of neutral atoms fel(Q = 0). Reproduced from ref. 22. | ||
Apart from X-rays and neutrons, electrons also serve as a scattering probe for PDF experiments. Electron diffraction (ED) and ePDF have garnered increased attention in recent years, primarily due to its feasibility within transmission electron microscopes equipped with specialized instrumentation.28,29 Compared to X-rays and neutrons, electrons interact more strongly with matter (Fig. 6), providing a stronger scattering signal and shorter data collection times, while requiring smaller sample amounts. Thus, even micrograms to nanograms of material can produce a signal without specialized equipment, allowing for high-quality PDF analysis using a conventional transmission electron microscope.30 The wavelength of the electron beam (in Å) is determined by the formula  where V is the applied voltage in volts. At a standard operating voltage of 100 kV, the wavelength associated with the electron is about 0.04 Å, significantly shorter than the wavelengths commonly used in normal synchrotrons (0.20–0.15 Å) or the standard Cu Kα source.
Another advantage of ED is its high spatial resolution. In conventional TEM, nanobeam electron diffraction (NBED) with a 3 nm spot size allows for local order analysis in amorphous and nanosized materials.31 With spherical aberration-corrected (Cs-corrected) TEM, NBED with a coherent electron beam smaller than 1 nm enables direct observation of the local-structure in amorphous materials.32 Recently, Sapnik et al. employed nanobeam scanning electron diffraction to map the crystalline and amorphous components of Fe-BTC and evaluate domain size. ePDF analysis was also conducted to investigate the spatially separated atomic structure within the amorphous matrix.33 This example exemplifies the potential application of ePDF for spatially resolved analysis of amorphous structures and nanostructures within MOFs.
When using electrons as scattering probes, certain considerations must be addressed. As a direct consequence of the stronger interactions with the sample compared to X-rays, high vacuum conditions are necessary to mitigate air scattering. Such experiments are usually performed in transmission electron microscopy setups. Additionally, electron-based techniques entail reduced penetration power and impose constrains on data collection (i.e. thin films in transmission or glancing-angle geometries). Notably, electrons are scattered much more strongly than X-rays, rendering even thin layers or short acquisition times suitable for obtaining high-quality diffraction data. Furthermore, scattered intensity decreases more rapidly than that of X-rays at higher Q values, resulting in observable diffraction within a small angular region.
2.2. Pair distribution function analysis
The PDFs can be analysed in different ways depending on the degree of depth to be achieved. In this section, we divide the analyses into two types that cover most of the cases described in the review. Firstly, we discuss model-independent analyses which do not require a clear structural model. Next, we look at analyses that require well-defined structural models. We talk about small-box or large-box refinements depending on the model type. Advantages and disadvantages of each method are summarized in Table 2.| Analysis type | Advantages | Disadvantages |
|---|---|---|
| Model independent | • Quickest method | • Limited information |
| • Access to fundamental parameters | • Difficult to establish a reliable structural model | |
| • Not specific software | • Requirement of no signal overlapping | |
| Small-box refinement | • Quick | • Need a starting periodic model |
| • No computation skills required | ||
| • Domain/nanoparticle size calculations | ||
| Large-box refinement | • Arbitrary degrees/types of disorder | • Requires computation skills |
| • Simultaneous fits to real and reciprocal space | • Resource intensive | |
| • Model uniqueness/need for restraints | ||
An important consideration that must be taken into account during PDF analysis is that the form factors for X-rays (f) are Q-dependent, as shown in eqn (5). Ideally, if this dependence could be completely represented, the real-space weights for X-rays would directly reflect the number of electrons per atom in the pair. However, in practice such a correction is challenging, especially for materials with multiple elements where the f(Q) differs from one kind of atom to another. To mitigate this issue, the Morningstar–Krutter–Warren approximation is commonly employed in PDF analysis,14 which considers the Q-dependence as a fixed number, using an average form factor with an effective number of electrons per atom. However, this approach presents notable shortcomings: (i) since the Q-dependence of the form factor varies with element, the approximation will be less accurate when measuring materials consisting of both heavy and light elements, potentially leading to misestimations. (ii) As detailed in the following equations and paragraphs, the form factor directly influences the shape of peaks (broadening) in the experimental PDF. The approximation could therefore present considerable limitations in retrieving accurate subtle structural information from the resulting model, if not taken into account. Recent attempts have been made to develop new PDF calculation algorithms that correctly represent Q-dependence.34,35 Nevertheless, this simplification has been widely implemented in software packages for PDF analysis34 and inevitably in most example cases described in later Sections.
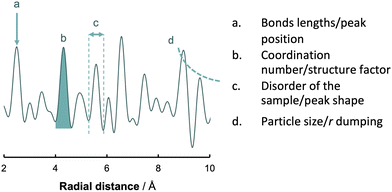 | ||
| Fig. 7 Basic analysis of a PDF. The four main features that characterize a PDF are the position of the peaks (a), the area of the peaks (b), peaks shape (c) and the fall off in intensity of G(r) (d). | ||
• Bonds lengths by the peak position
• Coordination number by curve area and structure factor
• Disorder of the sample by the peak shape
• Particle size by the fall off in intensity of G(r) with r
We can gather extensive information to construct or refine more intricate models by utilizing these four pillars. Similarly, analysing these parameters is critical for assessing the profile's quality and verifying the accuracy of the measurements before proceeding with more time-consuming analyses.
The relative position of peaks is one of the most straightforward approaches for directly analysing PDFs. Changes in the presence or absence of characteristic distances in an experiment can provide insights into the species in the system. For instance, Mohideen et al. used characteristic Cu⋯Cu distances to differentiate between various potential CuO nodes within a coordination polymer. The focal point of the article revolved around differences between Cu⋯Cu distances in a paddlewheel (2.6 Å) configuration against a proposed CuO tetrameric structure (2.9 and 3.4 Å).37
On the other hand, determination of the coordination number in a PDF can be achieved by introducing the radial distribution function (RDF), or R(r). This function is also a weighted histogram of interatomic distances within the material, however it is more closely related to the physical structure as the quantity R(r)dr provides the number of atoms in an annulus of thickness dr at distance r from another atom.14 It is related to G(r) through the following eqn (8), with ρ0 being the average atom number density:
| R(r) = G(r) − 4πr2ρ0 | (8) |
 | (9) |
Due to the inherent limitations of Morningstar–Krutter–Warren approximation of the form factors (f(Q)), some residual Q-dependent components remain and are included in the real-space PDF, potentially affecting the coordination number calculation. An exact PDF expression can be derived by adjusting the contributions from different atomic species to account for these effects. Instead of calculating G(r) directly in real space, the Debye equation can also be used to compute the scattering intensity of the model in reciprocal space, then transform into real space.22 This method ensures better alignment between the model and experimental data at the expense of increased computational cost. Nevertheless the Debye model, available in various software packages, can also incorporate instrument or sample-related effects in reciprocal space, providing a more accurate fit to experimental results.
Likewise, important information about the disorder of a system can be obtained by studying the peak shape and width in the measured PDF. Highly-ordered crystalline samples contain atoms with well-defined neighbours and interatomic distances, leading to sharp and distinct PDF peaks. On the other hand, the considerable atom motion in disordered systems gives rise to broader peaks due to the higher variability of the interatomic lengths.38 In a seminal study, Gilbert et al. reported among others the effect of static disorder in the PDF peak widths of mercaptoethanol-coated ZnS nanoparticles compared to bulk ZnS.39 All peaks in the former sample appeared to be broadened in an equal manner, attributed to random displacements of the atoms from the average positions.
One of the primary challenges associated with direct analysis of PDFs is the inherent complexity, especially in multicomponent systems. Given that the profile contains information on all distances presented in the material, accurately assigning all signals, or at least a significant portion of them, becomes a Herculean task. To address this issue, some researchers have turned to principal component analysis (PCA). PCA is a technique for reducing the amount of data when a correlation is present.40 Since a given structure correlates the signals in a PDF, a complex multicomponent profile can be simplified into a linear combination of the principal phases. This approach is particularly relevant in the study of phase or analyte evolution during structural transformations or chemical reactions. In situ experiments often generate highly complex profiles, making necessary analysis such as PCA to simplify and focus only on the signals of interest, without the necessity of building complicated theoretical models. This methodology has found applications in analysing the amorphous components of pharmaceuticals41,42 and the speciation of electrolytes during electrochemical lithiation of RuO2.43 Another popular method for reducing data complexity is nonnegative matrix factorization (NMF). NMF is a technique used to decompose a matrix into a reduced set of fundamental components. Like PCA, NMF seeks these components, but it enforces the restriction that both the components and their weights must be positive (nonnegative).44 This constraint is advantageous because many experimental signals, such as intensity measurements, are inherently positive. It ensures that NMF identifies solutions that are physically meaningful, particularly in intricate datasets such as pair distribution function.45,46
Another model-independent analysis that facilitates profile simplification is the application of differential PDF analysis (d-PDF). This method involves comparing two similar PDFs that exhibit subtle variations. Since quantifying these changes directly from the profiles can be challenging, subtracting one profile from other enables highlighting of differences through d-PDF. This approach simplifies the analysis of variations between PDFs, making it easier to discern their differences.47 Typically, a normalization factor (n) is necessary for accurate subtraction.
| d-PDF = Gi(r) − n·Gcontrol(r) | (10) |
The normalization factor is crucial for correcting variations in experimental conditions or instrumental responses that might affect the accuracy of quantitative measurements. This is especially important when working with porous materials, which can contain guest molecules with varying chemical compositions. By accounting for differences in sample thickness, beam intensity, or detector response, the normalization factor ensures that the measurements accurately reflect the intrinsic properties of the material. Standardizing measurements across different samples or experimental setups allows for reliable comparisons and accurate data interpretations, leading to precise scientific insights.
Differential analysis is even more important for the case of single crystal PDF analysis. The three-dimensional differential PDF (3D-ΔPDF) reveals details of the local-structure that differ from the average structure representation (i.e. constructed by symmetry operations).48 Positive values indicate higher probabilities of finding scattering densities separated by the corresponding vector, while negative values suggest lower probabilities relative to the average structure. For this reason, popularity of three-dimensional differential analysis (3D-ΔPDF) of single crystal diffuse scattering is increasing during the last years.49 Using 3D-ΔPDF for disorder analysis, rather than total 3D-PDF, offers advantages:50
• It reduces the number of peaks in PDF space by considering only interatomic vectors with distinct local and average structural properties. The higher contrast of 3D-ΔPDF maps enables qualitative and semi-quantitative assessments of disorder through visual inspection.
• The Bragg peaks are eliminated as their huge intensity means that uncertainty associate with their measurement would overwhelm the contribution from the diffuse scattering.
Despite their evident limitations, model-independent analyses are by far the fastest of all those presented here. They provide information on the fundamental structural parameters of our materials. Additionally, they hold great appeal to materials scientists due to their simplicity of analysis and the absence of necessity for specialised or complex software.
Small-box approaches are based on crystallographic models (up to hundreds of atoms), using unit cell symmetry to reduce the number of parameters. Based on this model PDF can be calculated by using the atomic position and form factor from the model (11):51,52
 | (11) |
• Peak position by atom positions and cell parameters
• Peak area by coordination number and occupancy
• Peak shape by atomic disorder and vibrations
• Peak damping by size and shape of the crystals
Additionally, a residual factor Rw can be calculated from the calculated and experimental profiles:
 | (12) |
The minimisation of this residual factor serves as approximate guide to the goodness of fit. However, there is no fixed value from which a refinement can be considered correct or incorrect.54
Small-box approaches for PDF refinement offer significant utility due to their relatively quick processing compared to large-box methods, providing quantitative insights into structural features such as distortions, occupancies, disorder or size and shape of the crystals. However, it also presents some limitations. Firstly, the requirement of a periodic model for refinement limits the applicability of small-box refinements to problems that exhibit average behaviour. Consequently, this fact dilutes one of the most attractive features of the PDF: the study of local and non-periodic phenomena.
Nonetheless, there remains potential for utilizing small-box periodic models for calculating particle sizes and shapes. The damping of the PDF serves as an indicator of particle size and crystallinity, making PDF a relevant technique for observing crystallization processes.55 Many such processes adhere to a nucleation-growth dynamic, during which small crystallites lacking long-range order are formed. Consequently, the corresponding PDF typically exhibits a histogram with minimal or no signal in the intermediate- and long-range. On the other hand, local-range features indicative of the chemical nature of the recently formed nuclei emerge early in the process. Capitalizing on this, many investigations have studied nucleation processes by analysing the r dumping of the profile. For instance, Page et al. analysed the size of gold nanoparticles through an analysis of the damping of the profile. Furthermore, they successfully correlated profile damping with nanoparticle size by comparing it with simulated profiles of cuboctahedral gold nanoparticles of various diameters.56 In a more recent study by S. Cooper et al., structural information for iron oxide nanoparticles was obtained by refining structural parameters against experimental PDFs using specific spinel models. Parameters such as unit cell size, atomic positions, and cation occupancy were refined. Several structural models, including magnetite and maghemite, were employed to describe the spinel iron oxide nanoparticles, enabling the determination of nanoparticle sizes and cation vacancies.57
Large-box refinements serve as a solution to address challenges associated with local and non-periodic models. These approaches allow the construction of models for disordered materials, including liquids and glasses, as well as non-periodic features, owing to the capacity to handle systems containing thousands of atoms. The main methods used in large-box approaches are Monte Carlo and molecular dynamics simulations.
Monte Carlo simulation is a mathematical method used to estimate the possible outcomes of an uncertain event. Within the context of model construction, it involves generating a set of new configurations by randomly moving single atoms, bonds or molecules depending on the constraints, MC(mn).58 Following this output, the potential energy of the new configuration, m′, is computed, and the algorithm evaluates whether the energy of the new configuration exceeds the one of the previous state or not. If the value is lower, the new configuration is accepted. In the opposite scenario, the algorithm calculates the related Boltzmann energy factor, which is compared to a random number between 0 and 1. The new configuration is rejected if the factor exceeds the random number, and the process continues from the initial state. If not, the iteration proceeds with the new configuration. This iterative approach allows for accepting movements that increase the energy of the system, thereby preventing convergence to a local minimum. In a typical Monte Carlo simulation, this process is repeated thousands of times to generate multiple probable outcomes.
On the other hand, molecular dynamics simulations utilize Newton's laws of motion at a given model system (obtained either by experimental or comparative modelling data) containing interacting particles such as atoms or molecules. The forces associated with each atom of the system can be described by the potential energy function known as force field; it includes contributions from bond lengths, angles and rotations, as well as Lennard-Jones potentials, van der Waals and electrostatic interactions.59 Once the force fields are calculated, Newtonian equations simulate the motion of the system over time. This generates a sequence of consecutive configurations with updated atom positions, revealing the dynamic evolution of the system. These configurations are evaluated to minimise the system's total energy, encompassing kinetic and potential energy.
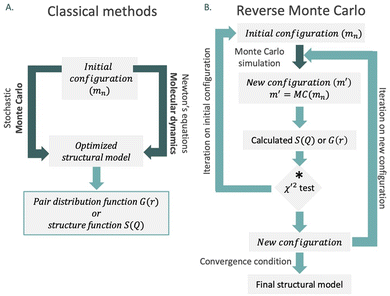
In 1988, McGreevy and Pusztai introduced an improved Monte Carlo methodology for studying of disordered structures reverse Monte Carlo calculations (RMC).60 This algorithm is centred on randomly modified configurations. However, unlike conventional Monte Carlo methods, the decision to accept the new configuration is based on the similarity between the calculated function with the experimental counterpart, assessed by a χ2-test:
 | (13) |
Consequently, the generated structure is refined based on experimentally obtained results, in contrast to traditional methods that independently create a structure without consideration of the model selection process (Fig. 8). An intriguing aspect of RMC calculations applied to PDF analyses is the ability to refine the model simultaneously using both real (by using G(r)), and reciprocal space (by using S(Q)). However, it's worth noting that since the model is refined against an experimental G(r) or S(Q), the inverse approach does not yield unique solutions. This is due to the rapid increase in the number of possible configurations as the system's size or the number of atoms increases. Therefore, it is possible that applying the same number of iterations in the RMC cycle to the same dataset could yield different models on two separate occasions.
3. Structural transformations
One of the main features of MOFs is the dynamic nature of their metal-linker bonds. This reversibility can be exploited for exploring the derivatization of MOFs. In this regard, myriad works have reported processes triggered by ligand release or exchange, including post-synthetic modifications, crystal-to-crystal and order–disorder phase transitions, among others. Some of these processes do not involve chemical modifications of the network but changes in coordination spheres, topology or pore apertures. These dynamic structural scenarios represent an opportunity for the PDF technique to demonstrate the precise information that can be retrieved at the atomic scale, especially without single crystals.3.1. Topological alterations
Analysing the network topology is a widely adopted strategy to streamline the description of MOFs and COFs, facilitating the design of novel materials.61 In this regard, the network's topology can undergo various alterations as a result of ligand exchange processes or be modified through defect engineering.62 In both scenarios, the PDF is expected to undergo changes in the local and average structure. Consequently, real space refinement emerges as a valuable tool for ascertaining or characterizing the newly generated topology.In 2017, Miera et al. described a topological transformation on bio-MOF-100 triggered by ligand exchange.63 The authors showed that bio-MOF-100 could be isolated as a dense phase by forcing fast nucleation by stirring the reaction mixture. PDF analysis performed on the two forms of bio-MOF-100 (the first reported lcs topology and the dense dia-c) showed that the local structure of both materials had very similar features in the local scale (Fig. 9). This evidence indicated that the structure of the Zn-adeninate clusters was the same in both phases. The functionalisation of the pristine dia-bio-MOF-100 by using solvent–ligand exchange methods resulted in the formation of the open-pore iridium-modified lcs-bio-MOF-100. Following this methodology, the authors prepared a set of open-pore bio-MOF-100 systems containing tailored amounts of a 2,2′-bipyridine dicarboxylate iridium complex.
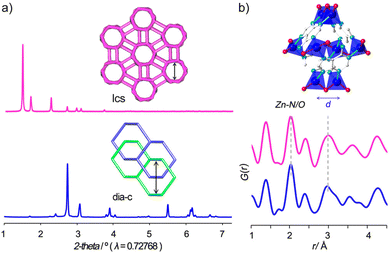 | ||
| Fig. 9 (a) PXRD data of the bio-MOF-100 frameworks showing the occurrence of different crystalline phases and (b) PDF data showing the presence of the characteristic local structure in both phases. Reproduced with permission from ref. 63. Copyright 2017 American Chemical Society. | ||
Defects can also be a switch to achieve topology and phase changes in reticular materials. In reticular chemistry, the term ‘defect’ often refers to what is known as vacancies in coordination chemistry. This encompasses node vacancies (missing-clusters), ligand vacancies (missing-linkers), or both concurrently. If these local defects within the lattice exhibit periodic ordering, they may lead to the emergence of a new lattice where such vacancies are no longer considered defects. For example, the presence of missing-linker, missing-cluster or both types of defects in a significant concentration result in the formation of different topologies in UiO-66: bcu (first reported), reo or scu as demonstrated by Liu et al.64 Cliffe et al. studied this phenomenon by assessing the occurrence of correlated defect nanoregions in Hf-UiO-66.65 Two material samples were explored: one defective (reo) and the other defect-free (fcu). The PDFs of both Hf-UiO-66 systems revealed the appearance of identical local structures, suggesting the loss of whole Hf6O4(OH)4 clusters in the defective materials. Alternatively, the presence of Hf atom vacancies within the clusters might have resulted in characteristic features in the local-range scale of the PDF data. The combination of the local structural information from PDF analyses and the analyses of superlattice reflections demonstrated the existence of short-range correlated alterations. Upon incorporation of missing-cluster defects, these changes within the UiO-66 framework have a periodicity in the lattice vector [100] that depends on the modulator-to-linker ratio used in the synthesis. Based on theoretical calculations and diffuse scattering experiments, the authors proposed a novel structural model of the defective Hf-UiO-66, which corroborated the presence of correlated disorder. The implication of such a structural phenomenon induced by local defects in materials function has opened new horizons in the field of MOF chemistry in recent years.66
3.2. Crystalline-to-amorphous transitions
Crystal-to-crystal transformations in MOFs often involve modifying building components by removal, addition, substitution, or alteration.67,68 While SCXRD helps to elucidate mechanisms in single-crystal-to-single-crystal transformations,69,70 most MOF changes lead to amorphous states or microcrystals. PXRD can be utilized for such cases by comparing profiles with known structures or conducting ab initio structural determination for single-crystal-to-microcrystal analysis. In contrast, crystal-to-amorphous transformations pose greater challenges, necessitating PDF analysis to obtain structural information essential for understanding the transition.In this context, Allan et al. investigated temperature-triggered conformational changes in MOFs.71 In this work, PDF analysis was applied to study the mechanism of single-crystal to disordered to single-crystal transformation occurring in a Cu-MOF51 with selective adsorption properties. The as-prepared form of this MOF (LT) underwent a phase transition upon hydration (HT). Both forms were determined by single-crystal diffraction. The authors applied PDF methods to better understand the structural mechanism of this transformation, which involves breaking several bonds and rearranging the framework. Thus, the PDF of the LT form has two main signals centred at 3.2 Å and at 7.3 Å associated to Cu–S and Cu⋯Cu distances, respectively. Upon heating, variable-temperature PDF studies showed two key temperatures to explain the transformation from LT to HT forms. The first change occurred at temperatures below 127 °C and was related to a change in the coordination mode of the sulfonate groups. When sulfonate changes had finished (ca. 177 °C), an alteration in the Cu⋯Cu distances was observed. The moving of the MOF layers can explain this evidence to form the dense HT phase characteristic of the dehydrated material. Additionally, the authors performed selective capture of NO in the HT framework. Surprisingly, when NO was loaded into the MOF, the PDF of the material resembled that of the intermediate phase observed at 127 °C. This evidence indicated a new change in the structure promoted by the strong binding of NO to the copper(II) sites rather than the presence of host–guest interactions. This structural mechanism could elegantly explain the selectivity of this material towards NO adsorption over other non-coordinating gases.
PDF analysis has also been applied to characterise amorphous-to-crystalline transitions in COFs by Stewart et al.72 In this work, the authors synthesized two amorphous materials (PATnC and PATCNnC) and converted them to two crystalline COFs: CAF-1 and CAF-2. PDF analysis was used to assess the structural transition from the amorphous into the crystalline phases. This study demonstrated that while both amorphous and crystalline phases present similar local structures up to ca. 12 Å, the crystalline phase shows atomic correlation up to ca. 38 Å (Fig. 10). The authors also proposed structural models for these COF materials based on Rietveld refinement of experimental synchrotron PDF and diffraction data.
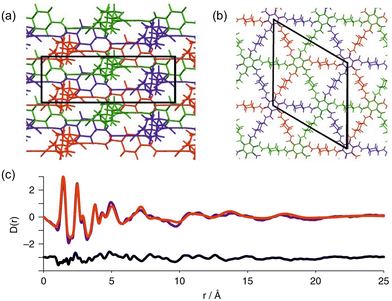 | ||
| Fig. 10 (a) Schematic diagrams of the three independent CAF-1 sheets in a unit cell looking down the a- and (b) c-axis respectively. (c) PDF refinement of the same ABC stacked structure as used for the Rietveld refinement, observed in purple, calculated in red and difference in black. Reproduced from ref. 72 with permission of Springer. | ||
3.3. Flexible MOFs
A class of MOFs known as flexible MOFs exhibits the unique ability to respond to a wide range of physical and chemical stimuli in a customizable manner through molecular design.73 These MOFs display intriguing properties, including phenomena such as breathing, which are influenced by host–guest interactions.74Following this line, Mulfort et al. reported the use of the PDF to assess ligand rotation into a two-fold catenated pillared MOF composed of Zn(II) paddle-wheel clusters.75 This particular MOF suffered deterioration after solvent evacuation, hindering structural analyses in terms of dynamic changes by traditional single crystal diffraction methods. Alternatively, the authors compared the PDFs of the pristine sample (i.e., before solvent evacuation), solvent evacuated and after CO2 capture. Interestingly, subtle changes in short-range of the MOF structure were identified after both activation by solvent removal and after CO2 capture (Fig. 11). After solvent-evacuation, the disappearance of two PDF signals centred at 5.5 and 6.7 Å attributed to pairs of Zn atoms and between Zn and the ortho-C of the benzene rings of one of the ligands was observed. This evidence suggested a torsional motion of the 4,4′,4′′,4′′′-benzene-1,2,4,5-tetrayl-tetrabenzoic acid. The authors hypothesized this dynamic torsion of the linker to be the activation mechanism in this MOF. An additional comparison of the PDF of the activated MOF to that of the sample after CO2 capture revealed that the linkers remained in a twisted conformation during adsorption/desorption. In particular, the intensity of a signal located around 19.5 Å linked to Zn⋯Zn distances diminished during solvent removal and then disappeared after CO2 capture. This change in the medium range of the PDF could not be explained by simple displacement of Zn atoms but by a structural transition of the bulk material. The conversion between interpenetrated and interwoven catenated geometries could explain these variations in the intermediate range scale since the Zn⋯Zn distances between the two interlocked networks are no longer fixed to a particular length.
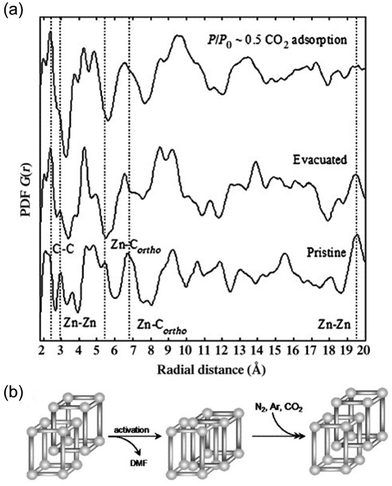 | ||
| Fig. 11 (a) PDF analysis of the pristine MOF evacuated (solvent-free) and CO2-treated material. Atomic pair correlations at around 2.5 Å belong to C–C, at about 3 Å to Zn–Zn, at about 5.5 Å and 6.7 Å to Zn–Cortho, and at about 19.5 Å to Zn–Zn. (b) Shift between interpenetrated and interwoven geometries of the pristine MOF upon activation and guest adsorption. Reproduced from ref. 75, with the permission of John Wiley & Sons. | ||
In a more recent work, Bueken et al. reported an isoreticular analogue of Zr-UiO-66 bearing the aliphatic trans-1,4-cyclohexanedicarboxylicacid (CDC) as a linker.76 The flexible nature of the CDC ligands conferred breathing behaviour to the network. (Fig. 12). The authors applied PDF analyses to better understand the structures of both water/ethanol-exchanged open-pore crystalline (ZrCDC) and the collapsed amorphous phase (ZrCDCcp). As typically seen for Zr-MOF, the PDFs obtained on the water-exchanged materials were dominated by the Zr⋯Zr distances within the framework. Based on PDF analyses, the authors demonstrated that the local structures (up to 8 Å) of these two MOF forms were virtually the same. This indicated that the structure of the Zr6O8 clusters did not suffer any alteration upon water evacuation. Furthermore, detailed analyses of the medium-range order (8–20 Å) corroborated the presence of similar distances between neighbouring clusters for both phases. The main differences in the PDFs of the two networks were seen in the long-range region, beyond 20 Å, where only two broad signals were present for the collapsed form. This indicated a loss of the long-range order beyond the first Zr6O8 neighbourhood, caused by the loss of water molecules.
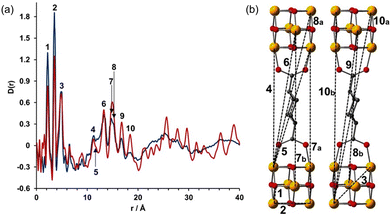 | ||
| Fig. 12 (a) PDF analyses of ethanol exchanged ZrCDC (red line) and ZrCDCcp (blue line). (b) Characteristic Zr⋯Zr distances are indicated in the PDF. O red, C gray, Zr yellow. Reproduced from ref. 76, with the permission of John Wiley & Sons. | ||
4. Non-crystalline and disordered materials
4.1. Amorphous and liquid MOFs
The PDF can be applied to study materials in amorphous and liquid phases since it does not presume periodicity, while Bragg diffraction analysis fails to describe these kinds of materials, and electron microscopy only gives local insights. In fact, one of the traditional research areas for PDF analyses is assessing the structure of inorganic glasses.77 Nowadays, the fast development of amorphous and liquid MOF materials has resulted in the widespread use of PDF in this field.In this regard, Bennett et al. studied the glassy behaviour of the zeolitic imidazole framework ZIF-4.78 The melting of the ZIFs structures has been previously reported in transition metal imidazolates.79–82 However, in this case, the a-ZIF phase is bounded by two crystalline phases: ZIF-4 and ZIF-zni. Variable temperature neutron scattering data were acquired at 300 °C for the desolvated ZIF-4 form, at 320 °C for the amorphous a-ZIF and at 400 °C for the new phase ZIF-zni. These scattering data were transformed into PDFs and compared to those obtained with X-ray and electron diffraction. This analysis showed an identical radial histogram up to 6 Å for the three ZIF systems, indicative of a common tetrahedral Zn coordination environment and bridging coordination motif of the imidazolate ions. On the other hand, the PDFs of these ZIFs exhibited some significant differences in the medium-range order. As expected for crystalline materials, ZIF-4 and ZIF-zni peaks persisted beyond 20 Å. However, in the case of the a-ZIF, the PDF was essentially featureless beyond 25 Å of radial distance. To better understand the structure of a-ZIF, the authors performed refinements of the total scattering data based on reverse Monte Carlo (RMC). The authors used a continuous random network (CRN) model of a-SiO2 to fit the experimental data obtained for a-ZIF. The objective of this approach was to corroborate the structural similarities between a-SiO2 and a-ZIF, although some differences (e.g. ring statistics) could not be fully identified using this method. This study demonstrated that the structure of a-ZIF can be described as truly amorphous with a crn structure rather than a disordered network with a crystal-like structure.
This concept of amorphous MOFs was expanded to related ZIF materials with different topologies (ZIF-1 and ZIF-3) and chemical compositions (Co-ZIF-4).83 Variable temperature PXRD was performed to characterize the transition temperatures of these new materials. The non-reversible amorphization started at 280 °C and by 300 °C all Bragg reflections had disappeared, reaching the new crystalline phase ZIF-zni at 400 °C. These new amorphous phases were studied by PDF analyses of X-ray total scattering data to ascertain that the connectivity was retained in their structures. These experiments showed that the local environments of these unsubstituted Zn- and Co-imidazolates remained unaltered upon thermal amorphization, as previously demonstrated for Zn-ZIF-4. RMC simulations were carried out on a continuous random network model for a-ZIF phases to fit the correlations in the medium range, showing identical structures in all cases. Interestingly, ZIFs containing substituted imidazolates as ZIF-8, -9, -11, -14, and ZIF-bqtz, did not show any sign of thermal transition nor amorphization. This evidence indicated that the structure of the ligand plays a key role in the thermal amorphization of ZIFs.
The intriguing phenomenon of MOF amorphization has been explored in other MOFs beyond the ZIF family, especially in Zr-based materials such as UiO-66 and MIL-140.84 In this work, Bennett et al. studied the ball-milling-induced amorphization of two benchmark Zr-MOFs: UiO-66, composed of discrete inorganic nodes, and MIL-140, composed of inorganic chains. The authors studied the loss of long-range order by PDF analyses, observing that the PDF signals linked to the Zr6O8 within UiO-66 remained unaltered during amorphization. On the contrary, PDF data of amorphous MIL-140 show significant changes in the signals linked to Zr⋯Zr distances (3.3–3.5 Å) (Fig. 13), together with alterations in the medium-range order.
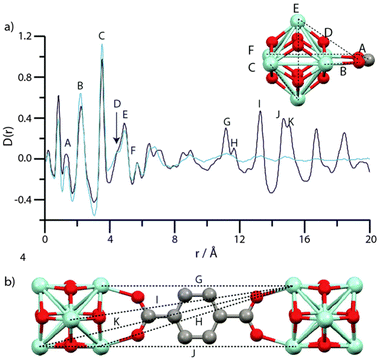 | ||
| Fig. 13 (a) PDF data for MIL-140B and the phase after milling. Labels of peaks below 8 Å correspond to the indicated correlations in the ZrO inorganic chains (inset). (b) Two ZrO chains linked by 2,6-ndc, and the distances corresponding to the longer r features in (a). (c) PDF data for MIL-140C and the phase after milling. Labels of peaks below 8 Å correspond to the indicated correlations in the ZrO inorganic chains, as in MIL-140B (inset). (d) Two ZrO chains linked by bpdc, and the distances corresponding to the longer r features in (a). Zr-light green, O-red, C-grey, H-omitted. Reproduced from ref. 84 with permission from the Royal Society of Chemistry. | ||
Another significant milestone in the field of non-crystalline MOF materials was achieved through the formation of hybrid glasses from MOF liquids, as reported by Bennett et al.85 Differential scan calorimetry experiments carried out on ZIF-4 reveal the co-existence of two glass phases after melting: low-density amorphous (LDA) and high-density amorphous (HDA). By comparison of the PDFs corresponding to ZIF-4, HDA the melt-quenched glass (MQG), the authors identified a similar correlation of these three systems in the short-range order. This demonstrates that the local structure of ZIF-4 is kept in both HDA and MQG (Fig. 14). A similar approach was applied to related MOFs with Zn(Im)2 compositions, such as TIF-4 and ZIF-62.86 Melt-quenched MOF glasses have huge potential in terms of applications: they have shown permanent porosity,87,88 and have been used to obtain MOF composites such as UiO-66/ag-ZIF-62 MIL-53/ag-ZIF-62.89
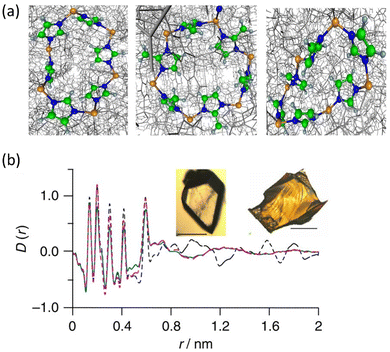 | ||
| Fig. 14 (a) The rings and imidazolate linkages in zeolitic topologies in the ordered structure of crystalline ZIF-4 (left) and ZIF-8 (centre), and the disordered HDA phase (right). Zn, orange; N, blue; C, green; and H, grey. (b) X-ray PDF data measured for the MQG (green), ZIF-4 (broken black) and the HDA phase (broken pink). Inset: Optical images of (left) ZIF-4 and (right) MQG. Scale bars, 100 mm. Reproduced from ref. 85 with permission of Springer. | ||
In 2017 Gaillac et al. studied the formation and structure of liquid MOFs.90 Obtaining a liquid MOF depends on the balance between the melting temperature and the decomposition temperature of the organic linkers. In this ground-breaking work, the authors reported an exhaustive characterization of melted ZIF-4 by combining situ variable temperature X-ray and ex situ neutron PDF experiments with modelling. The authors provided a detailed mechanism of MOF melting by applying first-principles molecular dynamics. A remarkable aspect of the liquid MOFs was that the local bonding environment of the Zr centres was retained, as demonstrated by neutron PDF experiments. This fact afforded permanent porosity in liquid MOFs, making them a platform for gas separation.91 The extension of the liquid MOF family has also allowed the preparation of blended liquid MOFs, such as the case of ZIF-4-Co/ZIF-62 (50/50).92 The understanding of liquid MOFs has also afforded the preparation of glasses composed of MOFs that do not melt, such as ZIF-8 and Co-bis(acetamide).93
PDF analyses, in combination with spectroscopic techniques and modelling, have also been utilized to elucidate the nature of metal–oxo nodes in porous materials, as shown by Nguyen et al.94 In this work, five different materials composed of Co4O4 nodes, which are active in oxygen-evolution reaction, are discussed: two based on carboxylate tritopic ligands, and three based on tritopic pyridine ligands. In this case, PDF was a critical characterization technique to suggest a structural model due to the lack of long-range periodicity within the materials.
4.2. Thermal treatment of MOFs and MOF composites
Composites derived from MOFs have attracted more and more attention in recent years because of the intriguing properties that can arise from synergistic effects between two or more chemical components. However, the complexity of the structural analyses of amorphous composites has hindered, so far, an accurate understanding of their atomic structures. In this context, PDF analysis is ideal for studying complex phases and interfaces and has provided fruitful insights into the field.Nanocasting has been applied to MOFs to obtain a variety of nanostructured materials.95 Malonzo et al. reported the formation of a zirconia@silica composite by nanocasting of NU-1000 and subsequent calcination of the linker.96 The structures of both materials, SiO2@NU-1000 (nanocast material) and Zr6@SiO2 (nanocast material after calcination), were evaluated using d-PDF analyses. These analyses identified the presence of Zr–O (2.14 Å) and Zr⋯Zr (3.47 Å) distances characteristic of Zr oxides. Rietveld analyses of PDF data were applied to identify the presence of small cubic ZrO2 clusters of approximately 0.6 nm size. Additionally, a minor component of bigger ZrO2 nanoparticles (approximately 3 nm) was also found to be present on the pore surface. Related silica nanocasting methods have also been adapted to other MOFs, such as DUT-9 and (Ce)UiO-66, to incorporate pentanickel and hexacerium oxide-based clusters.95 Beyond silica, these authors also explored the potential of the nanocasting technique for the preparation of nanostructured MOF composites based on TiO2 or carbon.97
Direct calcination of MOFs has been demonstrated to be an excellent methodology for the preparation of complex metal oxides. In 2019, Day et al. reported the preparation of a mixed-valence Fe-doped carbon by thermal decomposition of Fe-PCN-250 under different gas flow environments (air, nitrogen and D2O)98 (Fig. 15). The carbon–NP composites were studied by combining PDF of neutron scattering data. The neutron PDFs showed contributions of both graphite and Fe oxides, as demonstrated by Rietveld analyses. While the carbon ordering is very similar under the three conditions studied, the authors showed that the carbon content, magnetic behaviour, and oxidation state of the Fe oxide species within the samples, are very different depending on calcination. Magnetic PDF (mPDF)99 can be obtained from neutron scattering cross-section data and reveals both short- and long-range magnetic correlations in real space within a material. By analysing the residual mPDF of Fe-PCN-250 calcined in air, the presence of magnetic Fe(III) oxide was identified. Under a D2O atmosphere, a mixture of Fe(III) and Fe(II) oxides was observed. mPDF data showed the occurrence of an inverse spinel structure of Fe(II) and Fe(III), where the tetrahedral Fe(III) sites align antiferromagnetically with the octahedral Fe(II)–Fe(III) sites. Additionally, the carbon content of the sample increases from 0.16% w/w (air calcined) to a 31.6%. Finally, the N2 calcined sample showed both Fe structures, that is Fe(III) oxide and Fe(II)/Fe(III) mixed-oxides.
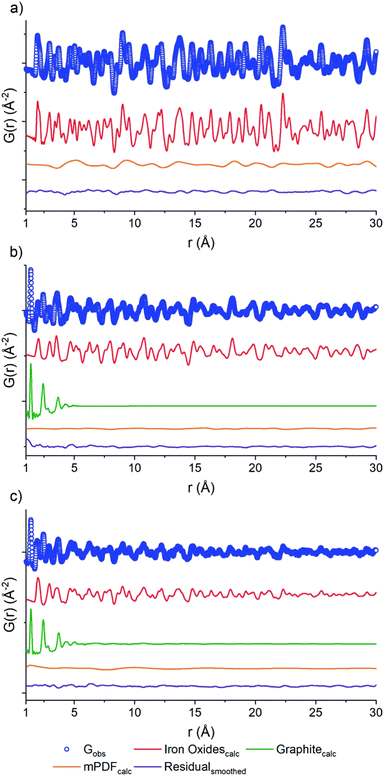 | ||
| Fig. 15 PDF of the neutron scattering data for PCN-250 calcined under (a) air, (b) D2O, (c) N2. Each data set shows raw data (blue circles), the oxide fit (red line), the graphite fit (green line), the mPDF fit (orange line), with the final difference curve shown below (purple line). Reproduced from ref. 98 with permission from the Royal Society of Chemistry. | ||
4.3. Stacking disorder
The main structural characterization challenge of COF materials arises from their limited crystallinity, which typically hinders the use of conventional crystallographic approaches. This is especially true in those systems based on stacked layers (2D-COFs). In this context, PDF is a suitable technique for addressing structural studies of these materials without having single crystals.Ascherl et al. were the pioneers in applying a PDF study to COFs, thereby marking a significant milestone in this research field.100 The authors developed a strategy for preventing stacking faults and dislocations during the COF growth by tuning the core unit of the building block. This method allowed the COF building blocks to adopt a propeller shape, guiding the building blocks to a very ordered stacking process. In this case, experimental and simulated PDF were compared to study the structural models proposed for the COF.
Pütz et al. reported another interesting example of PDF analyses to target stacking disorder in 2D-COFs.101 This type of stacking analysis was previously performed on other layered porous materials by Schlomberg et al., providing interesting insights into the stacking conformation of layered materials.102 In this work, the authors synthesized an imine-linked 2D-COF under room temperature (low temperature, LT) and at 120 °C (high temperature, HT). They proposed four structural models to explain plausible stacking scenarios: eclipsed, randomly off-set, unidirectional slip stacked, and alternating slip stacked (Fig. 16). Interestingly, further insight into the latter case (LT material) was performed using PDF analysis, demonstrating the appearance of a complex disordered stacking. Thus, when the PDF of the LT material was fitted against different models (eclipsed, unidirectional and randomly slip-stacked), a good fit of the PDF beyond 10 Å was only found for the randomly slip-stacked conformation. The authors further complemented the PDF analyses with stacking fault simulations, thereby providing a good model for a random off-set COF. This stacking was in agreement with the PDF data of the LT system. In particular, a model with a lateral off-set of 1.6 Å improved the fit quality by explaining the PDF signals of these COF materials seen in the intermediate range order (above 10 Å).
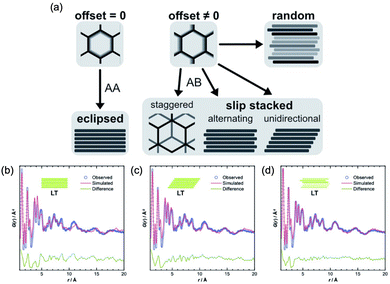 | ||
| Fig. 16 (a) Different stacking modes on an imine-linked 2D-COF, depending on magnitude and direction of off-set between neighbouring layers, and best obtained PDF fits from structure refinements of LT, assuming (b) eclipsed, (c) unidirectionally slipped, or (d) randomly slipped stacking. Reproduced from ref. 101 with permission of the Royal Society of Chemistry. | ||
This interesting approach to assessing the interlayer stacking within COF materials by applying PDF analyses has also been applied to amine-linked systems. In subsequent work, Grunenberg et al. studied the reduction of imine bonds to amine within a family of COFs.103 Using high energy synchrotron X-ray total scattering data, the authors determined the PDF of the imine COF PI-3 (1,3,5-triformyl benzene-4,4′,4′′-(1,3,5-triazine-2,4,6-triyl)trianiline) and its reduced form rPI-3. The PDFs for this COF, before and after reduction, were very similar in the medium range (5 Å to 20 Å) and exhibited two primary oscillations: one of high frequency associated with the ordering of the stacked layers and a low frequency that corresponded to the pore apertures. Additionally, the occurrence of an amorphous phase upon reduction of the COF by protonation of the amines was also studied by PDF analyses. While ss-NMR, FTIR and other complementary characterisation techniques were used to study the chemical composition of the disordered COF phase, they failed to elucidate the structural differences between the amorphous and the crystalline networks. Interestingly, the PDFs of both crystalline and amorphous phases for the reduced COF showed similar local structures. However, from 12 Å onwards, the PDF of the amorphous phase turned flat, in agreement with the lack of order among stacked layers. Finally, the authors compared the specific stacking offset for each material, which are 1.0, 1.2, and 3.3 Å for the imine-linked PI-3, the amine-linked rPI-3 and the disordered rPI-3 respectively. This structural feature determined by PDF analyses explained the differences and similarities in textural properties observed for this COF upon reducing its imine linkages to amines.
4.4. Node transitions and defects
In 2016, Platero-Prats et al. reported a structural transition of the Zr6O8 nodes within Zr-MOFs that could be tracked by PDF analyses.104 Variable-temperature PDF data collected on NU-1000 showed significant changes in the correlations linked to the Zr6O8 nodes upon heating up to ca. 130 °C. In particular, the original Zr⋯Zr distances at 3.5 Å linked to the octahedral Zr6O8 nodes split into new distances at 3.3 and 3.7 Å (Fig. 17). Additionally, the distance related to Zr–O bonds shifted to shorter values, indicating a contraction. The authors combined PDF data with computational studies to unveil that the metal oxide clusters, acting as nodes within MOFs, possess the ability to undergo localized structural transitions. Remarkably, these transitions occur without affecting the overall lattice symmetry over extended distances. Such structural alterations parallel those observed in bulk metal oxides at elevated temperatures. Notably, these transitions occur under significantly milder conditions (T < 150 °C), including conditions commonly encountered in practical MOF applications.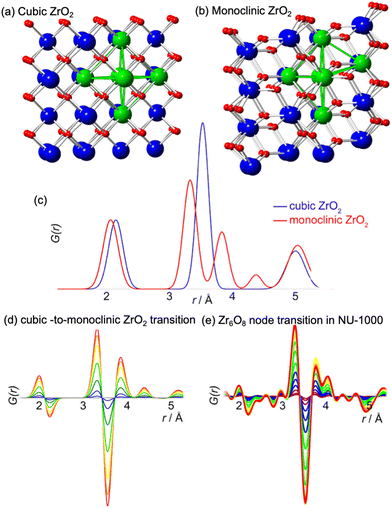 | ||
| Fig. 17 Representations of the structures of (a) cubic and (b) monoclinic ZrO2 and (c) the corresponding PDFs simulated for these bulk phases. Red: oxygen atoms, blue: Zr atoms, green: symmetric and distorted Zr6 octahedra. (d) d-PDFs simulating the cubic-to-monoclinic transition in bulk ZrO2, closely match the differential PDFs obtained experimentally for the Zr6 node distortion transition in Zr-NU-1000. Reproduced with permission from ref. 104. Copyright 2016 American Chemical Society. | ||
The structural differences between PCN-224, PCN-221 and MOF-525 have been recently addressed by Koschnick et al.105 The inorganic clusters in PCN-221 were originally described as Zr8O6 clusters. However, by combining different atomic resolution techniques, the authors revealed the true nature of this inorganic building unit. Contrary to the original model, the clusters in PCN-221 are better described by the superposition of four disordered Zr6(μ3-O)4(μ3-OH)4 metal clusters. To corroborate this theory, the authors prepared a set of different PCN-MOFs starting from other Zr precursors (e.g. ZrCl4, ZrOCl2, and pre-formed Zr6–oxo–benzoate clusters). PDF experiments were performed to assess the structural features of the inorganic clusters present in each sample. Surprisingly, in all cases, the PDF signals linked to the Zr–O and Zr⋯Zr distances match with those expected for a Zr6(μ3-O)4(μ3-OH)4 cluster. The authors also performed a detailed study based 1H-, 13C- and 15N-ss-NMR spectroscopy to understand the coordination environment of the Zr6 clusters in PCN materials. Furthermore, single crystal diffraction experiments PCN-224 evidenced an electron density pattern that can be explained by overlapping four Zr6 clusters (Fig. 18). The authors proposed a disordered structural model for PCN-224 that would ex plain the observed discrepancies with the former PCN-221 model.
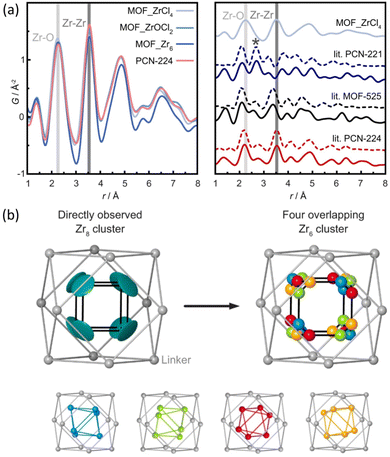 | ||
| Fig. 18 (a) Experimental pair distribution functions (PDFs) of MOF_ZrCl4, MOF_ZrOCl2, MOF_Zr6, and experimental PCN-224 (left). The star highlights the Zr⋯Zr distance of 2.69 Å in PCN-221 (right). (b) Zr8 cluster (teal) determined from SCXRD data, with a flat disk-shaped ellipsoid of the Zr atom (left) and a truncated cube created by the overlap of four different orientations of Zr6O4(OH)4 clusters (blue, green, red, and orange), each occupied by 25% (right). Reproduced from ref. 105 with permission of Springer. | ||
5. Nucleation and growth mechanisms
The PDF is an interesting tool to address the local structure of the metal nodes in MOFs, even at the early stages of crystallization. Through such an approach, a series of metal–oxo clusters were studied by Sava Gallis et al. in a study related to the use of lanthanide MOFs for bioimaging applications.106 The authors prepared a set of isostructural MOFs containing hexanuclear nodes of Eu, Nd, Yb, Y and Tb. PDF analyses were key to identifying similar M–O and M⋯M distances in all cases, thereby demonstrating similar local and long-range structure for the whole family of MOFs. These studies demonstrate the feasibility of PDF analyses to track the formation of metal–oxo nodes and open the possibility for more advanced studies to follow nucleation and growth in situ.Elucidating the structural nature of nucleation species formed before the crystallization of the MOF network is challenging when traditional diffraction methods are applied. PDF analyses can represent an alternative, provided the potential of this technique to assess both amorphous and crystalline phases. One of the first examples of PDF analyses applied to understand MOF nucleation and growth was a contribution by Terban et al.107 In this work, the authors performed in situ PDF experiments combined with mass spectrometry, electron microscopy and DFT calculations, to monitor the formation of ZIF-8. The PDF measurements are sensitive to low-concentrated analytes, which was capital for measuring samples in conditions relevant to nucleation processes. Additionally, the atomic resolution scale of the technique with rapid acquisition times allowed the visualization of local transformations, as previously demonstrated in in situ experiments, which were already applied to phase transition processes108,109 and nanoparticles formation.110 Under the reaction conditions studied, a Zn(2-methylimidazolate)4 cluster was rapidly formed. At the beginning of the reaction, PDF is dominated by peaks at 1.37 and 2.17 Å, which were associated with correlations within the organic linker. Upon ZIF-8 formation, demonstrated by long-range signals corresponding to ZIF-8 phase, the occurrence of new correlations at 2.01 Å was rapidly seen, which were linked to Zn–N bond. The in situ PDF experiments revealed the presence of Zn(2-methylimidazolate)4 clusters during long periods, even after the crystallization.
Xu et al. reported111 another interesting example of MOF nucleation followed by PDF analyses for the archetypical Zr-MOF UiO-66.112 In this case, the inorganic node of the framework consists of a multi-metal Zr6O8 Zr–oxo cluster.113 The presence of polyatomic nodes adds more complexity to the MOF nucleation process since the node has to form before forming the framework. The mechanism observed for UiO-66 was similar to that of ZIF-8. First, the Zr6O8 nodes were formed during the reaction, followed by the formation of an amorphous phase with the connectivity of UiO-66 and structural coherence of ca. 23 Å. This amorphous phase subsequently transformed into the crystalline structure of UiO-66.
More recently, Firth et al. studied the nucleation of Hf-UiO MOFs.114 Hf-MOF analogues are typically used for PDF studies since they present isostructural frameworks to that of Zr-MOFs with the advantage of offering higher sensitivity to X-rays. In this case, the authors assessed the formation of Hf–oxo clusters during MOF synthesis with different reaction conditions (solvent and temperature). The in situ monitoring of the reaction mixture by PDF experiments was compared to simulated profiles of M4, M6, M9, M11 or M12 clusters (Fig. 19). By applying this strategy, the authors demonstrate the aggregation from small clusters (M6) characteristic of hcp UiO-66 to double-clusters (M12) before the formation of hcp Hf-UiO-66. This work corroborated the potential of in situ PDF methods to track the formation of several MOF clusters with atomic precision as demonstrated before for other metal nanosystems.115
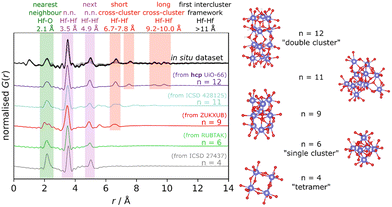 | ||
| Fig. 19 PDF study of the nucleation of Hf-UiO-66. The diagram shows cluster options and the simulated PDF patterns, with key peak areas highlighted, as well as an in situ data set of a linker-free reaction at 150 °C for comparison. Cluster structure colour scheme: Hf, blue; O, red; H, white. Reproduced from ref. 114 with permission of the American Chemical Society. | ||
6. Post-synthesis chemical modifications
6.1. Metal nanoparticles
Stabilizing nanoparticles inside a porous material support is an intriguing approach to creating novel functional materials. Understanding the mechanism of the formation of metal nanoparticles inside the structure is crucial for the design of the material systems, however, traditional characterization approaches often fail to elucidate this task. For example, PXRD is not sensitive enough to nanoparticles because the Bragg peaks generated are extremely wide, making very complicated to generate distinct diffraction profiles. Electron microscopy is powerful for discerning the local formation of nanoparticles, but it only studies limited areas and does not give comprehensive information on all the nanoparticles formed inside the support. In this context, the PDF provides information about local and average structure simultaneously. This conveniently allows to study both the early stages of nucleation, characterized by nanoparticles exhibiting signals only in the local range, and the subsequent growth processes, during which long-range signals begin to emerge.We can find one of the very first examples of PDF analysis applied to the study of metal nanoparticles embedded into a MOF matrix in work by Pascanu et al.116 The authors used X-ray PDF to determine the size of Pd-nanoparticles incorporated inside the mesopores of Cr-MIL-101-NH2. (Fig. 20) To assess the role of palladium loading in the nanoparticle size, Pd-Cr-MIL-101-NH2 was prepared with 4, 8, 12 and 16 wt% Pd. Rietveld refinement of the experimental PDF data of Pd-Cr-MIL-101-NH2 showed an increase in the nanoparticle size in parallel with palladium loading. Interestingly, nano-sized palladium clusters are observed in the samples with low palladium loadings, which were untraceable by powder diffraction. Furthermore, palladium aggregation inside the mesopores of Cr-MIL-101 was ruled out by comparison of the experimental PDFs with simulated data of a palladium nanoparticle of 25 Å size.
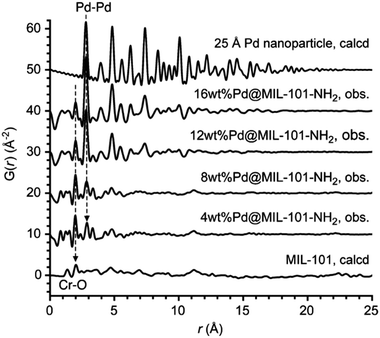 | ||
| Fig. 20 PDFs of Pd MIL-101Cr-NH2 samples, compared with the calculated PDFs of MIL-101Cr (bottom) and of a Pd nanoparticle (diameter: 25 Å, top). For the sake of clarity, the PDFs are vertically stacked by 10 Å. Reproduced from ref. 116, with the permission of John Wiley & Sons. | ||
Rivera-Torrente et al. applied PDF analyses to study how the presence of long-range defects within a porous support affects the stabilization of Pd nanoparticles.117 The authors compared two porous materials containing trimeric iron–oxo clusters with the same chemical composition: MIL-100(Fe) and Basolite F300. The local structure of both materials was elucidated by PDF analyses, which showed they presented the same features at low r values, indicative of an identical local structure. However, MIL-100(Fe) presented medium and long-range order while Basolite F300 lacked an ordered structure beyond 8 Å. The intrinsic structural disorder found in Basolite F300 shelters Lewis acid sites from water, yielding a more hydrophobic structure than MIL-100(Fe), and affects the following impregnation of Pd nanoparticles in terms of the amount and particle size distribution. This work is a good example of how the PDF technique bridged the relationship between structural disorder and metal nanoparticle formation.
PDF studies have been proven to be a very powerful approach to characterizing the atomic structure of metal nanoparticles in situ formed in MOFs. In a relevant work by Platero-Prats et al.,118 studied the evolution of Cu species loaded into NU-1000 under pertinent conditions for catalyst activation by combining PDF and difference electron density (DED) maps to assess the local structure and the location of copper. (Fig. 21) After copper-metalation of NU-1000 using atomic layer deposition (ALD) methods (or AIM, ALD in MOFs), the material was exposed to reductive conditions, yielding the formation of Cu0 species active in reducing ethylene to ethane. Structure refinement of the d-PDF data obtained after activation demonstrated the presence of 4 nm nanoparticles and the formation of few-atoms nanoclusters of metallic copper. This PDF study demonstrated the presence of two types of Cu0 nanostructures inside the NU-1000 framework: sub-nanometer clusters and 4 nm nanoparticles. Similar studies were extended years later to other Zr-MOFs with different topologies, such as NU-901 and NU-907.119
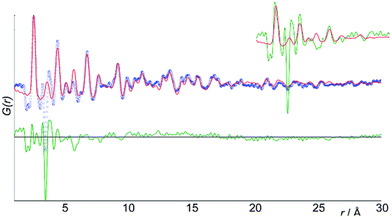 | ||
| Fig. 21 PDF studies on the incorporation of Cu into NU-1000, including fits of models for Cu0 (sub-nanometer clusters and 4 nm nanoparticles). Features in the residual reflect unmodelled species and changes to the framework. (inset) A residual (green) to a fit where only the 4 nm nanoparticles were modelled and the PDF for the Cu0 cluster model (red). Reproduced from ref. 118, with the permission of Royal Society of Chemistry. | ||
The approach shown by Kim et al. to explore metal nanoparticles and nanoclusters in MOFs set the basis for the comprehension of similar systems. Based on PDF analyses, the same authors studied the stabilization of platinum nanoclusters into NU-1000.120 Pt-AIM was performed at two different temperatures (115 °C and 160 °C), yielding two new MOFs: LT-Pt-NU-1000 and HT-Pt-NU-1000 respectively. d-PDF analyses of the LT-Pt-NU-1000 system showed the presence of Pt–O and Pt⋯Zr at 2.05 Å and 3.00 Å, respectively. Furthermore, a group of distances between 3.33 and 3.68 Å was also determined, which can be linked to Pt⋯Pt distances. Based on PDF experiments, the local structure suggested for the platinum sites varies in each case. In the high-temperature Pt-AIM, nanoclusters predominate, whereas in the low-temperature Pt-AIM, single atom species constitute a significant portion. This was also in good agreement with those observed by EXAFS.
The PDF has also been applied to better understand the role of pore-templated growth of catalytic metal nanoparticle into MOFs. In this context, PDF analysis was found to be a powerful method to understand how the chemical modification of the organic backbone in a MOF affects the growth of gold nanoparticles inside the pores of NU-1000.121 Another interesting case study was reported by Butson et al., where they present the growth modulation of palladium nanoparticles inside the flexible Al-MIL-53 following two methods: gas-phase reduction and electrodeposition.122 Small-box structure refinements to PDF data collected on these materials demonstrated that the nanoparticle size depends on the synthetic procedure followed.
Metal nanoparticle growth can also be achieved in situ by controlled heating treatments of the MOF itself. In a recent example by Chen et al., the authors demonstrated this approach with the pyrolysis of MOFs containing two metals to obtain bimetallic nanoparticles123 Samples of PCN-250 were prepared containing different metal clusters (Fe3, Fe2Co, Fe2Ni). In situ PDF data was acquired during pyrolysis to follow the formation of the bimetallic nanoparticles inside the MOFs. Before the pyrolysis, variations of the PDF signals below 3.3 A are observed in all the samples, indicative of distortions of the trimeric MOF clusters (Fig. 22). Additionally, a broadening and a shift to shorter distances are seen in the long-range, which is related to a higher disorder in this region (including thermal disorder) and a negative thermal expansion. After the formation of the nanoparticles, PDFs of the different systems were compared to simulated data for fcc, bcc and rock-salt structures. Following this methodology, the authors correlate the presence of a rock salt phase in all three types of nanoparticles, as well as an fcc phase in the Fe2Ni nanoparticles and a bcc phase in the case of Fe2Co nanoparticles.
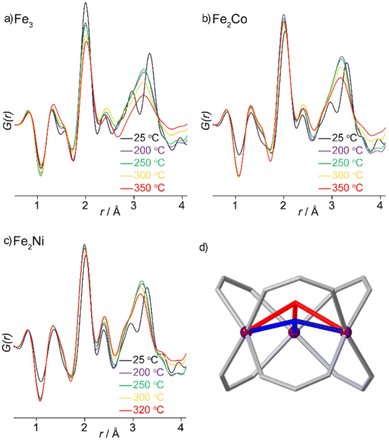 | ||
| Fig. 22 PDFs of PCN-250 with (a) Fe3, (b) Fe2Co, and (c) Fe2Ni nodes that reflect (d) changes in local structure preceding nanoparticle formation. Reproduced with permission from ref. 123. Copyright 2021 American Chemical Society. | ||
6.2. Metal nanoclusters and single sites
The chemical modification of MOFs and COFs with metal nanoclusters and single sites has been widely explored by applying PDF analyses. The variations in the PDF signals of a given material seen before and after chemical modifications with metals are correlated to new atom–atom distances because of the added functionalities.Benseghir et al. studied the co-immobilization of a PW12 Keggin polyoxometalate (POM) and a Cp*Rh(bpydc)Cl2 catalyst into the Zr-UiO-67 MO124 (Fig. 23). The authors ascertained the structural integrity of the PW12 inside the material by applying d-PDF analyses and comparing the experimental signal against the simulated data of the isolated POM. This POM-MOF composite exhibited a synergistic effect between the PW12 and the Cp*Rh UiO-67 catalysts, resulting in a material with promising photocatalytic activity towards CO2 reduction.
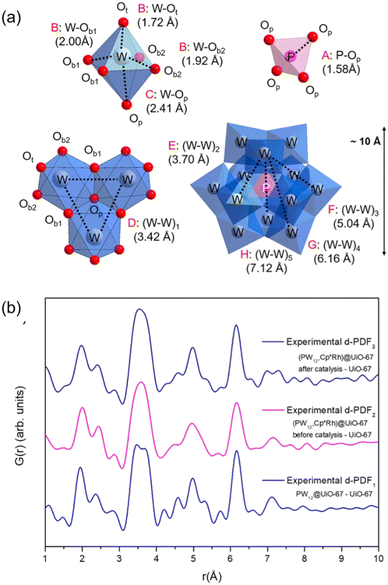 | ||
| Fig. 23 (a) POM components with refined distances: the PO tetrahedron, the WO6 octahedron, the trimer of WO6 octahedra, and within the full PW12 polyoxometalate structure. WO6, blue octahedra; PO4, pink tetrahedron; O, red spheres; W, grey spheres; P, pink sphere. (b) Experimental d-PDFs (numbered 1 to 3) for PW12 in PW12 UiO-67 (blue), in (PW12,Cp*Rh) UiO-67 before catalysis (magenta), and in (PW12,Cp*Rh) UiO-67 after catalysis (navy blue) determined by subtracting the PDF of UiO-67 from the PDF of PW12 UiO-67, (PW12,Cp*Rh) UiO-67 before and after catalysis, respectively. Reproduced with permission from ref. 124. Copyright 2020 American Chemical Society. | ||
Duguet et al. performed a similar study to assess the immobilization of a [PW12O40]3− MOP into a Zr6-(Fe)TCPP MOF.125 This MOF structure exhibits three possible structures: MOF-525, PCN-224 and PCN-222. The more stable thermodynamic phase is PCN-222, while MOF-525 and PCN-224 are the kinetic phases. A detailed study of the structure of MOP MOF composites was performed to determine how the immobilization of the POM favours the formation of the kinetic phases. In particular, two sets of materials were prepared through the in situ immobilization of [PW12O40]3−: one at room temperature to obtain the kinetic phases and a control one at 120 °C to obtain the thermodynamic phase. When the POM was added during the MOF synthesis, a mixture of both kinetic phases (MOF-525/PCN-224) was obtained even at high temperatures. This evidence suggested a directing role of the [PW12O40]3− immobilization in the topological construction of the PCN network.
The post-synthetic functionalization of MOF clusters, particularly those containing the Zr6O8 core, has been under the spotlight of PDF analyses recently. Zr-MOFs exhibit great variability in terms of the saturation of their clusters. The variable connectivity of the Zr–oxo cluster allows the presence of defective sites (missing-linker) within the structure, which are rapidly filled with OH2 and OH ligands. This interesting behaviour turns Zr-MOFs into excellent scaffolds for tuning the chemistry of their nodes. In this regard, different strategies can be used for the expansion of the chemistry of this type of cluster.
One synthetic approach to modify the chemistry of the Zr6O8 clusters is through metalation on the aqua-hydroxo defective sites via atomic layer deposition (ALD) reactions. In 2015, Kim et al. applied d-PDF analyses to study the structure of NU-1000 modified with trivalent cations (Al3+ and In3+) through ALD.126 NU-1000 presents intrinsic defective sites in the Zr6O8 clusters arising from its 8-fold connectivity. Al-NU-1000 showed limited stability due to the strong Lewis acidity of the precursor AlMe3 (the synthesis of this material was fully optimised years later, vide infra). The d-PDF of In-NU-1000 was governed by strong signals, mainly In–O (2.12 Å), and In⋯Zr (3.33 Å), associated with the deposition of indium–oxo single sites. In particular, the lack of signals linked to In⋯In distances indicated the presence of site-isolated In atoms. The assignment of the signals was made by a combination of theoretical calculations. Specific distances from the models were compared against d-PDF of the loaded material, assigning the related signals on the d-PDF. The predicted structural model matched very well with the experimental d-PDF data. The Al-NU-1000 was prepared under milder conditions using Al(iPrO)3 as a precursor in a related study.127 A similar characterization approach was carried out and complemented with XAS data. The authors could conclude the presence of 4–8 Al atoms attached to the Zr6O8 clusters within NU-1000. This characterization approach was expanded to the study of metal sites containing transition metals and lanthanides.128 In particular, Ni doping by ALD in NU-1000 was thoroughly studied by Platero-Prats et al.129 Furthermore, a complementary analysis of EXAFS and PDF data showed that the nickel is deposited as 4-Ni cluster within an α-Ni(OH)2-like layer (Fig. 24), bridging two Zr6O8 clusters, yielding heterobimetallic nanostructures.
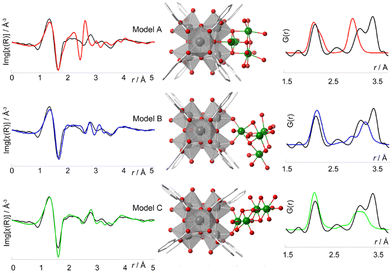 | ||
| Fig. 24 Proposed models of a Ni4 cluster attached to a MOF Zr6 node and a comparison of the corresponding simulated Ni K-edge EXAFS (left) and PDFs (right, Ni–Ni, Ni–O, and O–O correlations) to the experimental data (black). For both EXAFS and PDF, model C provides the best match to the experimental data [C: light grey, O: red, Ni: green, Zr: grey]. Reproduced with permission from ref. 129. Copyright 2017 American Chemical Society. | ||
In recent years, this characterization approach has been used for other Zr-MOFs such as MOF-808.130 Castillo-Blas et al. prepared a Fe-loaded MOF-808 by soaking the pristine MOF into a solution of FeCl2. Fe-MOF-808 was obtained with two different Fe loadings (i.e., Fe-0.5-MOF-808 and Fe-1.2-MOF-808). By combining XAS, DFT calculations and quantitative analysis of d-PDF data (Fig. 25), the authors could characterize the Fe species deposited on the surface of the MOF nodes and confirm the presence of Fe-dimers linking two Zr6O8 clusters. This unique hetero-bimetallic MOF was demonstrated to be active in removing organic contaminants in water via Fenton reactions.
 | ||
| Fig. 25 (a) Total PDFs of pristine and Fe-MOF-808 materials (up) and the corresponding d-PDFs for Fe-0.5-MOF-808 and Fe-1.2-MOF-808. d-PDF signals are obtained after comparing the PDF signal of pristine MOF-808 to that of Fe-MOF-808 materials to highlight the correlations characteristic of the iron clusters (down). (b) Simulated d-PDF signal of a hypothetical binuclear iron cluster (up) and experimental d-PDF signal of Fe-0.5-MOF-808 (down) fitted to Gaussian curves for quantitative analyses to estimate the cluster size. Reproduced from ref. 130, with the permission of Royal Society of Chemistry. | ||
Doping MOF materials with metal sites is a promising chemical modification to tune material properties. Howe et al. explored the structure of mixed-metal Mg-Ni MOF-74 and Mg-Cd MOF-74,131 composed of metal–oxo rods as building units. By combining PDF experiments with computational studies, the authors demonstrated the homogeneous dispersion of the added metals within the Mg–O chains. Interestingly, the authors demonstrated that doping with Ni(II) and Cd(II) causes a local distortion of the Mg–O chains. Beyond MOFs, COF structures are also ideal platforms for post-synthetic decorations through stabilizing metal sites. In this context, Romero-Muñiz et al. studied the role of local defects within an imine-linked 2D-COF to stabilize catalytic palladium centers.132 In this work, the authors prepared two sets of materials: an early-metalated material, for which metalation and COF formation occurred simultaneously; and a late-metalated material, for which metalation was carried out on the crystalline COF. Assisted by DFT calculations combined with d-PDF analyses, the authors corroborated that palladium tends to bind the defective sites present in the imine-linkages upon hydrolysis. Therefore, the chemical functionalization of COFs is thermodynamically favoured on the defects compared to the pristine sites. Interestingly, although the local structure for both early- and late-metalated COFs was related, major differences were seen in their catalytic activity for Suzuki–Miyaura couplings. In order to assess the structure of the palladium catalytic species in these materials, d-PDF analysis was performed. When d-PDF data of these COFs were analysed after catalysis, significant palladium aggregation was determined for the late-metalated COF material in contrast to the behaviour seen for its early-metalated analogue (Fig. 26). Furthermore, the d-PDF analysis also demonstrated the stabilization of discrete Pd(II) complexes within the COF backbone under catalytic conditions. Similar d-PDF approaches were also applied to assess the local structures of catalytic copper133 and platinum134 sites incorporated in COF materials.
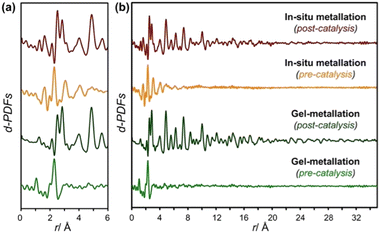 | ||
| Fig. 26 d-PDFs obtained by subtracting the PDF obtained for pristine COF, showing the contributions attributed to the palladium species before and after catalysis for the different metalation methods used. (a) Range from 0–6 Å and (b) range from 0–35 Å. Reproduced from ref. 132, with the permission of John Wiley & Sons. | ||
7. Surface and molecular interactions
The study of host–guest interactions in adsorption and catalysis processes is challenging but crucial for understanding structure–property relationships and helps in the design of novel functional materials. SCXRD analyses have provided interesting results,135 but the prerequisite of obtaining single crystals has sometimes limited its utilization. PDF analysis stands out as a potential tool to follow host–guest interactions in porous materials because (1) it has a versatile ability to determine the distance between guest molecules and framework; (2) a combination of PDF and theoretical calculations can provide a detailed structural model with an atomic resolution of the material, even of the defects; and (3) it is possible to use in situ PDF analysis to track the mechanisms of adsorption and catalysis under conditions relevant for ultimate applications.Chapman et al. have extensively studied the capture of radioactive wastes such as I2 using nanoporous MOFs.136 X-ray total scattering data were collected on ZIF-8 before and after high-pressure-induced amorphization, during I2 removal upon annealing and redispersion of the material (Fig. 27). The analysis of the d-PDF data suggested that the local connectivity of the structure was maintained in the amorphous samples. The occurrence of new atom–atom distances on the PDFs was identified, which were explained by the orption of iodine molecules on the pore surface. The main features seen in the PDF data during I2 capture were the sharpening and shift from 2.8 to 2.6 Å of the signals corresponding to I–I bond, and the increase in the intensity of the peaks around 4.3–4.4 and 3.85 Å that are associated with supramolecular interactions inside the pores. This is representative of the I2 molecules re-arrangement within the pores of ZIF-8 upon annealing. The study concluded that the amorphous annealed ZIF-8 retains more captured I2 and retards the loss of I2 compared to crystalline ZIF-8.
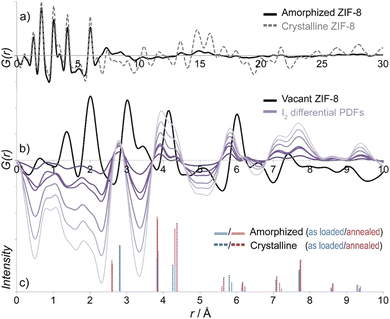 | ||
| Fig. 27 (a) PDFs for the crystalline and amorphous ZIF-8 materials, and (b) differential PDFs corresponding to I–I and I⋯framework interactions in the pressure-amorphized materials. (c) The intensity and position of features in d-PDFs for crystalline, amorphous, and as-loaded and annealed samples are compared. Reproduced with permission from ref. 137. Copyright 2011 American Chemical Society. | ||
Furthermore, the mechanism for the I2 capture inside the ZIF-8 pores was also explored by combining PDF experiments and molecular simulations.137 In this study, radial distribution functions (RDF) derived from computed models were calculated and compared to the experimental d-PDFs obtained upon iodine loading. Distances corresponding to I⋯H and I⋯C linked to the interaction between iodine and the organic linker were observed. An interesting behaviour of the material was the loss of long-range order (i.e. r > 20 Å) upon high loading of iodine while the short-range order was retained. The authors presented ZIF-8 as a promising candidate for the uptake of I2 and demonstrated the utility of PDF for studying the structural integrity of MOFs in scenarios where other crystallographic techniques would rather fail. Following the work on ZIF-8, other MOFs have been tested for the capture of I2. Years later, the same authors studied the preferential capture of I2 and water vapour in the archetypical Cu-MOF HKUST-1.138 By combining Fourier maps and Grand Canonical Monte Carlo (GCMC) simulations (i.e. a Monte Carlo simulation where chemical potential, volume and temperature are fixed values) they could suggest atom–atom distances linked to I2 interactions with both the metal cluster (3.23–3.30 Å) and the organic linker (3.47–3.92 and 4.09–4.51 Å). These distances were indeed further corroborated by d-PDF. These types of studies were also extended to other nanoporous materials beyond MOFs.139
The study of molecules, even the simplest ones, containing weakly scattering elements represents a challenge for X-ray PDF analyses. This can be overpassed by using neutrons, for which the scattering is not proportional to the atomic number but to the scattering length of each atom. Kanoya et al. studied the adsorption of D2 within IRMOF-1 by neutron total scattering, RMC and molecular dynamics simulations.140 The authors described four types of interaction sites, three for the interaction of D2 with the zinc–oxo cluster (O6, O3 site, and O2 site) and one for the ligand (C6 site) based on the simulations. By comparison of the experimental d-PDF obtained upon D2 sorption at 1 MPa with a weighted sum of simulated d-PDF data, the authors concluded that positions O6 and O3 are fully occupied, whereas positions O2 and C6 were only 1/3 occupied.
The use of d-PDF analyses to track host–guest interactions between gas molecules and porous materials has also been applied to study chemisorption phenomena on MOFs. A good example was reported by Allan et al. to follow the capture of H2S on the Ni-MOF (CPO-27).141 d-PDF data obtained on CPO-27 with and without H2S loading showed characteristic features corresponding to the formation of Ni–S bonds (2.55 Å).
d-PDF analyses have also been applied to follow host–guest interactions beyond the gas phase. Howarth et al. reported one remarkable example of the adsorption of water pollutants by different Zr-MOFs.142 In this work, the authors discussed the precise coordination of selenate and selenite species to the Zr6O8 clusters within NU-1000 by using d-PDF methods. A few years later, a similar approach was used to identify the capture of [Sb(OH)6]− species in this MOF.143
UiO-67 has also been studied as a platform for the uptake and degradation of dimethyl methylphosphonate (DMMP).144 In this case, in situ d-PDF data of the UiO-66 samples, evidenced a cell contraction upon uptake of the pollutant. The authors could track the degradation mechanism by comparing the experimental PDFs with the calculated ones obtained from computed models where DMMP is bonded to the cluster.
More recently, Sava Gallis et al. reported the structure/property relationship of MOFs to understand the selective adsorption of O2 over N2 in MIL-100 (Sc and Fe).145 By applying d-PDF analyses, the authors identify subtle local structural distortions of the metal clusters in MIL-100 depending on the chemistry. In particular, d-PDF analyses highlighted differences in the M–(μ3-O)–M angle within the metallic trimers that could explain the differences observed in terms of O2/N2 selectivity. While in the case of Fe the O atom is contained within the plane of the metals, in the case of Sc the O atom is slightly out of the metallic plane. This local distortion of the metal cluster, depending on the chemistry, could explain the affinity of Sc-MIL-100 to capture of O2 through the occurrence of Sc⋯O2 interactions.
In 2019, Simons et al. combined PDF and EXAFS experiments with theoretical calculations to explore the structure of the inorganic clusters in MIL-100(Fe) under conditions relevant to the activation of light alkanes in the presence of N2O.146 Analysis of the PDF signals associated with the iron–oxo nodes before and after the reaction revealed a decreasing number of the Fe–O and Fe⋯Fe distances upon activation with NO2. Interestingly, the local changes seen within the MOF node during activation are reversed during alkene oxidation. This indicates the partial reduction of the nodes during activation and, therefore, of the role of the subtle local variations in the MOF nodes during catalysed transformations.
8. Conclusion and outlook
In this review, we have thoroughly examined the current state of the art of the PDF analysis applied to the structural studies of porous materials, with a specific focus on covalent and metal–organic frameworks. Through the compilation of works discussed, we have provided a comprehensive overview in Table 3, facilitating detailed meta-analysis.| Material | Type of problem | Analysis type | Complementary techniques | Ref. |
|---|---|---|---|---|
| lcs bio-MOF-100 | Topological transformation | Model independent | Synchrotron PXRD | 63 |
| dia-c bio-MOF-100 | ||||
| fcu UiO-66 (Hf) | Characterization of defect regions | Small-box refinement, large-box refinement | Synchrotron PXRD, electron microscopy, quantum mechanical calculations, TGA, BET | 65 |
| reo UiO-66 (Hf) | ||||
| Cu-SIP-3 | Study of single-crystal to disordered to single-crystal transformation | Small-box refinement, d-PDF | SCXRD, gas sorption | 71 |
| PATnC/CAF-1 | Study of amorphous-to-crystalline transitions | Small-box refinement | FT-IR, CHN analysis, 15N and 13C ss-NMR, synchrotron PXRD, DFT calculations | 72 |
| PATCNnC/CAF-2 | ||||
| YO-MOF | Study of breathing behaviour | Model independent | Gas sorption | 75 |
| ZrCDC | Study of breathing behaviour | Small-box refinement | 13C ss-NMR, DFT calculations | 76 |
| ZIF-4 (Zn) | Elucidation of local structure in amorphous MOF | Large-box refinement | Neutron total scattering, reverse Monte Carlo | 80 |
| ZIF-1 | Elucidation of local structure in amorphous MOFs | Large-box refinement | Variable temperature PXRD, TGA, DSC, nanoindentation experiments | 83 |
| ZIF-3 | ||||
| ZIF-4 (Co) | ||||
| UiO-66 (Zr) | Elucidation of local structure in amorphous MOFs | Large-box refinement | 13C ss-NMR, PXRD, DFT calculations | 84 |
| MIL-140 | ||||
| ZIF-4 glass | Elucidation of local structure in amorphous MOFs | Model independent | TGA, DSC, small-/wide-angle X-ray scattering (SAXS/WAXS) | 85 |
| Liquid ZIF-4 | Elucidation of local structure in amorphous MOFs | Large-box refinement | Neutron total scattering, reverse Monte Carlo, first-principle molecular dynamics | 90 |
| Co4-BTC | Elucidation of local structure | Small-box refinement | XANES, FT-EXAFS | 94 |
| Co4-BTB | ||||
| Co4-TPT | ||||
| Co4-TPP | ||||
| Co4-TPB | ||||
| SiO2@NU-1000 | Elucidation of local structure in MOF-derived composite | Small-box refinement, d-PDF | FT-IR, DFT calculations | 96 |
| Zr6@SiO2 | ||||
| Fe-PCN-250 | Elucidation of local structure in MOF-derived composite | Small-box refinement (nPDF) | PXRD, TGA | 98 |
| 4PE-1P COF | Elucidation of local structure/study of stacking disorder | Small-box refinement | Synchrotron PXRD, DFT calculations | 100 |
| 4PE-2P COF | ||||
| 4PE-3P COF | ||||
| 4PE-TT COF | ||||
| 3PA-2P COF | ||||
| 3PA-TT COF | ||||
| 3PB-TT COF | ||||
| TTI-COF | Elucidation of local structure/study of stacking disorder | Small-box refinement | Stacking fault simulations | 102 |
| PI-3 | Elucidation of local structure | Small-box refinement | ss-NMR, FT-IR, quantum-chemical simulations | 103 |
| rPI-3 | ||||
| NU-1000 (Zr) | Study of local structural transitions | d-PDF | TGA-DSC, ab initio calculations | 104 |
| NU-1000 (Hf) | ||||
| UiO-66 (Zr) | ||||
| UiO-66 (Hf) | ||||
| PCN-224 | Elucidation of local structure (inorganic building unit) | Small-box refinement | SCXRD, 1H, 15N and 13C ss-NMR | 105 |
| PCN-221 | ||||
| MOF-525 | ||||
| ZIF-8 | Elucidation of local structure (in situ monitoring of MOF formation) | Small-box refinement | MS, electron microscopy, DFT calculations | 107 |
| UiO-66 (Zr) | Elucidation of local structure (in situ monitoring of MOF formation) | Small-box refinement | PXRD | 111 |
| fcu UiO-66 (Hf) | Elucidation of local structure (inorganic building unit) | Small-box refinement | — | 114 |
| hcp UiO-66 (Hf) | ||||
| Pd@Cr-MIL-101-NH2 | Elucidation of local structure/nanoparticle growth | Small-box refinement | Electron microscopy, FTIR, CHN analysis, electron tomography | 115 |
| MIL-100 (Fe) | Elucidation of local structure | Model independent | Electron microscopy, CHN analysis, PXRD | 116 |
| Basolite F300 | ||||
| Cu-NU-1000 | Elucidation of local structure/nanoparticle growth | Small-box refinement, d-PDF | Synchrotron PXRD, XPS | 117 |
| Cu-NU-901 | Elucidation of local structure/nanoparticle growth | Small-box refinement, d-PDF | ICP-OES, ab initio calculations | 118 |
| Cu-NU-907 | ||||
| Pt-NU-1000 | Elucidation of local structure | d-PDF | XAS, electron microscopy | 120 |
| Au-NU-1000 | Elucidation of local structure/nanoparticle growth | Small-box refinement, d-PDF | ICP-OES, XPS, electron microscopy | 121 |
| Pd-Al-MIL-53 | Elucidation of local structure | Small-box refinement, d-PDF | SEM-EDX, electron microscopy | 122 |
| Fe-M-PCN-250 (M = Co, Ni) | Elucidation of local structure | Small-box refinement, d-PDF | — | 123 |
| (PW12,Cp*Rh)@UiO-67 | Elucidation of local structure | d-PDF | 31P and 13C ss-NMR, DFT calculations | 124 |
| PW12@Zr6-TCPP-Fe | Elucidation of local structure | d-PDF | ss-NMR, DFT calculations | 125 |
| Al-NU-1000 | Elucidation of local structure | d-PDF | Ab initio calculations | 126 |
| In-NU-1000 | ||||
| Ni-NU-1000 | Elucidation of local structure | d-PDF | Synchrotron PXRD, XAS, DFT calculations | 129 |
| Fe-MOF-808 | Elucidation of local structure | d-PDF | XAS, DFT calculations | 130 |
| Mg-Ni-MOF-74 | Elucidation of local structure | Small-box refinement | DFT calculations | 131 |
| Mg-Cd-MOF-74 | ||||
| Pd@TAPB-BTCA | Elucidation of local structure | d-PDF | Synchrotron PXRD, XAS, FT-IR, DFT calculations | 132 |
| Pd@TAPB-TFP | ||||
| Cu@TAPB-BTCA | Elucidation of local structure | d-PDF | XRF, SEM-EDX, gas sorption | 133 |
| Cu@TAPB-TFP | ||||
| Pt@TAPB-BTCA | Elucidation of local structure | d-PDF | XRF, SEM-EDX | 134 |
| ZIF-8 | I2 sorption | d-PDF | Synchrotron PXRD, TGA-DSC analysis | 136 |
| HKUST-1 | Preferential I2 sorption | d-PDF | GCMC simulations, synchrotron PXRD, TGA-DSC-MS analysis | 138 |
| IRMOF-1 | D2 sorption | Large-box refinement, d-PDF | Neutron total scattering, reverse Monte Carlo and molecular dynamics simulations | 140 |
| CPO-27 | H2S sorption | d-PDF | Gas sorption, synchrotron PXRD | 141 |
| NU-1000 (Zr) | Sorption of SeO32− and selenate SeO42− | d-PDF | FT-IR, SEM-EDX analysis | 142 |
| UiO-66 (Zr) | ||||
| UiO-66-NH2 (Zr) | ||||
| UiO-66-(NH2)2 (Zr) | ||||
| UiO-66-(OH)2 (Zr) | ||||
| UiO-67 (Zr) | ||||
| UiO-66 | DMMP capture and decomposition | — | — | 144 |
| MIL-100 (Sc) | Preferential O2 sorption | d-PDF | Gas sorption, GCMC simulations, synchrotron PXRD, TGA-MS analysis | 145 |
| MIL-100 (Fe) | ||||
| MIL-100 (Fe) | Activation of light alkanes | d-PDF | XAS, Mössbauer spectroscopy, DFT calculations | 146 |
Over the past 15 years, PDF analysis has successfully tacked various challenges in MOFs and COFs, broadly categorized into two types: structural transformations leading to unknown structures and local-structure modifications while maintaining the average structure. In the first category, studies employing both small and large box approaches have been utilized to refine the material structures compared to a proposed model, often derived from DFT or RMC calculations. These analyses have encompassed processes including complete structural transformations such as topological alterations, phase transformations or flexible materials, as well as MOFs with a lack of periodic ordering, such as amorphous structures, glasses, or liquids. The objective of these studies has been to elucidate the final structure of the material or characterize intermediate systems, as observed in nucleation processes.
In cases where changes occur exclusively at a local level, the focus shifts to characterizing active sites, whether as catalytic centres or for capturing guest molecules. Here, we observe a prevalence of model-independent analysis, often employing differential analysis to study signals associated with observed changes. Complementary techniques such as EXAFS or ss-NMR are commonly used to establish reliable models of active sites.
Table 3 shows that 45% of the examples employed the small-box method for PDF analysis. Although this method is based on periodic models, it effectively addresses structural challenges that traditional Bragg scattering cannot, particularly in cases such as nanoparticle growth where distinct Bragg peaks are absent, limiting Rietveld-type analysis.116,118,119,121–123 Small-box refinement is also essential for studying nucleation, where early crystalline domains are too small for effective Rietveld analysis.107,111,114
In COFs, small-box refinements add complexity but complement, rather than replace, Rietveld analyses of PXRD data. For example, laminar COFs often lack sufficient diffraction for Rietveld analysis, making small-box refinement critical for revealing structural details like the crystallographic axes.101,103 Additionally, small-box PDF analysis is useful for comparing PDFs in intermediate stages or mixtures, such as analysing defective phases of UiO-6365 or comparing PDFs during bond rearrangement.71
In the surface and molecular interaction section, most examples used model-independent analysis, which provides limited information.136,138,141,142,144–146 This limitation arises from technical challenges, including accurately defining the local structure around adsorbed molecules or surface atoms within the porous frameworks of MOFs and COFs. Developing robust computational models to simulate these complex interactions is crucial for advancing our understanding of surface interactions and improving the accuracy of analyses in this field.
The growing interest in PDF analysis within the MOF and COF fields reflects broader trends in scientific communities. This surge has already influenced several aspects of the field, driving technical advancements, enhancing data evaluation and shaping future research directions. Notably, PDF analysis is becoming more accessible to standard users, reducing the need for extensive crystallography training. Recent notable advancements include the establishment of dedicated beamlines specifically designed for PDF acquisition147–150 and an increasing interest among commercial companies in developing diffractometers compatible with PDF acquisition.
Today, acquiring PDF data of reasonable quality is feasible using in-house setups with low-wavelength sources such as Ag or Mo Kα: 22.16 and 17.48 keV, respectively. This increase in experimental accessibility for total scattering data acquisition underscores the demand for user-friendly software facilitating PDF data processing without compromising rigor. Numerous programs with accessible graphical interfaces enable basic processing to obtain PDFs.21,151–156
The rising number of users and general interest PDF analyses are expected to generate substantial metadata for new and previously known structures. This influx could be pivotal in developing deep-learning-based tools that assist in PDF assignments, addressing a key bottleneck in the technique. Notably, techniques such as NMR,157,158 and PXRD159 have made good progress in applying deep learning to data interpretation. In PDF analysis, studies are emerging using this methodology to retrieve symmetry features160 and identify nanostructure formation,161 despite the fact that the application of these methodologies is still far from being easily implemented in highly complex systems such as MOFs or COFs. Data generation could also be instrumental in creating open-access databases containing reduced PDFs, enhancing comparative analyses162 and facilitating advanced studies such as phase identification or multivariate analysis.163–167
Another significant advancement that is poised to revolutionize the field the short term is the utilisation of electron diffraction for generating PDFs, often referred to as ePDF.21,168–170 Electron diffraction has already initiated a paradigm shift in crystallography, particularly evident in the case of COFs.171 The main advantage of electron diffraction over X-rays is its capability to analyse very small crystals and complex structures with high resolution and sensitivity.172 Despite the associated high costs, the increasing prevalence of transmission electron microscopy (TEM) setups for electron diffraction underscores the growing interest in this technique. TEM, functioning as a local-probe method, offers the unique capability to capture images and diffraction data from crystals or particles. This highlights ePDF as a promising method for mapping structures,33 even in challenging cases involving non-periodic features or amorphous materials.
In addition to the technical advancements, the increasing utilization of PDF analysis within the field of porous structures is also specific to pave the way toward new research directions and the development of more advanced materials. For instance, it has significantly influenced the recent surge in the synthesis and study of low-crystallinity/amorphous materials, such as glasses or porous organic frameworks, given that PDF is one of the few techniques capable of providing insights into these structures. This has fostered a deeper understanding of designing similar materials with intriguing properties, notwithstanding their structural complexity. Furthermore, the substantial progress in this field extends beyond synthetic advancements to notable strides in applications and processing, indicating their potential for real-world applications.173–175 This is exemplified by the development of increasingly intricate chemical composition frameworks, resulting in enhanced properties vital for developing commercially viable materials. For instance, in the case of MOF and COF composites for the formation of membranes176–178 or aerogels,179,180 these structures exhibit high complexity both chemically, due to their non-homogeneous composition, and physically/engineering-wise, due to their interphase-related structure.181 It would therefore be beneficial to establish open databases of PDFs of already elucidated compounds, which would allow for faster structure identification or tools like ePDF experiments for structural mapping.
In conclusion, despite current limitations, we firmly believe that the PDF technique will consolidate in the future as a foundational probe, unveiling intriguing structural phenomena occurring in these material classes. As we look to the future, the advent of advanced facilities like free electron lasers, enabling femtosecond data collection to investigate catalytic mechanisms, and fourth-generation storage ring synchrotrons with high-energy capabilities will undoubtedly propel the application of PDF analysis into an abundance of technologically significant areas. In other words, we are poised to unlock a multitude of chemical phenomena relevant to materials, all thanks to the powerful capability of the PDF technique.
Abbreviations
| 3D-ΔPDF | Three-dimensional differential PDF |
| ADP | Atomic displacement parameters |
| ALD | Atomic layer deposition |
| BET | Bruneauer–Emmett–Teller analysis |
| COF | Covalent organic framework |
| d-PDF | Differential pair distribution function |
| DED | Difference electron density |
| DFT | Density functional theory |
| DMMP | Dimethyl methylphosphonate |
| DSC | Differential scanning calorimetry |
| ePDF | Electron pair distribution function |
| EXAFS | Extended X-ray absorption fine structure |
| FT-IR | Fourier transformed infrared spectroscopy |
| GCMC | Gran Canonical Monte Carlo |
| ICP | Induced coupled plasma |
| ILL | Institute Laue-Langevin |
| MOF | Metal–organic framework |
| NBED | Nanobeam electron diffraction |
| NMF | Nonnegative matrix factorization |
| OES | Optic emission spectroscopy |
| PCA | Principal component analysis |
| Pair distribution function | |
| PSI | Paul Scherrer Institute |
| PXRD | Powder X-ray diffraction |
| RDF | Radial distribution function |
| RMC | Reverse Monte Carlo |
| SCXRD | Single-crystal X-ray diffraction |
| ss-NMR | Solid-state nuclear magnetic resonance |
| TEM | Transmission electron microscopy |
| TGA | Thermogravimetric analysis |
| XAS | X-ray absorption spectroscopy |
Author contributions
We describe contributions to the paper using the CRediT author statement.182 Writing – original draft: I. R. M. and A. E. P. P. Writing – review & editing: I. R. M., E. L., Y. X., F. Z. and A. E. P. P. Conceptualization: I. R. M. and A. E. P. P. Project administration: F. Z. and A. E. P. P. Funding acquisition: F. Z. and A. E. P. P.Data availability
No primary research results, software or code have been included and no new data were generated or analysed as part of this review.Conflicts of interest
There are no conflicts to declare.Acknowledgements
This work was supported by CNS2022-135261, PID2021-123839OB-I00 and PID2022-138908NB-C31 funded by MCIN/AEI/10.13039/501100011033 and EUR2020-112294 funded by MCIN/AEI/10.13039/501100011033 and by the European Union “NextGenerationEU”/PRTR. A. E. P.-P. and F. Z. acknowledge the financial support from the Spanish Ministry of Science and Innovation, through the “María de Maeztu” Programme for Units of Excellence in R&D (CEX2018-000805-M). A. E. P.-P. acknowledges the Spanish Ministry of Science and Innovation for a Ramón y Cajal fellowship (RYC2018-024328-I). I. R.-M. acknowledges FPI-UAM 2019 fellowship UAM. The authors thank Dr. Celia Castillo-Blas for her valuable discussions about the treatment of the PDF data. This project has received funding from the European Union's Horizon 2020 research and innovation programme under grant agreement no. 101034324.References
- O. M. Yaghi, J. Am. Chem. Soc., 2016, 138(48), 15507–15509 CrossRef CAS PubMed.
- O. M. Yaghi, Introduction to Reticular Chemistry: Metal-Organic Frameworks and Covalent Organic Frameworks, Wiley, 2019 Search PubMed.
- S. M. Cohen, Chem. Rev., 2012, 112, 970–1000 CrossRef CAS PubMed.
- R. Liu, K. T. Tan, Y. Gong, Y. Chen, Z. Li, S. Xie, T. He, Z. Lu, H. Yang and D. Jiang, Chem. Soc. Rev., 2021, 50, 120–242 RSC.
- J. L. Segura, S. Royuela and M. Mar Ramos, Chem. Soc. Rev., 2019, 48, 3903–3945 RSC.
- L. Valenzano, B. Civalleri, S. Chavan, S. Bordiga, M. H. Nilsen, S. Jakobsen, K. P. Lillerud and C. Lamberti, Chem. Mater., 2011, 23, 1700–1718 CrossRef CAS.
- S. R. Elliott, J. Non-Cryst. Solids, 1987, 97, 159–162 CrossRef.
- S. J. L. Billinge and I. Levin, Science, 2007, 316, 561–565 CrossRef CAS PubMed.
- S. Bordiga, F. Bonino, K. P. Lillerud and C. Lamberti, Chem. Soc. Rev., 2010, 39, 4885–4927 RSC.
- E. Brunner and M. Rauche, Chem. Sci., 2020, 11, 4297–4304 RSC.
- H. Günther, NMR spectroscopy: basic principles, concepts and applications in chemistry, John Wiley & Sons, 2013 Search PubMed.
- K. I. Hadjiivanov, D. A. Panayotov, M. Y. Mihaylov, E. Z. Ivanova, K. K. Chakarova, S. M. Andonova and N. L. Drenchev, Chem. Rev., 2021, 121, 1286–1424 CrossRef CAS PubMed.
- I. Romero-Muñiz, C. Romero-Muñiz, I. Castillo-Velilla, C. Marini, S. Calero, F. Zamora and A. E. Platero-Prats, ACS Appl. Mater. Interfaces, 2022, 14(23), 27040–27047 CrossRef PubMed.
- T. Egami and S. J. L. Billinge, Underneath the Bragg peaks: structural analysis of complex materials, Elsevier, 2003 Search PubMed.
- P. F. Peterson, D. Olds, M. T. McDonnell and K. Page, J. Appl. Crystallogr., 2021, 54, 317–332 CrossRef CAS PubMed.
- T. R. Welberry and B. D. Butler, Chem. Rev., 1995, 95, 2369–2403 CrossRef CAS.
- C. Koschnick, M. W. Terban, R. Frison, M. Etter, F. A. Böhm, D. M. Proserpio, S. Krause, R. E. Dinnebier, S. Canossa and B. V. Lotsch, J. Am. Chem. Soc., 2023, 145, 10051–10060 CrossRef CAS PubMed.
- E. M. Schmidt, P. B. Klar, Y. Krysiak, P. Svora, A. L. Goodwin and L. Palatinus, Nat. Commun., 2023, 14, 6512 CrossRef CAS PubMed.
- D. A. Keen, Crystallogr. Rev., 2020, 26, 143–201 CrossRef.
- S. J. Billinge and C. L. Farrow, J. Phys.: Condens. Matter, 2013, 25, 454202 CrossRef PubMed.
- T. Proffen, S. J. L. Billinge, T. Egami and D. Louca, Z. Kristallogr. - Cryst. Mater., 2003, 218, 132–143 CrossRef CAS.
- M. W. Terban and S. J. L. Billinge, Chem. Rev., 2022, 122, 1208–1272 CrossRef CAS PubMed.
- P. J. Chupas, K. W. Chapman and P. L. Lee, J. Appl. Crystallogr., 2007, 40, 463–470 CrossRef CAS.
- C. F. Holder and R. E. Schaak, ACS Nano, 2019, 13, 7359–7365 CrossRef CAS PubMed.
- G. S. Bauer, Nucl. Instrum. Methods Phys. Res., Sect. A, 2001, 463, 505–543 CrossRef CAS.
- M. T. Dove and G. Li, Nucl. Anal., 2022, 1, 100037 CrossRef.
- B. D. Cullity and S. R. Stock, Elements of X-ray Diffraction, Person education, 3ed edn, 2001 Search PubMed.
- J. B. S. Junior, G. R. Schleder, J. Bettini, I. C. Nogueira, A. Fazzio and E. R. Leite, Matter, 2021, 4, 441–460 CrossRef.
- A. Saha, S. S. Nia and J. A. Rodríguez, Chem. Rev., 2022, 122, 13883–13914 CrossRef CAS PubMed.
- T. E. Gorelik, R. Neder, M. W. Terban, Z. Lee, X. Mu, C. Jung, T. Jacob and U. Kaiser, Acta Crystallogr., Sect. B: Struct. Sci., 2019, 75, 532–549 CrossRef CAS PubMed.
- J. E. M. Laulainen, D. N. Johnstone, I. Bogachev, L. Longley, C. Calahoo, L. Wondraczek, D. A. Keen, T. D. Bennett, S. M. Collins and P. A. Midgley, Nanoscale, 2022, 14, 16524–16535 RSC.
- Y. Hirotsu, M. Ishimaru, T. Ohkubo, T. Hanada and M. Sugiyama, J. Electron Microsc., 2001, 50, 435–442 CrossRef CAS PubMed.
- A. F. Sapnik, C. Sun, J. E. M. Laulainen, D. N. Johnstone, R. Brydson, T. Johnson, P. A. Midgley, T. D. Bennett and S. M. Collins, Commun. Chem., 2023, 6, 92 CrossRef CAS PubMed.
- R. B. Neder and T. Proffen, J. Appl. Crystallogr., 2020, 53, 710–721 CrossRef CAS PubMed.
- O. Masson and P. Thomas, J. Appl. Crystallogr., 2013, 46, 461–465 CrossRef CAS.
- K. W. Chapman, MRS Bull., 2016, 41, 231–240 CrossRef.
- M. I. Mohideen, P. K. Allan, K. W. Chapman, J. A. Hriljac and R. E. Morris, Dalton Trans., 2014, 43, 10438–10442 RSC.
- E. S. Božin, P. Juhás and S. J. L. Billinge, Characterization of Semiconductor Heterostructures and Nanostructures: Second Edition, Elsevier, 2013 Search PubMed.
- B. Gilbert, F. Huang, H. Zhang, G. A. Waychunas and J. F. Banfield, Science, 2004, 305, 651–654 CrossRef CAS PubMed.
- I. Jolliffe in Encyclopedia of Statistics in Behavioral Science, ed. B. Everitt and D. C. Howell, Wiley, 2005, vol. 3, pp. 1580–1584 Search PubMed.
- N. Chieng, H. Trnka, J. Boetker, M. Pikal, J. Rantanen and H. Grohganz, Int. J. Pharm., 2013, 454, 167–173 CrossRef CAS.
- S. Chen, A. Y. Sheikh and R. Ho, J. Pharm. Sci., 2014, 103(12), 3879–3890 CrossRef CAS PubMed.
- K. W. Chapman, S. H. Lapidus and P. J. Chupas, J. Appl. Crystallogr., 2015, 48, 1619–1626 CrossRef CAS.
- Z. Thatcher, C. H. Liu, L. Yang, B. C. McBride, G. T. Tran, A. Wustrow, M. A. Karlsen, J. R. Neilson, D. B. Ravnsbæk and S. J. L. Billinge, Acta Crystallogr., Sect. A: Found. Crystallogr., 2022, 78, 242–248 CrossRef CAS PubMed.
- X. Hua, T. Dean, S. A. Cussen and A. L. Goodwin, J. Phys. Mater., 2023, 6, 045007 CrossRef CAS.
- P. M. Maffettone, A. C. Daly and D. Olds, Appl. Phys. Rev., 2021, 8, 041410 CAS.
- K. W. Chapman, P. J. Chupas and C. J. Kepert, J. Am. Chem. Soc., 2005, 127, 11232–11233 CrossRef CAS PubMed.
- P. Urban, A. Simonov, T. Weber and O. Oeckler, J. Appl. Crystallogr., 2015, 48, 200–211 CrossRef CAS.
- C. Koschnick, M. W. Terban, R. Frison, M. Etter, F. A. Böhm, D. M. Proserpio, S. Krause, R. E. Dinnebier, S. Canossa and B. V. Lotsch, J. Am. Chem. Soc., 2023, 145, 10051–10060 CrossRef CAS PubMed.
- T. Weber and A. Simonov, Z. Kristallogr. - Cryst. Mater., 2012, 227, 238–247 CrossRef CAS.
- T. Proffen and S. J. L. Billinge, J. Appl. Crystallogr., 1999, 32, 572–575 CrossRef CAS.
- Z. Chen, M. L. Beauvais and K. W. Chapman, J. Appl. Crystallogr., 2023, 56, 328–337 CrossRef CAS.
- H. M. A. Rietveld, J. Appl. Crystallogr., 1969, 2, 65–71 CrossRef CAS.
- B. H. Toby, Powder Diffr., 2006, 21, 67–70 CrossRef CAS.
- T. L. Christiansen, S. R. Cooper and K. M. O. Jensen, Nanoscale Adv., 2020, 2, 2234–2254 RSC.
- K. Page, T. Proffen, H. Terrones, M. Terrones, L. Lee, Y. Yang, S. Stemmer, R. Seshadri and A. K. Cheetham, Phys. Lett., 2004, 393, 385 CAS.
- S. R. Cooper, R. O. Candler, A. G. Cosby, D. W. Johnson, K. M. Jensen and J. E. Hutchison, ACS Nano, 2020, 14, 5480–5490 CrossRef CAS PubMed.
- A. R. Leach, Molecular Modelling: principles and applications, Pearson education, 2nd edn, 2003 Search PubMed.
- A. Hospital, J. R. Goñi, M. Orozco and J. L. Gelpí, Adv. Appl. Bioinf. Chem., 2015, 8, 37–47 Search PubMed.
- R. L. McGreevy and L. Pusztai, Mol. Simul., 1988, 1, 359–367 CrossRef.
- V. Guillerm and M. Eddaoudi, Acc. Chem. Res., 2021, 54(17), 3298–3312 CrossRef CAS PubMed.
- E. V. Alexandrov, Y. Yang, L. Liang, J. Wang and V. A. Blatov, CrystEngComm, 2022, 24, 2914–2924 RSC.
- G. González Miera, A. Bermejo Gómez, P. J. Chupas, B. Martín-Matute, K. W. Chapman and A. E. Platero-Prats, Inorg. Chem., 2017, 56, 4576–4583 CrossRef PubMed.
- L. Liu, Z. Chen, J. Wang, D. Zhang, Y. Zhu, S. Ling, K.-W. Huang, Y. Belmabkhout, K. Adil, Y. Zhang, B. Slater, M. Eddaoudi and Y. Han, Nat. Chem., 2019, 11, 622–628 CrossRef CAS PubMed.
- M. J. Cliffe, W. Wan, X. Zou, P. A. Chater, A. K. Kleppe, M. G. Tucker, H. Wilhelm, N. P. Funnell, F.-X. Coudert and A. L. Goodwin, Nat. Commun., 2014, 5, 4176 CrossRef CAS PubMed.
- M. Taddei, Coord. Chem. Rev., 2017, 343, 1–24 CrossRef CAS.
- Y. Yang, P. Fernández-Seriñán, I. Imaz, F. Gándara, M. Handke, B. Ortín-Rubio, J. Juanhuix and D. Maspoch, J. Am. Chem. Soc., 2023, 145(31), 17398–17405 CrossRef CAS PubMed.
- J. Albalad, H. Xu, F. Gándara, M. Haouas, C. Martineau-Corcos, R. Mas-Ballesté, S. A. Barnett, J. Juanhuix, I. Imaz and D. Maspoch, J. Am. Chem. Soc., 2018, 140(6), 2028–2031 CrossRef CAS PubMed.
- G. K. Kolea and J. J. Vittal, Chem. Soc. Rev., 2013, 42, 1755–1775 RSC.
- J. Seo, C. Bonneau, R. Matsuda, M. Takata and S. Kitagawa, J. Am. Chem. Soc., 2011, 133, 9005–9013 CrossRef CAS PubMed.
- P. K. Allan, K. W. Chapman, P. J. Chupas, J. A. Hriljac, C. L. Renouf, T. C. A. Lucas and R. E. Morris, Chem. Sci., 2012, 3, 2559–2564 RSC.
- D. Stewart, D. Antypov, M. S. Dyer, M. J. Pitcher, A. P. Katsoulidis, P. A. Chater, F. Blanc and M. J. Rosseinsky, Nat. Commun., 2017, 8, 1102–1111 CrossRef PubMed.
- A. Schneemann, V. Bon, I. Schwedler, I. Senkovska, S. Kaskel and R. A. Fischer, Chem. Soc. Rev., 2014, 43, 6062–6096 RSC.
- S. Krause, N. Hosono and S. Kitagawa, Angew. Chem., Int. Ed., 2020, 59, 15325–15341 CrossRef CAS PubMed.
- K. L. Mulfort, O. K. Farha, C. D. Malliakas, M. G. Kanatzidis and J. T. Hupp, Eur. J. Chem., 2010, 16, 276–281 CrossRef CAS PubMed.
- B. Bueken, F. Vermoortele, M. J. Cliffe, M. T. Wharmby, D. Foucher, J. Wieme, L. Vanduyfhuys, C. Martineau, N. Stock, F. Taulelle, V. Van Speybroeck, A. L. Goodwin and D. De Vos, Eur. J. Chem., 2016, 22, 3264–3267 CrossRef CAS PubMed.
- M. C. Wilding and C. J. Benmore, Rev. Mineral. Geochem., 2006, 63, 275–311 CrossRef CAS.
- T. D. Bennett, A. L. Goodwin, M. T. Dove, D. A. Keen, M. G. Tucker, E. R. Barney, A. K. Soper, E. G. Bithell, J.-C. Tan and A. K. Cheetham, Phys. Rev. Lett., 2010, 104, 115503 CrossRef PubMed.
- N. Masciocchi, F. Castelli, P. M. Forster, M. M. Tafoya and A. K. Cheetham, Inorg. Chem., 2003, 42, 6147–6152 CrossRef CAS PubMed.
- K. W. Chapman, G. J. Halder and P. J. Chupas, J. Am. Chem. Soc., 2009, 131, 17546–17547 CrossRef CAS PubMed.
- N. Masciocchi, S. Bruni, E. Cariati, F. Cariati, S. Galli and A. Sironi, Inorg. Chem., 2001, 40, 5897–5905 CrossRef CAS PubMed.
- N. Masciocchi, G. A. Ardizzoia, G. LaMonica, A. Maspero, S. Galli and A. Sironi, Inorg. Chem., 2001, 40, 6983–6989 CrossRef CAS PubMed.
- T. D. Bennett, D. A. Keen, J.-C. Tan, E. R. Barney, A. L. Good-win and A. K. Cheetham, Angew. Chem., Int. Ed., 2011, 50, 3067–3071 CrossRef CAS PubMed.
- T. D. Bennett, T. K. Todorova, E. F. Baxter, D. G. Reid, C. Ger-vais, B. Bueken, B. Van de Voorde, D. De Vos, D. A. Keen and C. Mellot-Draznieks, Phys. Chem. Chem. Phys., 2016, 18, 2192–2201 RSC.
- T. D. Bennett, J.-C. Tan, Y. Yue, E. Baxter, C. Ducati, N. J. Terrill, H. H.-M. Yeung, Z. Zhou, W. Chen, S. Henke, A. K. Cheetham and G. N. Greaves, Nat. Commun., 2015, 6, 1–7 Search PubMed.
- T. D. Bennett, Y. Yue, P. Li, A. Qiao, H. Tao, N. G. Greaves, T. Richards, G. I. Lampronti, S. A. T. Redfern, F. Blanc, O. K. Farha, J. T. Hupp, A. K. Cheetham and D. A. Keen, J. Am. Chem. Soc., 2016, 138, 3484–3492 CrossRef CAS PubMed.
- C. Zhou, L. Longley, A. Krajnc, G. J. Smales, A. Qiao, I. Erucar, C. M. Doherty, A. W. Thornton, A. J. Hill, C. W. Ashling, O. T. Qazvini, S. J. Lee, P. A. Chater, N. J. Terrill, A. J. Smith, Y. Yue, G. Mali, D. A. Keen, S. G. Telfer and T. D. Bennett, Nat. Commun., 2018, 9, 5042 CrossRef PubMed.
- L. Frentzel-Beyme, M. Kloß, R. Pallach, S. Salamon, H. Mold-enhauer, J. Landers, H. Wende, J. Debus and S. Henke, J. Mater. Chem. A, 2019, 7, 985–990 RSC.
- J. Hou, C. W. Ashling, S. M. Collins, A. Krajnc, C. Zhou, L. Longley, D. N. Johnstone, P. A. Chater, S. Li, M.-V. Coulet, P. L. Llewellyn, F.-X. Coudert, D. A. Keen, P. A. Midgley, G. Mali, V. Chen and T. D. Bennett, Nat. Commun., 2019, 10, 2580 CrossRef PubMed.
- R. Gaillac, P. Pullumbi, K. A. Beyer, K. W. Chapman, D. A. Keen, T. D. Bennett and F.-X. Coudert, Nat. Mater., 2017, 16, 1149–1154 CrossRef CAS PubMed.
- N. Giri, M. G. Del Pópolo, G. Melaugh, R. L. Greenaway, K. Rätzke, T. Koschine, L. Pison, M. F. C. Gomes, A. I. Cooper and S. L. James, Nature, 2015, 527, 216–220 CrossRef CAS PubMed.
- L. Longley, S. M. Collins, C. Zhou, G. J. Smales, S. E. Norman, N. J. Brownbill, C. W. Ashling, P. A. Chater, R. Tovey, C.-B. Schönlieb, T. F. Headen, N. J. Terrill, Y. Yue, A. J. Smith, F. Blanc, D. A. Keen, P. A. Midgley and T. D. Bennett, Nat. Commun., 2018, 9, 2135 CrossRef PubMed.
- L. Longley, S. M. Collins, S. Li, G. J. Smales, I. Erucar, A. Qiao, J. Hou, C. M. Doherty, A. W. Thornton, A. J. Hill, X. Yu, N. J. Terrill, A. J. Smith, S. M. Cohen, P. A. Midgley, D. A. Keen, S. G. Telfer and T. D. Bennett, Chem. Sci., 2019, 10, 3592–3601 RSC.
- A. I. Nguyen, K. M. V. Allsburg, M. W. Terban, M. Bajdich, J. Oktawiec, J. Amtawong, M. S. Ziegler, J. P. Dombrowski, K. V. Lakshmi, W. S. Drisdell, J. Yano, S. J. L. Billinge and T. D. Tilley, Proc. Natl. Acad. Sci. U. S. A., 2019, 116, 11630–11639 CrossRef CAS PubMed.
- C. D. Malonzo, Z. Wang, J. Duan, W. Zhao, T. E. Webber, Z. Li, I. S. Kim, A. Kumar, A. Bhan, A. E. Platero-Prats, K. W. Chapman, O. K. Farha, J. T. Hupp, A. B. F. Martinson, R. L. Penn and A. Stein, Inorg. Chem., 2018, 57, 2782–2790 CrossRef CAS PubMed.
- C. D. Malonzo, S. M. Shaker, L. Ren, S. D. Prinslow, A. E. Platero-Prats, L. C. Gallington, J. Borycz, A. B. Thompson, T. C. Wang, O. K. Farha, J. T. Hupp, C. C. Lu, K. W. Chapman, J. C. Myers, R. L. Penn, L. Gagliardi, M. Tsapatsis and A. Stein, J. Am. Chem. Soc., 2016, 138, 2739–2748 CrossRef CAS PubMed.
- W. Zhao, Z. Wang, C. D. Malonzo, T. E. Webber, A. E. Platero-Prats, F. Sotomayor, N. A. Vermeulen, T. C. Wang, J. T. Hupp, O. K. Farha, R. L. Penn, K. W. Chapman, M. Thommes and A. Stein, Chem. Mater., 2018, 30, 1301–1315 CrossRef CAS.
- G. S. Day, J. Li, E. A. Joseph, P. C. Metz, Z. Perry, M. R. Ryder, K. Page and H.-C. Zhou, Nanoscale Adv., 2020, 2, 2758–2767 RSC.
- B. A. Frandsen and S. J. L. Billinge, Acta Crystallogr., 2015, A71, 325–334 CrossRef PubMed.
- L. Ascherl, T. Sick, J. T. Margraf, S. H. Lapidus, M. Calik, C. Hettstedt, K. Karaghiosoff, M. Döblinger, T. Clark, K. W. Chapman, F. Auras and T. Bein, Nat. Chem., 2016, 8, 310–316 CrossRef CAS.
- A. M. Pütz, M. W. Terban, S. Bette, F. Haase, R. E. Dinnebier and B. V. Lotsch, Chem. Sci., 2020, 11, 12647–12654 RSC.
- H. Schlomberg, J. Kröger, G. Savasci, M. W. Terban, S. Bette, I. Moudrakovski, V. Duppel, F. Podjaski, R. Siegel, J. Senker, R. E. Dinnebier, C. Ochsenfeld and B. V. Lotsch, Chem. Mater., 2019, 31, 7478–7486 CrossRef CAS PubMed.
- L. Grunenberg, G. Savasci, M. W. Terban, V. Duppel, I. Moudrakovski, M. Etter, R. E. Dinnebier, C. Ochsenfeld and B. V. Lotsch, J. Am. Chem. Soc., 2021, 143, 3430–3438 CrossRef CAS PubMed.
- A. E. Platero-Prats, A. Mavrandonakis, L. C. Gallington, Y. Liu, J. T. Hupp, O. K. Farha, C. J. Cramer and K. W. Chapman, J. Am. Chem. Soc., 2016, 138, 4178–4185 CrossRef CAS PubMed.
- C. Koschnick, R. Stäglich, T. Scholz, M. W. Terban, A. von Mankowski, G. Savasci, F. Binder, A. Schökel, M. Etter, J. Nuss, R. Siegel, L. S. Germann, C. Ochsenfeld, R. E. Dinnebier, J. Senker and B. V. Lotsch, Nat. Commun., 2021, 12, 3099–4007 CrossRef CAS PubMed.
- D. F. Sava Gallis, D. J. Vogel, G. A. Vincent, J. M. Rimsza and T. M. Nenoff, ACS Appl. Mater. Interfaces, 2019, 11, 43270–43277 CrossRef CAS PubMed.
- M. W. Terban, D. Banerjee, S. Ghose, B. Medasani, A. Shukla, B. A. Legg, Y. Zhou, Z. Zhu, M. L. Sushko, J. J. De Yoreo, J. Liu, P. K. Thallapally and S. J. L. Billinge, Nanoscale, 2018, 10, 4291–4300 RSC.
- D. Ma, A. D. Stoica, X.-L. Wang, Z. P. Lu and T. Proffen, Appl. Phys. A: Mater. Sci. Process., 2010, 99, 537–542 CrossRef CAS.
- P. J. Chupas, S. Chaudhuri, J. C. Hanson, X. Qiu, P. L. Lee, S. D. Shastri, S. J. L. Billinge and C. P. Grey, J. Am. Chem. Soc., 2004, 126, 4756–4757 CrossRef CAS PubMed.
- J. Becker, M. Bremholm, C. Tyrsted, B. Pauw, K. M. Ø. Jensen, J. Eltzholt, M. Christensen and B. B. Iversen, J. Appl. Crystallogr., 2010, 43, 729–736 CrossRef CAS.
- H. Xu, S. Sommer, N. L. N. Broge, J. Gao and B. B. Iversen, Eur. J. Chem., 2019, 25, 2051–2058 CrossRef CAS PubMed.
- J. H. Cavka, S. Jakobsen, U. Olsbye, N. Guillou, C. Lamberti, S. Bordiga and K. P. Lillerud, J. Am. Chem. Soc., 2008, 130, 13850–13851 CrossRef PubMed.
- M. Puchberger, F. R. Kogler, M. Jupa, S. Gross, H. Fric, G. Kickelbick and U. Schubert, Eur. J. Inorg. Chem., 2006, 3283–3293 CrossRef CAS.
- F. C. N. Firth, M. W. Gaultois, Y. Wu, J. M. Stratford, D. S. Keeble, C. P. Grey and M. J. Cliffe, J. Am. Chem. Soc., 2021, 143, 19668–19683 CrossRef CAS PubMed.
- E. D. Bøjesen and B. B. Iversen, CrystEngComm, 2016, 18, 8332–8353 RSC.
- V. Pascanu, Q. Yao, A. Bermejo Gómez, M. Gustafsson, Y. Yun, W. Wan, L. Samain, X. Zou and B. Martín-Matute, Eur. J. Chem., 2013, 19, 17483–17493 CrossRef CAS PubMed.
- M. Rivera-Torrente, M. Filez, R. Hardian, E. Reynolds, B. Seoane, M.-V. Coulet, F. E. Oropeza Palacio, J. P. Hofmann, R. A. Fischer, A. L. Goodwin, P. L. Llewellyn and B. M. Weckhuysen, Eur. J. Chem., 2018, 24, 7498–7506 CrossRef CAS PubMed.
- A. E. Platero-Prats, Z. Li, L. C. Gallington, A. W. Peters, J. T. Hupp, O. K. Farha and K. W. Chapman, Faraday Discuss., 2017, 201, 337–350 RSC.
- M. R. Mian, L. R. Redfern, S. M. Pratik, D. Ray, J. Liu, K. B. Idrees, T. Islamoglu, L. Gagliardi and O. K. Farha, Chem. Mater., 2020, 32, 3078–3086 CrossRef CAS.
- I. S. Kim, Z. Li, J. Zheng, A. E. Platero-Prats, A. Mavrandonakis, S. Pellizzeri, M. Ferrandon, A. Vjunov, L. C. Gallington, T. E. Webber, N. A. Vermeulen, R. L. Penn, R. B. Getman, C. J. Cramer, K. W. Chapman, D. M. Camaioni, J. L. Fulton, J. A. Lercher, O. K. Farha, J. T. Hupp and A. B. F. Martinson, Angew. Chem., Int. Ed., 2018, 57, 909–913 CrossRef CAS PubMed.
- S. Goswami, H. Noh, L. R. Redfern, K.-I. Otake, C.-W. Kung, Y. Cui, K. W. Chapman, O. K. Farha and J. T. Hupp, Chem. Mater., 2019, 31, 1485–1490 CrossRef CAS.
- J. D. Butson, H. Kim, K. Murugappan, M. Saunders, C. E. Buckley, D. S. Silvester and P. Á. Szilágyi, ChemPhysChem, 2019, 20, 745–751 CrossRef CAS PubMed.
- Z. Chen, Z. Chen, O. K. Farha and K. W. Chapman, J. Am. Chem. Soc., 2021, 143, 8976–8980 CrossRef CAS PubMed.
- Y. Benseghir, A. Lemarchand, M. Duguet, P. Mialane, M. Gomez-Mingot, C. Roch-Marchal, T. Pino, M.-H. Ha-Thi, M. Haouas, M. Fontecave, A. Dolbecq, C. Sassoye and C. Mellot-Draznieks, J. Am. Chem. Soc., 2020, 142, 9428–9438 CrossRef CAS PubMed.
- M. Duguet, A. Lemarchand, Y. Benseghir, P. Mialane, M. Gomez-Mingot, C. Roch-Marchal, M. Haouas, M. Fontecave, C. Mellot-Draznieks, C. Sassoye and A. Dolbecq, Chem. Commun., 2020, 56, 10143–10146 RSC.
- I. S. Kim, J. Borycz, A. E. Platero-Prats, S. Tussupbayev, T. C. Wang, O. K. Farha, J. T. Hupp, L. Gagliardi, K. W. Chapman, C. J. Cramer and A. B. F. Martinson, Chem. Mater., 2015, 27, 4772–4778 CrossRef CAS.
- M. Rimoldi, V. Bernales, J. Borycz, A. Vjunov, L. C. Gallington, A. E. Platero-Prats, I. S. Kim, J. L. Fulton, A. B. F. Martinson, J. A. Lercher, K. W. Chapman, C. J. Cramer, L. Gagliardi, J. T. Hupp and O. K. Farha, Chem. Mater., 2017, 29, 1058–1068 CrossRef CAS.
- J. Liu, L. R. Redfern, Y. Liao, T. Islamoglu, A. Atilgan, O. K. Farha and J. T. Hupp, ACS Appl. Mater. Interfaces, 2019, 11, 47822–47829 CrossRef CAS PubMed.
- A. E. Platero-Prats, A. B. League, V. Bernales, J. Ye, L. C. Gallington, A. Vjunov, N. M. Schweitzer, Z. Li, J. Zheng, B. L. Mehdi, A. J. Stevens, A. Dohnalkova, M. Balasubramanian, O. K. Farha, J. T. Hupp, N. D. Browning, J. L. Fulton, D. M. Camaioni, J. A. Lercher, D. G. Truhlar, L. Gagliardi, C. J. Cramer and K. W. Chapman, J. Am. Chem. Soc., 2017, 139, 10410–10418 CrossRef CAS PubMed.
- C. Castillo-Blas, I. Romero-Muñiz, A. Mavrandonakis, L. Simonelli and A. E. Platero-Prats, Chem. Commun., 2020, 56, 15615–15618 RSC.
- J. D. Howe, C. R. Morelock, Y. Jiao, K. W. Chapman, K. S. Walton and D. S. Sholl, J. Phys. Chem. C, 2017, 121, 627–635 CrossRef CAS.
- I. Romero-Muñiz, A. Mavrandonakis, P. Albacete, A. Vega, V. Briois, F. Zamora and A. E. Platero-Prats, Angew. Chem., Int. Ed., 2020, 59, 13013–13020 CrossRef PubMed.
- I. Romero-Muñiz, P. Albacete, A. E. Platero-Prats and F. Zamora, ACS Appl. Mater. Interfaces, 2021, 13, 54106–54112 CrossRef PubMed.
- A. Lopez-Magano, A. E. Platero-Prats, S. Cabrera, R. Mas-Balleste and J. Aleman, Appl. Catal., B, 2020, 272, 119027 CrossRef CAS.
- J. Albalad, C. J. Sumby, D. Maspoch and C. J. Doonan, CrystEngComm, 2021, 23, 2185 RSC.
- K. W. Chapman, D. F. Sava, G. J. Halder, P. J. Chupas and T. M. Nenoff, J. Am. Chem. Soc., 2011, 133, 18583–18585 CrossRef CAS PubMed.
- D. F. Sava, M. A. Rodriguez, K. W. Chapman, P. J. Chupas, J. A. Greathouse, P. S. Crozier and T. M. Nenoff, J. Am. Chem. Soc., 2011, 133, 12398–12401 CrossRef CAS PubMed.
- D. F. Sava, K. W. Chapman, M. A. Rodriguez, J. A. Greathouse, P. S. Crozier, H. Zhao, P. J. Chupas and T. M. Nenoff, Chem. Mater., 2013, 25, 2591–2596 CrossRef CAS.
- D. F. Sava Gallis, I. Ermanoski, J. A. Greathouse, K. W. Chapman and T. M. Nenoff, Ind. Eng. Chem. Res., 2017, 56, 2331–2338 CrossRef CAS.
- I. Kanoya, T. Furuta, R. Sakamoto, M. Hosoe, M. Ichikawa, K. Itoh and T. Fukunaga, J. Appl. Phys., 2010, 108, 074310 CrossRef.
- P. K. Allan, P. S. Wheatley, D. Aldous, M. I. Mohideen, C. Tang, J. A. Hriljac, I. L. Megson, K. W. Chapman, G. De Weireld, S. Vaesen and R. E. Morris, Dalton Trans., 2012, 41, 4060–4066 RSC.
- A. J. Howarth, M. J. Katz, T. C. Wang, A. E. Platero-Prats, K. W. Chapman, J. T. Hupp and O. K. Farha, J. Am. Chem. Soc., 2015, 137, 7488–7494 CrossRef CAS PubMed.
- S. Rangwani, A. J. Howarth, M. R. DeStefano, C. D. Malliakas, A. E. Platero-Prats, K. W. Chapman and O. K. Farha, Polyhedron, 2018, 151, 338–343 CrossRef CAS.
- M. W. Terban, S. K. Ghose, A. M. Plonka, D. Troya, P. Juhás, R. E. Dinnebier, J. J. Mahle, W. O. Gordon and A. I. Frenkel, Commun. Chem., 2021, 4, 1–10 CrossRef PubMed.
- D. F. Sava Gallis, K. W. Chapman, M. A. Rodriguez, J. A. Greathouse, M. V. Parkes and T. M. Nenoff, Chem. Mater., 2016, 28, 3327–3336 CrossRef CAS.
- M. C. Simons, J. G. Vitillo, M. Babucci, A. S. Hoffman, A. Boubnov, M. L. Beauvais, Z. Chen, C. J. Cramer, K. W. Chapman, S. R. Bare, B. C. Gates, C. C. Lu, L. Gagliardi and A. Bhan, J. Am. Chem. Soc., 2019, 141, 18142–18151 CrossRef CAS PubMed.
- A.-C. Dippel, H.-P. Liermann, J. T. Delitz, P. Walter, H. Schulte-Schrepping, O. Seeck and H. Franz, J. Synchrotron Radiat., 2015, 22, 675–687 CrossRef CAS PubMed.
- J. P. Sutter, P. A. Chater, M. R. Hillman, D. S. Keeble, M. G. Tucker and H. Wilhelm, AIP Conf. Proc., 2016, 1741, 040005 CrossRef.
- W. Xu and O. Borkiewicz, Acta Crystallogr., Sect. A: Found. Adv., 2018, A74, a456 Search PubMed.
- A. Schökel, M. Etter, A. Berghäuser, A. Horst, D. Lindackers, T. A. Whittle, S. Schmid, M. Acosta, M. Knapp, H. Ehrenberg and M. Hinterstein, J. Synchrotron Radiat., 2020, 28, 146–157 CrossRef PubMed.
- T. Proffen, S. Billinge, T. Egami and D. Louca, Z. Kristallogr. - Cryst. Mater., 2003, 218, 132–143 CrossRef CAS.
- P. Juhás, T. Davis, C. L. Farrow and S. J. Billinge, J. Appl. Crystallogr., 2013, 46, 560–566 CrossRef.
- X. Yang, P. Juhas, C. L. Farrow and S. J. Billinge, arXiv, 2014, preprint DOI:10.48550/arXiv.1402.3163.
- X. Qiu, J. W. Thompson and S. J. Billinge, J. Appl. Crystallogr., 2004, 37, 678 CrossRef CAS.
- B. H. Toby and R. B. Von Dreele, J. Appl. Crystallogr., 2013, 46, 544–549 CrossRef CAS.
- A. A. Coelho, J. Appl. Crystallogr., 2018, 51, 210–218 CrossRef CAS.
- S. Kuhn, Magn. Reson. Chem., 2022, 60, 1019–1020 CrossRef CAS PubMed.
- A. Howarth, K. Ermanis and J. M. Goodman, Chem. Sci., 2020, 11, 4351 RSC.
- B. D. Lee, J.-W. Lee, J. Ahn, S. Kim, W. B. Park and K.-S. So, Adv. Intell. Syst., 2023, 5, 2300140 CrossRef.
- C.-H. Liu, Y. Tao, D. Hsu, Q. Du and S. J. L. Billinge, Acta Crystallogr., 2019, A75, 633–643 CrossRef PubMed.
- A. S. Anker, E. T. S. Kjær, M. Juelsholt, T. L. Christiansen, S. L. Skjærvø, M. R. V. Jørgensen, I. Kantor, D. R. Sørensen, S. J. L. Billinge, R. Selvan and K. M. Ø. Jensen, npj Comput. Mater., 2022, 8, 213 CrossRef.
- S. Banerjee, C.-H. Liu, K. M. Ø. Jensen, P. Juhas, J. D. Lee, M. Tofanelli, C. J. Ackerson, C. B. Murray and S. J. L. Billinge, Acta Crystallogr., Sect. A: Found. Adv., 2020, 76, 24–31 CrossRef CAS PubMed.
- L. Yang, E. A. Culbertson, N. K. Thomas, H. T. Vuong, E. T. S. Kjær, K. M. Ø. Jensen, M. G. Tucker and S. J. L. Billinge, Acta Crystallogr., 2021, A77, 2–6 CrossRef PubMed.
- K. W. Chapman, S. H. Lapidus and P. J. Chupas, J. Appl. Crystallogr., 2015, 48, 1619–1626 CrossRef CAS.
- J. M. Cole, X. Cheng and M. C. Payne, Inorg. Chem., 2016, 55, 10870–10880 CrossRef CAS PubMed.
- H. S. Geddes, H. Blade, J. F. McCabe, L. P. Hughes and A. L. Goodwin, Chem. Commun., 2019, 55, 13346–13349 RSC.
- A. F. Sapnik, I. Bechis, A. M. Bumstead, T. Johnson, D. A. Keen, K. E. Jelfs and T. D. Bennett, Nat. Commun., 2022, 13, 2173 CrossRef CAS PubMed.
- M. Matsushita, Y. Hirotsu, K. Anazawa, T. Ohkubo and T. Oikawa, Mater. Trans., 1995, 36, 822–827 CrossRef CAS.
- J. B. S. Junior, G. R. Schleder, F. M. Colombari, M. A. de Farias, J. Bettini, M. van Heel, R. V. Portugal, A. Fazzio and E. R. Leite, J. Phys. Chem. Lett., 2020, 11(4), 1564–1569 CrossRef PubMed.
- T. E. Gorelik, M. U. Schmidt, U. Kolb and S. J. L. Billinge, Microsc. Microanal., 2015, 21, 459–471 CrossRef CAS PubMed.
- H. L. Nguyen, Chem. Sci., 2021, 12, 8632–8647 RSC.
- Z. Huang, E. Svensson Grape, J. Li, A. K. Inge and X. Zou, Coord. Chem. Rev., 2021, 427, 213583 CrossRef CAS.
- D. Rodríguez-San-Miguel and F. Zamora, Chem. Soc. Rev., 2019, 48, 4375–4386 RSC.
- D. G. Madden, R. Babu, C. Çamur, N. Rampal, J. Silvestre-Albero, T. Curtin and D. Fairen-Jimenez, Faraday Discuss., 2021, 231, 51–65 RSC.
- J. Troyano, C. Çamur, L. Garzón-Tovar, A. Carné-Sánchez, I. Imaz and D. Maspoch, Acc. Chem. Res., 2020, 53, 1206–1217 CrossRef CAS PubMed.
- J. Á. Martín-Illán, J. A. Suárez, J. Gómez-Herrero, P. Ares, D. Gallego-Fuente, Y. Cheng, D. Zhao, D. Maspoch and F. Zamora, Adv. Sci., 2022, 9, 2104643 CrossRef PubMed.
- M. Fang, C. Montoro and M. Semsarilar, Membranes, 2020, 10, 107 CrossRef CAS PubMed.
- S. Qiu, M. Xue and G. Zhu, Chem. Soc. Rev., 2014, 43, 6116 RSC.
- J. Á. Martín-Illán, D. Rodríguez-San-Miguel, O. Castillo, G. Beobide, J. Perez-Carvajal, I. Imaz, D. Maspoch and F. Zamora, Angew. Chem., Int. Ed., 2021, 60, 13969–13977 CrossRef PubMed.
- D. Zhu, Y. Zhu, Q. Yan, M. Barnes, F. Liu, P. Yu, C.-P. Tseng, N. Tjahjono, P.-C. Huang, M. M. Rahman, E. Egap, P. M. Ajayan and R. Verduzco, Chem. Mater., 2021, 33, 4216–4224 CrossRef CAS.
- C. Castillo-Blas, A. M. Chester, R. P. Cosquer, A. F. Sapnik, L. Corti, R. Sajzew, B. Poletto-Rodrigues, G. P. Robertson, D. J. M. Irving, L. N. McHugh, L. Wondraczek, F. Blanc, D. A. Keen and T. D. Bennett, J. Am. Chem. Soc., 2023, 145, 22913–22924 CrossRef CAS PubMed.
- A. Brand, L. Allen, M. Altman, M. Hlava and J. Scott, Learn. Publ., 2015, 28, 151–155 CrossRef.
| This journal is © The Royal Society of Chemistry 2024 |


