 Open Access Article
Creative Commons Attribution 3.0 Unported Licence
Advancing catalysis research through FAIR data principles implemented in a local data infrastructure – a case study of an automated test reactor†
Abdulrhman
Moshantaf
a,
Michael
Wesemann
a,
Simeon
Beinlich
a,
Heinz
Junkes
 a,
Julia
Schumann
 ab,
Baris
Alkan
ac,
Pierre
Kube
a,
Clara Patricia
Marshall
a,
Nils
Pfister
a and
Annette
Trunschke
 *a
*a
aFritz-Haber-Institut der Max-Planck-Gesellschaft, Department of Inorganic Chemistry, Faradayweg 4-6, D-14195 Berlin, Germany. E-mail: trunschke@fhi-berlin.mpg.de
bConsortium FAIRmat, c/o Physics Department and CSMB, Humboldt-Universität zu Berlin, Zum Großen Windkanal 2, 12489 Berlin, Germany
cMax-Planck-Institut für Chemische Energiekonversion, Stiftstrasse 34 - 36, 45470 Mülheim an der Ruhr, Germany
First published on 27th August 2024
Abstract
Findable, accessible, interoperable, and reusable (FAIR) data is currently emerging as an indispensable element in the advancement of science and requires the development of new methods for data acquisition, storage and sharing. This is becoming even more critical as the increasing application of artificial intelligence demands significantly higher data quality in terms of reliability, reproducibility and consistency of datasets. This paper presents methods for the digital and automatic acquisition and storage of data and metadata in catalysis experiments based on open-source software solutions. The successful implementation of a digitalization concept, which includes working according to machine-readable standard operating procedures (SOPs) is outlined using a reactor for catalytic tests that has been automated with the open source software tool EPICS (Experimental Physics and Industrial Control System). The process of data acquisition, standardized analysis, upload to a database and generation of relationships between database entries is fully automated. Application programming interfaces (APIs) have been developed to enable data exchange within the local data infrastructure and beyond to overarching repositories, paving the way for autonomous catalyst discovery and machine learning applications.
Introduction
Catalysis science is currently undergoing a shift towards digital research,1–8 characterized by the transition to consistent publication of data and metadata guided by the FAIR principles.9 This transformation process requires the establishment of robust local and overarching research data infrastructures to enable easy storage and exchange of data. Essential to this evolution is the detailed documentation of all experiments, encompassing the sequence of experimental steps (workflows) and the comprehensive storage of both data and metadata. Complete data sets are crucial for ensuring the reproducibility of experiments,10 supporting further data processing through theory and data science methods, and facilitating the practical implementation of catalytic processes.To alleviate the growing workload of scientists, simplify compliance with standard operating procedures (SOPs),10 and ensure consistency of data sets, automation is a proven concept and a key milestone on the evolution towards autonomous research.11–15 Autonomous catalyst discovery means that a target variable, such as a rate or selectivity in a particular catalysed reaction, can be optimized independently and adapted in multiple feedback loops by identifying and improving a catalyst without human control or detailed programming based on innovative technologies in the fields of automation, robotics and computer science, i.e., based on an integrated artificial intelligence approach. To make this possible, the first step is the automation of all work steps in catalysis research, from materials synthesis to testing and characterization, including, for example, data evaluation,15,16 consideration of safety requirements or the supply of chemicals, which is a challenge given the complexity of heterogeneous catalysis.12
Automation is already particularly advanced in catalyst testing and commercial solutions are available. However, commercial instruments often cannot be integrated into local automation concepts as they use proprietary software and interfaces are frequently not disclosed. In addition, these instruments typically only perform the experiment automatically and do not correlate the result with other information. However, linking all available catalyst data, e.g., on its synthesis, the chemicals used, its pretreatment history, and (operando) spectroscopic and analytical data with the kinetic results, is necessary to generate knowledge by both humans and AI. The creation of visualizations of these links, e.g., through the generation of knowledge graphs, already facilitates the work of the researcher considerably, even if the goal of autonomous catalyst development cannot or cannot yet be achieved.
This paper presents a concept for the automatic recording and storage of catalyst data using EPICS,17 an open-source control system and a local Electronic Laboratory Notebook (ELN) in conjunction with a repository (AC/CATLAB Archive).8,18 Even though we focus on open-source software, other commonly used commercial automation tools, such as LabView, can also be integrated. The term automatic, as used here, means that not only the kinetic measurement is executed automatically, but also that an automatic standardized data analysis is carried out, the raw data, the evaluated data, the metadata, and data on the measurement method are automatically uploaded to a database in a structured, machine-readable form, where they are finally correctly linked without human involvement with all information on the experiment, such as gases used or information on the reactor and the measurement procedure, and with other information already available in a database on the catalyst under investigation, such as catalyst synthesis. The concept is demonstrated by the development of an automated test reactor for the catalytic decomposition of ammonia into hydrogen and nitrogen.
Ammonia reforming is currently the subject of intense research as it could play a crucial role in a future hydrogen-based energy economy for the chemical storage and transportation of green hydrogen.19,20 Despite this interesting use case, cost-effective, energy-saving and stable catalysts are not yet available for large-scale industrial application. The reasons for this are of technical nature, but there are also gaps in fundamental understanding of the underlying processes.20–26 In the present work, the selection of a classical nickel catalyst serves as a practical example to illustrate the functionality of the reactor designed for automated catalyst testing as well as standardized data evaluation and storage. First, however, we provide a brief overview of conceptual ideas on general data management schemes in the context of catalysis research.
Data management concept
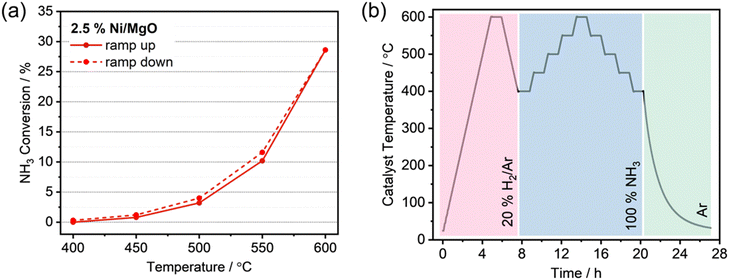
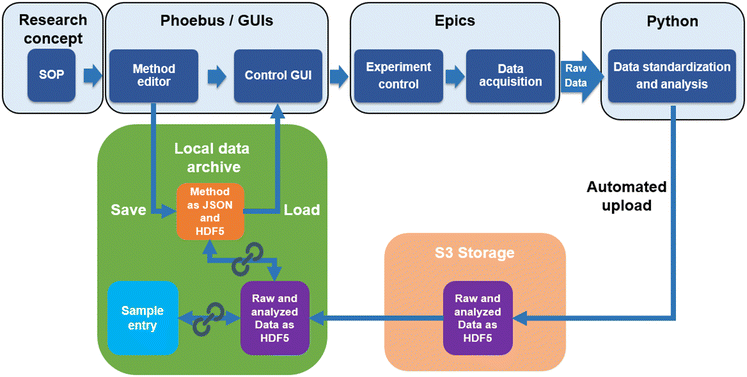
Catalysis research is an interdisciplinary field yielding a wide array of data types.8 The main focus is on kinetic data, which provide information on how quickly the chemical equilibrium is reached in certain reactions. The kinetics are closely linked to the catalyst properties and various process parameters such as temperature, pressure and chemical potential. Deciphering the complicated structure–function correlations is difficult, as the parameters are entangled in non-linear relationships.27–30 The greatest challenge here is the dynamic coupling between the catalyst and the reacting medium, which leads to chemical changes of the interface under reaction conditions.27,29 As a consequence, kinetic experiments do not always show unambiguous results, because the measured rate depends not only on the catalyst and the reaction parameters, but also on the experimental workflow, even if data are collected in the steady-state.10 For example, in ammonia decomposition, the ammonia conversion can vary depending on whether the data was measured with ascending or descending temperature (Fig. 1a). The differences can be attributed to further changes of the catalysts, for example in the degree of reduction, the particle size distribution or the formation of new (surface) phases. These changes may occur at the highest reaction temperature although the catalyst was in steady-state at lower reaction temperatures (Fig. 1b). Effects such as those illustrated in Fig. 1a could be the reason for conflicting data in the literature, such as different rates measured for catalysts with apparently the same composition and structural as well as morphological characteristics.24,25 The causes of these inconsistencies are often impossible to identify because information about the experiment is not standardised in publications and is therefore often biased and incomplete. The current state of data infrastructure in catalysis and particular challenges such as unpublished negative results, the complexity and diversity of data, as well as their limited reproducibility, retrievability and reusability, have recently been discussed in several conceptual papers.1,4,5,8,10,31–33 Deficiencies in the data quality and structure lead to difficulties when using such data for evaluation with machine learning methods. These can be prevented if catalysis experiments are carried out according to SOPs, which are documented in handbooks10 and published together with the results. A SOP for rapid catalytic tests in ammonia decomposition is shown in Fig. 1b (see also the entry P12 in an example database created for this publication, which can be accessed via the link https://haber.archive.fhi.mpg.de).The automatic capture of data and its digital storage facilitates the use of SOPs and, at the same time, prepares the way for autonomous catalysis research.12 The underlying data management concept that ensures the implementation of automation and SOPs is shown in Fig. 2. A dedicated local data archive, hereinafter also referred to as database, (AC/CATLAB Archive, green field in Fig. 2) has been developed to enable the storage and retrieval of data and metadata.18 The workflow in the data management concept is implemented not only for catalytic tests, but also for automated catalyst synthesis and characterization.
SOPs should be defined at the conceptual stage of research projects for all methods expected to be used in the corresponding investigation (Fig. 2). First experience of working according to SOPs, also in inter-laboratory collaboration,10 was gained in a joint project between the Fritz-Haber-Institut and the BasCat laboratory of BASF at the Technical University of Berlin on the selective oxidation of ethane, propane and n-butane with mixed oxide catalysts. The database was already available, but the automation tools presented here were not. This led to frequent repetition of measurements when manual experiments were not followed exactly, and required a great deal of effort to synchronise the data structures. However, the effort was worth it, as it has enabled the experimental data to be analysed using interpretable machine learning methods, providing new insights that go beyond established concepts in oxidation catalysis.30 These new insights and the immense reduction in workload resulting from the automation presented here have led to a growing acceptance of the new way of working, which has led to further projects following the example of the oxidation project mentioned above.
The handbook developed for ammonia decomposition can be found in the form of a text in the entry P12 of the example database. Best practices for experimental measurements and data analysis are described and the minimum number of measurements to be performed, including the measurement parameters to be applied, are specified.
However, machine-readable handbooks are the preferred solution compared to plain text. Therefore, method editors were developed that empower users to input all experimental parameters through intuitive graphical user interfaces (GUIs). Subsequently, the method information is stored in the data archive in form of sustainable, machine-readable data formats such as JavaScript Object Notation (JSON) and Hierarchical Data Format 5 (HDF5), ensuring accessibility for reuse (Fig. 2). JSON is utilized for method data, because it is a web interface friendly format and makes searching for data in an archive much easier, for example, by searching for a data entry that contains a specific parameter with a specific value, like a heating or flow rate or a feed composition. The additional storage in an HDF5 file format serves to ensure consistency with the raw data storage, which also takes place in HDF5 format, whereby a specific data structure is defined.
Experiments can be started by loading the method in a graphical user interface for experiment control (Fig. 2). The control system software EPICS takes over the communication with the hardware devices and sends the setpoints according to the selected method. The control system software is also responsible for collecting data from the sensors and analyzers. Python scripts have been developed for uploading the raw data of the experiment to an S3 storage and a data archive entry, which is automatically generated by the system, and for performing an initial standardized data analysis. This analyzed data is also uploaded to the experiment entry in the data archive and automatically linked by the system to other database entries that belong to the experiment. These entries include, for example, the catalyst sample entry, in which all details about the catalyst synthesis are summarized, the gases and the configuration of the test reactor used in the experiment, and the workflow of the experiment documented in the method file. The concept shown in Fig. 2 is explained in more detail below, using the example of a fully automated reactor for rapid testing of catalysts for ammonia decomposition. Detailed information on the automation tools, the instruments used in the catalyst test reactor and some information on the catalyst prepared for the tests to illustrate the function of the system can be found in the ESI.†
Configuration of a reactor for catalyst tests and automatic data storage
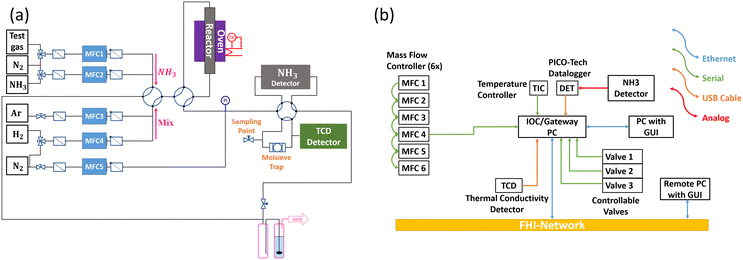
The reactor (“Haber”)34 is designed for rapid testing of the performance of catalysts in ammonia decomposition. The setup contains six mass flow controllers for different gases, which can be used for reductive pretreatment of the catalyst, for testing ammonia decomposition in pure and diluted ammonia and for calibrating the detectors (Fig. 3a). The quartz glass reactor tube can be inserted into a furnace. Both, the furnace temperature and the temperature in the catalyst bed are measured using thermocouples. Due to the endothermicity of the reaction, the temperature of the furnace is just recorded and the temperature in the catalyst bed serves as feedback for the controller. The temperature profile of the reactor filled with SiC is presented in the ESI,† Fig. S1. One controllable valve is used to switch between argon–hydrogen mixtures and ammonia, depending on the phase of the experiment, i.e., pretreatment or catalytic test. Another controllable valve is used to either direct the gas flow through the catalyst bed or bypass the reactor. The effluent gas after the reactor can be diluted with nitrogen and analyzed either with a thermal conductivity detector (TCD) to measure the hydrogen concentration during the reductive pretreatment of the catalysts or with an infrared detector to measure the residual ammonia concentration (NH3 detector) in the ammonia decomposition experiments. The third controllable valve serves to switch between the two detectors. The connection of a mass spectrometer is also foreseen (sampling point). A molecular sieve trap is located in front of the TCD detector to separate water formed in the reduction prior to analysis of hydrogen. The effluent gas is purified of possible residual concentrations of ammonia before it is released into the exhaust system.All devices are connected by a so-called EPICS single input–output controller (IOC). In the present case, the IOC is executed on a Linux gateway computer (gateway between the internal network of the Fritz-Haber-Institut (FHI) and the experiment). This computer system offers various communication interfaces as shown in Fig. 3b. The analog signals of the ammonia detector are recorded by a data logger which is read out by the IOC. The mass flow controllers are connected serially via RS485 using the FLOW-BUS protocol.35 The temperature controller and controllable valves use serial communication and are also connected to the gateway system. The IOC provides process variables (PVs) of the hardware devices that represent setpoints or read-back values (e.g., setpoints of mass flow controllers and temperature controllers) and makes them readable and writable controlled by Access Control Lists (ACL) via the channel access protocol. This means that any client system connected to the FHI network can read or write these values if they are allowed by ACL by using the name of the desired PV via a graphical user interface or even via the command line.
Local data archive
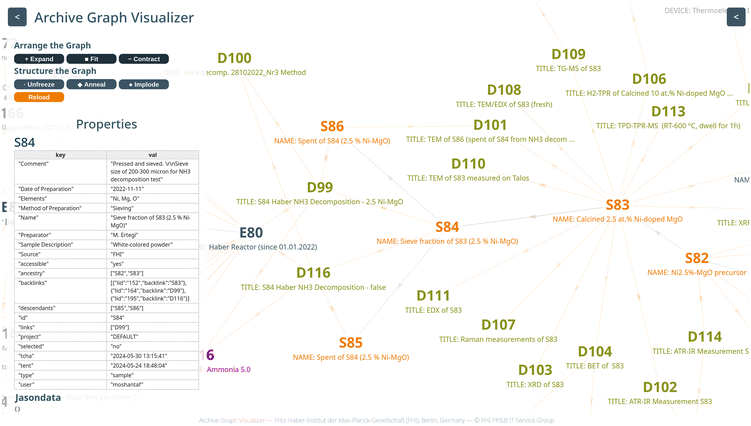
The special feature of the system presented here goes beyond the mere implementation of an automation solution for a small laboratory reactor with an open-source software developed for the automation of large synchrotron-based experiments (EPICS). What makes it unique is the integration of automation with automatic, standardized data analysis and storage, and the linking of all measurement information directly to the catalyst sample information in a knowledge graph with the catalyst in the center (https://visualizer.fhi.mpg.de/haber/). This holistic, catalyst-centric approach not only provides a comprehensive solution, but also ensures efficiency in building a robust local data infrastructure. To accomplish this, it was necessary to develop a local data archive (also called database (AC/CATLAB Archive)).18The kinetic data generated by the reactor are automatically uploaded to the archive and linked to the information on the catalyst synthesis in the archive (Fig. 2, link between sample entry and data entry). The AC/CATLAB Archive (Fig. 4) has been described and documented before.8,18 Some aspects that are important for the function of the automated test reactor are briefly explained below.
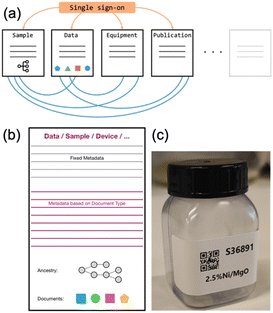 | ||
| Fig. 4 (a) Flexible and expandable architecture of the AC/CATLAB Archive (published before by Wiley in an open access article (ref. 8) distributed under the terms of the Creative Commons CC BY license); both, the number of document types (sample, data, equipment, …) and the number of fields in any document type can be adapted to the needs of future research;8 (b) uniform design of document types with a minimum number of fields; (c) labels can be printed from the database; by scanning the QR code on the sample container with a mobile device in the laboratory, the sample entry with all details about the sample is made accessible. | ||
Access rights to the data are governed by the administrator on the directive of the project management (Fig. 4a). Archive users can assign a project to each data entry and the administrator grants users access rights to specific projects.
Open Access can be granted after publication. Every entry and every object uploaded to the database is characterized by a unique identifier (ID). Furthermore, each data entry has its own editing history, so the changes made to a data entry can be tracked. An application programming interface (API) has been developed for the AC/CATLAB Archive, which allows external programs or scripts to communicate with the archive and access the data it contains. The API provides the ability to use Python commands to perform certain tasks in the database, such as logging in, creating a data entry, editing, deleting, adding links, downloading and uploading files or JSON data.36
There are a limited number of different entry types, such as entries for samples, data, chemicals, gases, instruments or publications (Fig. 4a).8,18 Before users can start an experiment with the “Haber” reactor, an identification (ID) number of the catalyst must exist in the database. This can be ensured by creating a sample entry in the database, where the user can fill in fields such as the date of preparation, the amount of product, and the preparation method (Fig. 4b). An example of the sample entry for the catalyst precursor used in this work can be found in Fig. S2† and entry S82 in the example database.
As mentioned above, an example database was created with selected entries from the current AC/CATLAB Archive, which is provided to the reader for this publication. Therefore, the sample ID on the photo in Fig. 4c does not match the ID in the example database, as it is the actual ID of the same sample in the current AC/CATLAB database, which contains many more entries (currently 116![[thin space (1/6-em)]](https://www.rsc.org/images/entities/char_2009.gif) 413 entries). The product of catalyst synthesis is usually subjected to various treatments and finally pressed and sieved into a sieve fraction (entry S84 in the example database). All individual unit operations (e.g., washing, calcination, pressing and sieving, catalytic test) result in a new sample ID if the sample is also physically stored and not completely processed in the next step. The relationships between the samples can be seen from the ancestry and descendant information in the metadata area of the sample entry (Fig. S2† and entry S82 in the example database). This means, the history of a sample becomes traceable, as a descendant sample is created from the original sample during each treatment by writing the ID of the original sample in the “Child of” field when the successor sample is created. Data from automated syntheses can also be uploaded or links to the corresponding data entries can be created. Users can click on the “Print Label” button in the “Action” tab of each sample entry (Fig. S2†), which sends a command to a printer to print a QR code label that can be attached to the physical sample container (Fig. 4c). Scanning the QR code, for example, with a mobile phone in the laboratory, takes the user to the information page about the sample (Fig. S2†). If an entry is fixed, no further changes are possible.
413 entries). The product of catalyst synthesis is usually subjected to various treatments and finally pressed and sieved into a sieve fraction (entry S84 in the example database). All individual unit operations (e.g., washing, calcination, pressing and sieving, catalytic test) result in a new sample ID if the sample is also physically stored and not completely processed in the next step. The relationships between the samples can be seen from the ancestry and descendant information in the metadata area of the sample entry (Fig. S2† and entry S82 in the example database). This means, the history of a sample becomes traceable, as a descendant sample is created from the original sample during each treatment by writing the ID of the original sample in the “Child of” field when the successor sample is created. Data from automated syntheses can also be uploaded or links to the corresponding data entries can be created. Users can click on the “Print Label” button in the “Action” tab of each sample entry (Fig. S2†), which sends a command to a printer to print a QR code label that can be attached to the physical sample container (Fig. 4c). Scanning the QR code, for example, with a mobile phone in the laboratory, takes the user to the information page about the sample (Fig. S2†). If an entry is fixed, no further changes are possible.
Graphical user interfaces
The catalytic test of a sample in ammonia decomposition begins with the definition of the machine-readable SOP in the method editor of the control system. Using Phoebus as software,37 four different graphical user interfaces were developed that allow easy monitoring and control of the setup.(i) The method editor (Fig. S3†) is used to enter and save the measurement parameters. The method defines the setpoints for the temperature controller, the heating rate, the dwell time, the setpoints for the mass flow controllers and the equilibration time to stabilize gas flows and the detector signals at the beginning of an experiment. An experiment can consist of different stages (Fig. 1b and 5). When the user clicks the “Save” button, an embedded Python script is executed in the background that converts the data from a table into a JSON format and an HDF5 file with a specific structure and uploads it to a new method data entry in the database so that it can be called from the database and used again (Fig. 5 and entry D100 in the example database). Creating a new method is easier if existing methods are loaded and modified via a drop-down menu.
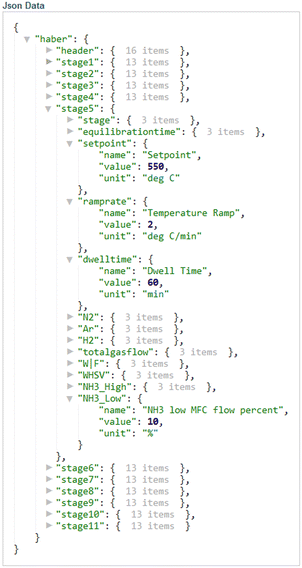 | ||
| Fig. 5 Excerpt from a machine-readable JSON file generated using the method editor GUI (Fig. S3†) for creating a new method and saving it digitally in the database. | ||
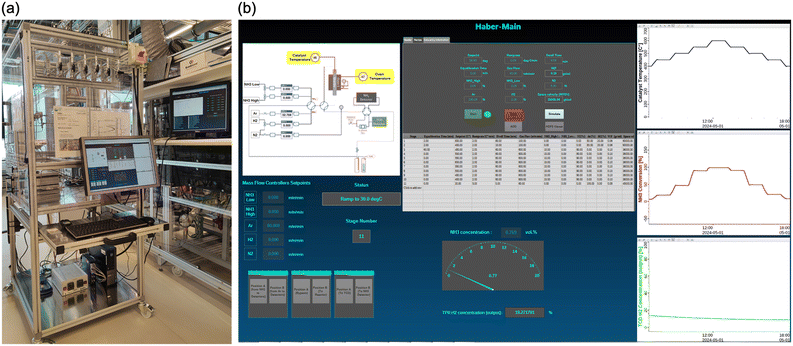
(ii) The main Haber GUI (Fig. 6) is where the user can load a method from the database, insert the sample ID, start or stop the experiment and view some important graphs while the experiment is running, e.g., the ammonia conversion as a function of the catalyst temperature. It contains the flow chart shown in Fig. 3a, but the hardware units are replaced with fields to display the read back values of the mass flow controllers and the temperature controller. The user can also manually input the set points for the mass flow controllers when the experiment is not running for calibration or maintenance. The GUI contains a special area where the user can enter information that is to be transferred as comment to the results data entry in the archive when the experiment is finished (e.g., the title of the data entry, the author, the chemical composition of the sample).
(iii) The Operator GUI (Fig. S4†) is intended as a read-only GUI, with which the user can observe the experiment remotely from any client system. The user can monitor the experiment and view live plots or historical plots of the recorded data. The source for the recorded data is the EPICS archiver appliance. The data is automatically backed up by the archiver appliance instance in the FHI network without interruption (online 24/7). The GUI also has status and stage fields to display the current status and stage of the experiment. It also contains fields to display the setpoints and the readback values for the mass flow controllers and the temperature controller.
(iv) Using the PV control function (Fig. S5†), an authorized user responsible for the setup can monitor all connected hardware devices and make some configurations, such as calibrating the TCD or setting the controllable valves to a specific position, by pressing a button on the PV control GUI. The user can also manually input the set points for the mass flow controllers and the temperature controller and read the read-back signals from all inputs of the data logger.
Experimental workflow
The following section describes how an experiment works in practice and how the acquired data is linked in order to finally arrive at knowledge graphs (Fig. 7, https://visualizer.fhi.mpg.de/haber/). The experimental workflow starts with inserting the sample into the reactor tube, selecting the desired method in the method editor GUI and then saving possible changes. On the main GUI, the user must enter the sample ID and the user name. Other information that will be included in the results data entry (e.g. the title of the entry, the name of the author, the elements of the sample, …) can also be added. Then the desired method is selected from a drop-down menu on the main GUI that displays all the methods stored up to that point. Once the appropriate method has been chosen, all parameters are imported, but final changes can still be made to the method before it is carried out. If no changes have been made and the start button has been pressed, the selected method is sent to a Python script to be executed. Otherwise, a new method is created with the changes and uploaded to the archive as a new method data entry with a specific name and date and then executed in the python script.A dedicated Python script has been developed for running the experiment based on the defined method and reporting the collected data. The Python script uses Python libraries such as Ophyd36 and Bluesky.38 Ophyd is responsible for enabling the setting and reading of the EPICS PVs in Python, while the Bluesky library is responsible for executing a plan containing sequential commands representing setting values or reading values from the EPICS PVs for each stage of the experiment. It also enables collecting data which belong to EPICS PVs for sensors and analysis devices. The collected data is streamed in real time to an HDF5 file following a specific structure for the datasets and a CSV file with specific column names. At the end of the experiment, the same script generates a PDF report of the experiment, containing all the information about the method used and showing the main results after standardized data analysis. The generated files are stored locally before they are automatically uploaded to the S3 storage for long-term backup. A new data entry is created in the database and all files are uploaded from the S3 storage to this data entry. If database entries are mentioned in the following, they always refer to entries in the example database created for this publication, which can be accessed via the link https://haber.archive.fhi.mpg.de. An example of a data entry for an ammonia decomposition experiment over a Ni-based catalyst is shown in Fig. S6† and in entry D99. The Python script at the end of the experiment also creates a sample entry of the spent sample after ammonia decomposition and links it to the original sample filled into the reactor so that the chain representing the history of the sample is complete, starting with the product of co-precipitation in an automated synthesis reactor (entry S82), the calcined precursor (entry S83), then the sieve fraction (entry S84), and finally the spent catalyst (entry S86). All relevant database entries (sample, method, gases and equipment) are automatically linked to the data entry containing the results of the catalytic test D99 and this entry is linked in both directions to the sample entries of the spent catalyst as well as the sieve fraction.
Fig. 7 summarizes how the results of a standard investigation on a Ni/MgO catalyst for ammonia decomposition are stored and linked in the local data archive. The data of the co-precipitation of the hydroxycarbonate precursor are summarized in the sample entry S82 of the freshly precipitated material. This entry contains the protocol of the precipitation reaction using an automated precipitation reactor (Optimax, Mettler Toledo) (entry E88) in the proprietary format of Mettler Toledo, in form of a pdf file and an Excel sheet. Furthermore, the sample entry is linked to the chemicals used, all information on the synthesis workstation and standard analysis results using XRD and ATR-IR (see links in the example database). The derived calcined catalyst precursor (entry S83) was analyzed even more extensively using SEM, EDX, TEM, XRD, XRF, N2 adsorption, ATR-IR, and Raman spectroscopy. All these characterization data are linked to the calcined material. The catalysis results in the ammonia decomposition (entry D99) are not linked to the calcined catalyst precursor, but to the derived sieve fraction (entry S84) and to the spent catalyst (entry S86). In this system, all data are filed transparently and, in particular, can be assigned clearly to the individual specimens. Thus, it is possible to easily obtain an overview of the status of a research project.
Data storage and retrieval
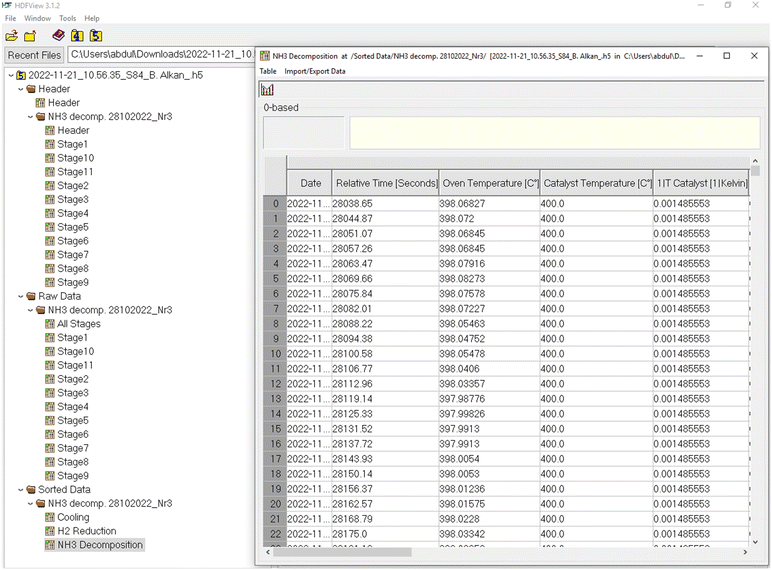
The experimental data is saved in different formats. To make the data compatible for analysis using artificial intelligence methods, it is exported in a structured HDF5 format. The structure includes three main groups.(i) The “Header Group” contains the header data set and a subgroup with the name of the method used. The header data set consists of general metadata such as the user name, the time resolution and the catalyst mass. The subgroup of the method contains a data set for each stage. Each data set contains method parameters such as the equilibration time and the temperature setpoint. This meta and method data were entered by the user on the graphical user interface.
(ii) The “Raw Data” group contains another group with the name of the method used and within this group there are the datasets for each stage of the experiment. These datasets contain all the data collected by the sensors and the hardware devices while the experiment is running in the corresponding stage. All data is timestamped for relative time and stored in columns with a column name and type specific for each parameter.
(iii) In the “Sorted Data” group the data is sorted by the type of the experimental phase, whereas each phase is composed of several stages. In the case of an ammonia decomposition experiment, this includes 4 main phases: (1) pre-treatment (if performed), (2) reduction in hydrogen, (3) NH3 decomposition, and (4) cooling. In each phase, only the relevant data related to that phase is listed in the datasets, e.g., the H2 reduction phase contains the TCD sensor data, from which the H2 consumption can be calculated, but it does not contain the signal from the ammonia detector as although this is recorded continuously, it is not relevant for this phase of the experiment. An example of a HDF5 file illustrating the structure can be found in Fig. 8.
Some users prefer to have the data in Excel or CSV file formats. Therefore, also these two file formats are generated and uploaded to the database. The CSV file contains the raw data from all the stages. The Excel file is divided into sheets for each stage.
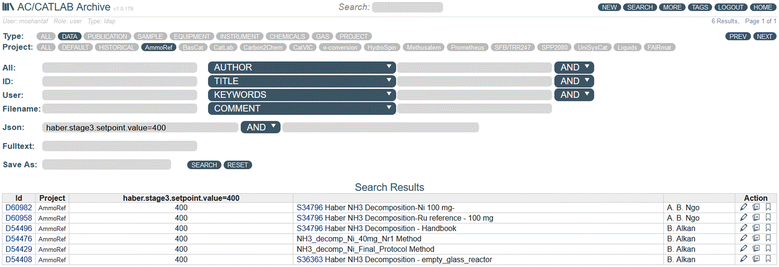
Searching within the database is possible when the user accesses the search menu, which is also accessible via the API. Here, it is possible to search in the various fields of the different data types (Fig. 9). A particular advantage is that a search can be performed directly in the JSON data for a specific parameter combined with a specific value. In this way, for example, all experiments can be found that were carried out with a temperature setpoint of 400 °C in the third stage (Fig. 9).
Data sharing and publication
An advantage of experiment automation is the standardised way in which data and metadata are generated and stored. Once the automation is in place, publishing and sharing data should not take much time or be an additional burden on the scientist. And once every element of data and metadata in the HDF5 file, for example, has been labelled for an experiment, e.g., by reference to ontologies or vocabularies such as Voc4Cat,39 future measurements will appear consistently. Hence, measurements on materials that are considered to be more ‘unsuccessful’ catalysts can readily be incorporated into data publications, potentially adding value to machine learning models. However, there is still a lack of widely accepted and clearly defined standards for both local automation solutions and global data sharing.On the one hand, there are a number of approaches to automation in catalysis-related research areas, such as CaRMeN (rapid analysis of physical and chemical models against experimental data),40 LARASuite (tool kit for experiments in biochemistry),41 or CAMELS (experimental physics).42 Other solutions, tailored to specific research methods, are and will be developed.31 On the other hand, a variety of options are available for publishing datasets, including format- and content-independent platforms where all relevant files can usually be compressed and uploaded, such as Zenodo43 or Radar4Chem.44 Specialised databases of experimental catalysis data are also being developed, such as CADS45 and CatTestHub.46 Several ELNs offer their own repositories for publishing data, such as Chemotion47 or NOMAD Oasis.48 An electronic lab notebooks consortium is working on a common format for exchanging data between the different systems.49
Given the variety of emerging solutions, one approach could be to map the (meta) data from the output files of an automated device to the record format of an overarching repository to open up new solutions for cross-platform exchange. In the automation solution presented here, for example, the HDF5 output format has been adapted for uncomplicated import into NOMAD Oasis.
The current lack of established standards should not prevent us from dealing with data structure in the process of developing automation solutions. On the contrary, any attempt to structure our data now and, where possible, align it with the reference systems being developed, such as Voc4Cat,39 will facilitate the transfer of pre-structured data into a standardised data format and the sharing of data. In the end, it is just a matter of writing parsers that automatically convert one format into another.
Summary and conclusions
In this work, tools were developed to facilitate the use of standard operating procedures in catalysis research based on freely accessible (open-source) software solutions. These tools were integrated into an automation concept to generate and store reproducible and comparable catalysis data that are machine-readable and ready for machine learning applications. For this purpose, several user-friendly graphical user interfaces have been developed that enable the control of the experiments and allow remote monitoring of experimental setups. The key feature of the automation solution is that the measured data and data analysed according to standardized procedures are automatically uploaded to a database (AC/CATLAB Archive) and linked to the sample and other relevant information. The database is not only a data repository but also serves as an electronic laboratory notebook, as it is, for example, possible to manually enter notes, images and videos related to the experiment. The database allows the storage of different data files and formats and provides tools that facilitate the retrieval and visualization of data.The structured format for storing data and metadata in HDF5 files enables efficient data management, can handle large and complex datasets and can facilitate the sharing and publication of data. With the format being optimized for fast read and write operations, it allows machine learning tools and algorithms using the database API to sort and search the data more efficiently, as each piece of information is addressed by a specific name. However, the data structure is only defined on a project-specific basis and is not generally valid. We hope that by applying the concept of automation to other reactors and operando experiments, a general, appropriate structure will emerge and standards will be developed through collaboration and ongoing engagement with the community. These developments will increase the reliability and reproducibility of catalysis data and lead to FAIR data in catalysis research.
Finally, it should be emphasized that the structured approach enabled by the data infrastructure developed here and the adherence to standard operating procedures in no way hinder creative research. On the contrary, automation provides scientists with additional time for productive data analysis and the development of innovative ideas. It also significantly improves the quality and reusability of data, which saves time and resources. The trend towards comprehensive publication of raw data is becoming a mandatory standard for research publications anyway.
Leading catalysis into a digital future requires not only the necessary technical infrastructure, but also the recognition by scientists that this structured approach has significant benefits not only for their own work, but also for the advancement of science. By facilitating scientific tasks through automation, this awareness will be continuously strengthened.
Data availability
All scripts are open source and documented on GitHub and GitLab. The corresponding entries are cited in the text as references. Sample data is accessible from the text via links to an example database prepared for this publication.Author contributions
The manuscript was written through contributions of all authors. All authors have given approval to the final version of the manuscript.Conflicts of interest
There are no conflicts to declare.Acknowledgements
We thank William Kirchstaetter, Patrick Oppermann, Julian Fabian, Anh Binh Ngo, Thomas Lunkenbein, Beatriz Roldán Cuenya (FHI), and William Smith (Helmholtz-Zentrum Berlin) for discussion and Shan Jiang, Frank Girgsdies, Christain Rohner, Olaf Timpe, and Jasmin Allan for experiments related to the examples presented in this work. In particular, we would like to thank Robert Schlögl for the initiation, constant support and stimulating discussions which, in his capacity as Director of the Department of Inorganic Chemistry at the Fritz-Haber-Institut (FHI) der Max-Planck-Gesellschaft, have contributed significantly to the current status of the data infrastructure at the FHI. Financial support by the Federal Ministry of Education and Research (BMBF) in the framework of the CatLab project, FKZ 03EW0015B and the AmmoRef project, FKZ 03HY203A is acknowledged. The collaboration with the Humboldt University Berlin, funded by the Deutsche Forschungsgemeinschaft (DFG, German Research Foundation), in the framework of the project FAIRmat – FAIR Data Infrastructure for Condensed-Matter Physics and the Chemical Physics of Solids, project number 460197019, is also acknowledged. Open Access funding provided by the Max Planck Society.Notes and references
- A. J. Medford, M. R. Kunz, S. M. Ewing, T. Borders and R. Fushimi, ACS Catal., 2018, 8, 7403–7429, DOI:10.1021/acscatal.8b01708.
- K. Takahashi, L. Takahashi, I. Miyazato, J. Fujima, Y. Tanaka, T. Uno, H. Satoh, K. Ohno, M. Nishida, K. Hirai, J. Ohyama, T. N. Nguyen, S. Nishimura and T. Taniike, ChemCatChem, 2019, 11, 1146–1152, DOI:10.1002/cctc.201801956.
- T. Toyao, Z. Maeno, S. Takakusagi, T. Kamachi, I. Takigawa and K.-i. Shimizu, ACS Catal., 2020, 10, 2260–2297, DOI:10.1021/acscatal.9b04186.
- P. S. F. Mendes, S. Siradze, L. Pirro and J. W. Thybaut, ChemCatChem, 2021, 13, 836–850, DOI:10.1002/cctc.202001132.
- C. Wulf, M. Beller, T. Boenisch, O. Deutschmann, S. Hanf, N. Kockmann, R. Kraehnert, M. Oezaslan, S. Palkovits, S. Schimmler, S. A. Schunk, K. Wagemann and D. Linke, ChemCatChem, 2021, 13, 3223–3236, DOI:10.1002/cctc.202001974.
- A. Toniato, A. C. Vaucher and T. Laino, Catal. Today, 2022, 387, 140–142, DOI:10.1016/j.cattod.2021.10.001.
- S. Weber, R. T. Zimmermann, J. Bremer, K. L. Abel, D. Poppitz, N. Prinz, J. Ilsemann, S. Wendholt, Q. Yang, R. Pashminehazar, F. Monaco, P. Cloetens, X. Huang, C. Kübel, E. Kondratenko, M. Bauer, M. Bäumer, M. Zobel, R. Gläser, K. Sundmacher and T. L. Sheppard, ChemCatChem, 2022, 14, e202101878, DOI:10.1002/cctc.202101878.
- C. P. Marshall, J. Schumann and A. Trunschke, Angew. Chem., Int. Ed., 2023, 62, e202302971, DOI:10.1002/anie.202302971.
- M. D. Wilkinson, M. Dumontier, I. J. Aalbersberg, G. Appleton, M. Axton, A. Baak, N. Blomberg, J.-W. Boiten, L. B. da Silva Santos, P. E. Bourne, J. Bouwman, A. J. Brookes, T. Clark, M. Crosas, I. Dillo, O. Dumon, S. Edmunds, C. T. Evelo, R. Finkers, A. Gonzalez-Beltran, A. J. G. Gray, P. Groth, C. Goble, J. S. Grethe, J. Heringa, P. A. C. 't Hoen, R. Hooft, T. Kuhn, R. Kok, J. Kok, S. J. Lusher, M. E. Martone, A. Mons, A. L. Packer, B. Persson, P. Rocca-Serra, M. Roos, R. van Schaik, S.-A. Sansone, E. Schultes, T. Sengstag, T. Slater, G. Strawn, M. A. Swertz, M. Thompson, J. van der Lei, E. van Mulligen, J. Velterop, A. Waagmeester, P. Wittenburg, K. Wolstencroft, J. Zhao and B. Mons, Sci. Data, 2016, 3, 160018, DOI:10.1038/sdata.2016.18.
- A. Trunschke, G. Bellini, M. Boniface, S. J. Carey, J. Dong, E. Erdem, L. Foppa, W. Frandsen, M. Geske, L. M. Ghiringhelli, F. Girgsdies, R. Hanna, M. Hashagen, M. Hävecker, G. Huff, A. Knop-Gericke, G. Koch, P. Kraus, J. Kröhnert, P. Kube, S. Lohr, T. Lunkenbein, L. Masliuk, R. Naumann d'Alnoncourt, T. Omojola, C. Pratsch, S. Richter, C. Rohner, F. Rosowski, F. Rüther, M. Scheffler, R. Schlögl, A. Tarasov, D. Teschner, O. Timpe, P. Trunschke, Y. Wang and S. Wrabetz, Top. Catal., 2020, 63, 1683–1699, DOI:10.1007/s11244-020-01380-2.
- D. A. Boiko, R. MacKnight, B. Kline and G. Gomes, Nature, 2023, 624, 570–578, DOI:10.1038/s41586-023-06792-0.
- A. Trunschke, Catal. Sci. Technol., 2022, 12, 3650–3669, 10.1039/D2CY00275B.
- P. Nikolaev, D. Hooper, F. Webber, R. Rao, K. Decker, M. Krein, J. Poleski, R. Barto and B. Maruyama, npj Comput. Mater., 2016, 2, 16031, DOI:10.1038/npjcompumats.2016.31.
- R. Shimizu, S. Kobayashi, Y. Watanabe, Y. Ando and T. Hitosugi, APL Mater., 2020, 8, 111110, DOI:10.1063/5.0020370.
- N. J. Szymanski, B. Rendy, Y. Fei, R. E. Kumar, T. He, D. Milsted, M. J. McDermott, M. Gallant, E. D. Cubuk, A. Merchant, H. Kim, A. Jain, C. J. Bartel, K. Persson, Y. Zeng and G. Ceder, Nature, 2023, 624, 86–91, DOI:10.1038/s41586-023-06734-w.
- J. Leeman, Y. Liu, J. Stiles, S. B. Lee, P. Bhatt, L. M. Schoop and R. G. Palgrave, ChemRxiv, 2024, preprint, DOI:10.26434/chemrxiv-2024-5p9j4.
- EPICS Archiver, https://slacmshankar.github.io/epicsarchiver_docs/details.html, (accessed 2024/05/31) Search PubMed.
- M. Wesemann, AC archive, https://github.com/fhimpg/archive, (accessed 2024/05/31) Search PubMed.
- F. Schüth, R. Palkovits, R. Schlögl and D. S. Su, Energy Environ. Sci., 2012, 5, 6278–6289, 10.1039/C2EE02865D.
- S. Ristig, M. Poschmann, J. Folke, O. Gómez-Cápiro, Z. Chen, N. Sanchez-Bastardo, R. Schlögl, S. Heumann and H. Ruland, Chem. Ing. Tech., 2022, 94, 1413–1425, DOI:10.1002/cite.202200003.
- A. Klerke, C. H. Christensen, J. K. Nørskov and T. Vegge, J. Mater. Chem., 2008, 18, 2304–2310, 10.1039/B720020J.
- T. E. Bell and L. Torrente-Murciano, Top. Catal., 2016, 59, 1438–1457, DOI:10.1007/s11244-016-0653-4.
- S. Mukherjee, S. V. Devaguptapu, A. Sviripa, C. R. F. Lund and G. Wu, Appl. Catal., B, 2018, 226, 162–181, DOI:10.1016/j.apcatb.2017.12.039.
- K. E. Lamb, M. D. Dolan and D. F. Kennedy, Int. J. Hydrogen Energy, 2019, 44, 3580–3593, DOI:10.1016/j.ijhydene.2018.12.024.
- I. Lucentini, X. Garcia, X. Vendrell and J. Llorca, Ind. Eng. Chem. Res., 2021, 60, 18560–18611, DOI:10.1021/acs.iecr.1c00843.
- N. Morlanés, S. P. Katikaneni, S. N. Paglieri, A. Harale, B. Solami, S. M. Sarathy and J. Gascon, Chem. Eng. J., 2021, 408, 127310, DOI:10.1016/j.cej.2020.127310.
- R. Schlögl, Angew. Chem., Int. Ed., 2015, 54, 3465–3520, DOI:10.1002/anie.201410738.
- Y. W. Choi, H. Mistry and B. Roldan Cuenya, Curr. Opin. Electrochem., 2017, 1, 95–103, DOI:10.1016/j.coelec.2017.01.004.
- Z. Zhang, B. Zandkarimi and A. N. Alexandrova, Acc. Chem. Res., 2020, 53, 447–458, DOI:10.1021/acs.accounts.9b00531.
- L. Foppa, F. Rüther, M. Geske, G. Koch, F. Girgsdies, P. Kube, S. J. Carey, M. Hävecker, O. Timpe, A. V. Tarasov, M. Scheffler, F. Rosowski, R. Schlögl and A. Trunschke, J. Am. Chem. Soc., 2023, 145, 3427–3442, DOI:10.1021/jacs.2c11117.
- A. Nieva de la Hidalga, J. Goodall, C. Anyika, B. Matthews and C. R. A. Catlow, Catal. Commun., 2022, 162, 106384, DOI:10.1016/j.catcom.2021.106384.
- N. Kockmann, S. A. Behr, H. Borgelt, M. Dörr, D. Linke, N. G. Moustakas, M. Khatamirad, S. A. Schunk, S. Hanf, E. Norouzi, E. Saraci, M. Heßelmann, M. Zimmer, F. Wiesner, M. Wessling, T. Petrenko, Y. Dikova, R. Khare, A. Trunschke, J. Schumann, S. Angeli, H. Gossler, O. Deutschmann and R. Lenz, Zenodo, 2024, DOI:10.5281/zenodo.11082928.
- S. Bauer, P. Benner, T. Bereau, V. Blum, M. Boley, C. Carbogno, C. R. A. Catlow, G. Dehm, S. Eibl, R. Ernstorfer, Á. Fekete, L. Foppa, P. Fratzl, C. Freysoldt, B. Gault, L. M. Ghiringhelli, S. K. Giri, A. Gladyshev, P. Goyal, J. Hattrick-Simpers, L. Kabalan, P. Karpov, M. S. Khorrami, C. T. Koch, S. Kokott, T. Kosch, I. Kowalec, K. Kremer, A. Leitherer, Y. Li, C. H. Liebscher, A. J. Logsdail, Z. Lu, F. Luong, A. Marek, F. Merz, J. R. Mianroodi, J. Neugebauer, Z. Pei, T. A. R. Purcell, D. Raabe, M. Rampp, M. Rossi, J.-M. Rost, J. Saal, U. Saalmann, K. N. Sasidhar, A. Saxena, L. Sbailò, M. Scheidgen, M. Schloz, D. F. Schmidt, S. Teshuva, A. Trunschke, Y. Wei, G. Weikum, R. P. Xian, Y. Yao, J. Yin, M. Zhao and M. Scheffler, Modell. Simul. Mater. Sci. Eng., 2024, 32, 063301, DOI:10.1088/1361-651X/ad4d0d.
- A. Moshantaf, P. Oppermann and H. Junkes, Haber - Catalytic test reactor for ammonia decomposition, https://gitlab.fhi.mpg.de/fhi-ac/haber, (accessed May 30, 2024) Search PubMed.
- Flow Bus Protocol, https://www.bronkhorst.com/en-us/service-support/knowledge-base/digital-fieldbus-technology-en/flow-bus/, (accessed 2024/05/31) Search PubMed.
- Ophyd Index, https://blueskyproject.io/ophyd/index.html, (accessed 2024/05/31) Search PubMed.
- Phoebus, http://github.com/ControlSystemStudio/phoebus, (accessed 2024/06/04) Search PubMed.
- Bluesky, https://blueskyproject.io/bluesky/, (accessed 2024/05/31) Search PubMed.
- nfdi4cat/voc4cat, https://github.com/nfdi4cat/voc4cat, (accessed 12 August, 2024) Search PubMed.
- H. Gossler, J. Riedel, E. Daymo, R. Chacko, S. Angeli and O. Deutschmann, Chem. Ing. Tech., 2022, 94, 1798–1807, DOI:10.1002/cite.202200064.
- LARAsuite, https://lara.uni-greifswald.de/larasuite/, (accessed 12 August, 2024) Search PubMed.
- A. D. Fuchs, J. A. F. Lehmeyer, H. Junkes, H. B. Weber and M. Kiege, J. Open Source Softw., 2024, 9, 6371, DOI:10.21105/joss.06371.
- Zenodo, https://zenodo.org/, (accessed 12 August, 2024) Search PubMed.
- RADAR4Chem, https://radar4chem.radar-service.eu/radar/en/home, (accessed 12 August, 2024) Search PubMed.
- J. Fujima, Y. Tanaka, I. Miyazato, L. Takahashi and K. Takahashi, React. Chem. Eng., 2020, 5, 903–911, 10.1039/D0RE00098A.
- A. Burte, B. Page, A. Nair, L. Grabow, P. Dauenhauer, S. Scott and O. Abdelrahman, ChemRxiv, 2024, preprint, DOI:10.26434/chemrxiv-2024-q0q70.
- P. Tremouilhac, C.-L. Lin, P.-C. Huang, Y.-C. Huang, A. Nguyen, N. Jung, F. Bach, R. Ulrich, B. Neumair, A. Streit and S. Bräse, Angew. Chem., Int. Ed., 2020, 59, 22771–22778, DOI:10.1002/anie.202007702.
- NOMAD Oasis, https://nomad-lab.eu/nomad-lab/nomad-oasis.html, (accessed 12 August, 2024) Search PubMed.
- ELN consortium, https://github.com/TheELNConsortium/TheELNFileFormat, (accessed 12 August, 2024) Search PubMed.
Footnote |
| † Electronic supplementary information (ESI) available. See DOI: https://doi.org/10.1039/d4cy00693c |
| This journal is © The Royal Society of Chemistry 2024 |

