 Open Access Article
Creative Commons Attribution 3.0 Unported Licence
Discovering life's directed metabolic (sub)paths to interpret human biochemical markers using the DSMN tool†
Denise
Slenter
 *a,
Martina
Kutmon
 ab,
Chris T.
Evelo
 ab and
Egon L.
Willighagen
 a
a
aDepartment of Bioinformatics – BiGCaT, NUTRIM Research School, Maastricht University, The Netherlands. E-mail: denise.slenter@maastrichtuniversity.nl
bMaastricht Centre for Systems Biology (MaCSBio), Maastricht University, The Netherlands
First published on 10th October 2023
Abstract
Metabolomics data analysis for phenotype identification commonly reveals only a small set of biochemical markers, often containing overlapping metabolites for individual phenotypes. Differentiation between distinctive sample groups requires understanding the underlying causes of metabolic changes. However, combining biomarker data with knowledge of metabolic conversions from pathway databases is still a time-consuming process due to their scattered availability. Here, we integrate several resources through ontological linking into one unweighted, directed, labeled bipartite property graph database for human metabolic reactions: the Directed Small Moleicules Network (DSMN). This approach resolves several issues currently experienced in metabolic graph modeling and data visualization for metabolomics data, by generating (sub)networks of explainable biochemical relationships. Three datasets measuring human biomarkers for healthy aging were used to validate the results from shortest path calculations on the biochemical reactions captured in the DSMN. The DSMN is a fast solution to find and visualize biological pathways relevant to sparse metabolomics datasets. The generic nature of this approach opens up the possibility to integrate other omics data, such as proteomics and transcriptomics.
1 Introduction
Metabolites are produced as a result of regulatory processes and reflect the underlying biological mechanisms of phenotypes and diseases. Metabolomics measurements are critical for describing the overall state of cells, tissues, or complete organisms.1 Metabolic data is used for disease diagnosis, monitoring, and supporting treatment through chemical biomarker discovery.2 The number of metabolites that can be identified as individual compounds with a high enough chemical precision is still relatively small compared to the volumes of other-omics data currently available.3 Additionally, biological samples can contain chemically similar compounds with individual biological responses (stereoisomers, ionized molecules, undefined double bond positions), indistinguishable by many chemical analysis techniques used.4 While some metabolic concentrations are relatively stable within an individual, several classes fluctuate naturally over time governed by the circadian rhythm,5 influenced by the gut microbiome,6 and general intra-person variations.7 Another complicating factor in metabolomics data analysis can stem from experimental and instrumental noise.8,9Considering these issues, only a small fraction of the information represented in most metabolic datasets can be translated into interpretable evidence for further data analysis. Unfortunately, data analysis is a prominent bottleneck of all omics datasets, which requires computational tools to manage, process, and visualize data to support the interpretation of the substantial amount of data generated by current techniques.10 Pathway analysis is a commonly used approach for transcriptomics data analysis,11 which can also be used to discover the biological origin of biochemical markers or explore the molecular mechanisms influencing metabolic changes. However, the small data size remaining after processing raw metabolomics data into annotated compounds hinders biological interpretation, pathway statistics, and visualization of the data. Furthermore, connecting chemical compounds in pathways to the measured entities can be obscured by small annotation differences of chemical structures, e.g. fully defined stereochemistry versus uncertainties thereof. Last, knowledge of biochemical conversions is dispersed over multiple databases which can strongly affect results depending on the input data and parameters used.12
Integration of relevant pathways from multiple resources needs to be performed manually which is time-consuming and error-prone. Furthermore, pathways only describe a (sub)section of relevant biochemical interactions biased toward well-known reactions which might miss specific metabolites originating from plants or the microbiome.13 The choice of database(s) used for annotation impacts the results found with regard to enrichment analysis and predictive modeling (for all-omics data types).12,14 Different methods exist to execute pathway analysis for metabolomics, which can be classified as over-representation analysis,12 functional class scoring,15 pathway topology analysis,16 and network enrichment analysis.13 This last method surpasses the boundaries of a pathway model, by comparing all relationships present in a chemical reaction network for overlap between metabolites of interest and metabolites present in the network. Merging information from different resources into one larger network aids in understanding metabolic changes which affect multiple processes. These networks are also known as graphs, which entail the mathematical representation of a network.
Graphs of biochemical reactions at a molecular level are often modeled as hypergraphs,17 where the metabolites are captured as nodes while the reactions are modeled as edges. The hypergraph representation of metabolic reactions works well for visualizations, however, is not directly suitable for many graph algorithms which are needed to retrieve the biochemical relationships underlying metabolic changes.18 Another format used to represent metabolic reactions is known as a compound graph,19 where each node represents one metabolite; edges are used to represent a reaction between a substrate and product metabolite. This representation can create a large number of edges which influences the graph's connectivity resulting in poor graph algorithm performance.18 A simpler graph form is known as bipartite graphs,20 with nodes representing metabolites and reactions as well as connecting substrate and product metabolites to their corresponding reaction nodes through edges. Even though this model seems most suited for discovering the biochemical reactions related to metabolic changes, the bipartite graph model can create paths that are biologically irrelevant between compounds of interest.18 This problem can be addressed by reducing the number of calculated paths computationally (e.g. shortest path) to conserve a subset of reactions connected through the smallest step size from a substrate to a product. Furthermore, metabolites used in many reactions (e.g. energy carrier; proton donor, or acceptor) should be excluded from the path calculation. Last, following the direction of the reactions (forward, more products are produced than reactants in a reversible reaction; backward, more reactants than products are produced) can lead to fewer biologically irrelevant paths.
The current models and tools are not directly suited to solve the issues raised above. Existing tools such as the MetaboNetworks toolbox,21 or biochem4j22 do combine metabolic pathway knowledge in larger networks or graphs. These approaches help to overcome the data sparseness in metabolomics pathway models and allow users to focus only on the paths between the metabolites of interest. Issues with these tools are the requirement to use proprietary software, lack of methods for reproducibility of obtained results, missing provenance of pathway models and reaction mechanisms, using only one database to retrieve metabolic reactions from, ignoring the directionality of reactions, unsuited for integration of other omics data, or being discontinued or not maintained.
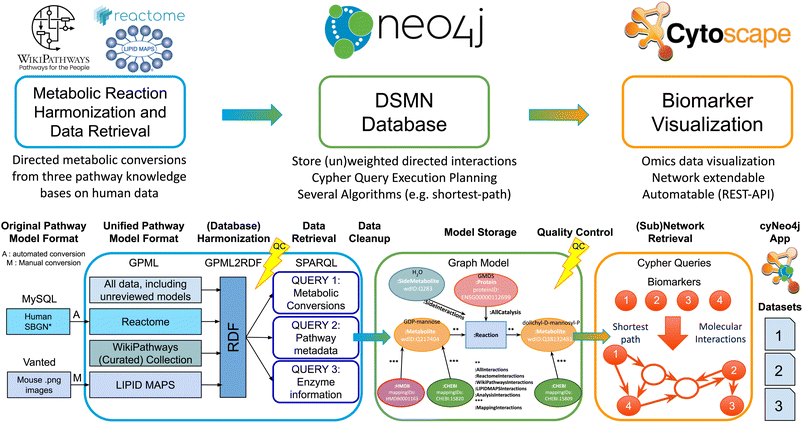
Therefore, we created a workflow (Fig. 1) integrating human metabolic reaction knowledge from three freely available pathway databases, suitable for fast queries on directed reaction paths between metabolites of interest in a scalable and flexible open-source graph database, including provenance. Furthermore, this workflow can be extended with other reaction information by users, allows for the integration of transcriptomics or proteomics data, and includes identifier mappings to two popular databases for metabolomics dataset annotations.
Our approach aims to overcome the boundaries that individual pathway models and resources encompass, by performing metabolomics network enrichment analysis by connecting individual pathways from three resources into one graph. The developed workflow creates a Directed Small Molecules Network (DSMN) as an unweighted, directed, labeled property bipartite graph, solving the issues described previously. The workflow starts by collecting directed reactions between metabolites from three unique and freely available pathway databases: LIPID MAPS,23 Reactome,24 and WikiPathways.25 The semantic web format Resource Description Framework (RDF)26 was used as the starting point to retrieve reaction knowledge, with ontologies providing harmonization over these databases and incorporating several metabolite and protein database annotations. The reactions are retrieved from the RDF through the SPARQL-query language, after which the information is stored in the graph database Neo4j (https://neo4j.com/).27 Substrate metabolites were connected to their counterpart product through a reaction node creating a bipartite graph, which enabled adding enzymes catalyzing the reactions as individual entities in the model and therefore suitable for downstream data analysis and visualization purposes. Each conversion reaction was considered to contribute in an equal amount to the overall reaction rate (unweighted) omitting specific kinetic information. All reactions were assumed to not be in molecular equilibrium, providing directionality to the model. Interpretation of the biochemical relationships underlying metabolic changes was performed by retrieving the directed paths between individual biomarkers with the shortest path algorithm, calculating the shortest distance between the nodes of the network.28 The resulting metabolic subnetwork can be connected to (multiple)-omics datasets for data visualization and interpretation by network tools such as Cytoscape, a widely adopted network analysis software tool.29 The resulting subnetworks contained directed reactions between metabolites including information on the enzyme(s) catalyzing the reaction. Additionally, available meta-data includes associated publications, pathway name(s), identifiers, and related ontologies.
In order to show and validate the possibilities of our approach, we obtained and visualized the shortest directed path for three different publicly available datasets. The studies publishing these datasets measured biochemical markers related to aging, which will be available in many metabolomics datasets. With the presented method, these biomarkers could be related to several metabolic reactions from pathways known to be related to aging processes and used to understand the underlying biology thereof. By visualizing the accompanying data of metabolic intensities on the network nodes, the visualization can be used to explore contradicting metabolic abundances in close reaction proximity or discover biomarkers that cannot be regarded as individual variables for modeling approaches.
2 Methods
The workflow is divided into three parts: (1) harmonization and retrieval of metabolic reaction data; (2) creating and storing the Directed Small Molecules Network (DSMN graph database); (3) subnetwork retrieval for biomarker data visualization. The next sections discuss each step in detail with code examples.2.1 Harmonization and retrieval of metabolic reaction data
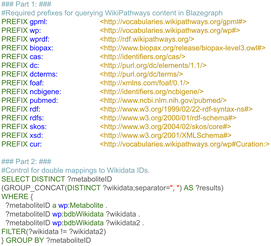
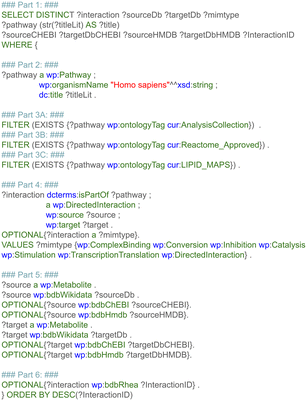
The first step retrieved and combined data on the metabolic reactants and their related products from three pathway databases, based on the harmonized RDF format. This data included the type of chemical relationship between the reaction pair using controlled vocabularies defined as ontologies. Additional recorded information was the pathway in which a reaction takes place, the enzyme which catalyzes the conversion, and literature references for pathways, reactions, metabolites, and proteins. Last, pathway and disease ontologies were retrieved.The first subquery retrieved all directed metabolic reactions, limited to the species Homo sapiens, with the corresponding Wikidata identifier for these metabolites (and if available the ChEBI and HMDB identifier). This query is depicted in Fig. 3, and divided into six parts for clarity (note that the required prefixes for Blazegraph have been omitted, these are identical to the first part in Fig. 2). The first part describes which properties were retrieved from the RDF. The second part retrieves the identifier and title of the pathway, filtering for human pathways only (note that there are currently more than 30 species available in WikiPathways and that identifiers for metabolites are not species-specific). The third part provides three options: when statement 3A was used, pathways were filtered for the (curated) Analysis Collection; statement 3B filtered for pathways from the Reactome collection; statement 3C filtered for the LIPID MAPS collection; when all three statements were omitted, all pathways were retrieved, regardless of curation status.
The fourth part defines directed reactions and the starting and end point for each reaction; furthermore, details on the type of reaction were retrieved; even though metabolic reactions are mostly conversions, this type of information can be valuable to exclude transport reactions, or interesting when using the approach described in this paper to build a protein–protein or signaling network. The fifth part retrieves the identifiers for the source and target metabolite, which were unified to Wikidata first; after this unification, corresponding ChEBI and HMDB identifiers were also queried, if available in the RDF. The sixth and last part retrieves identifiers from the Rhea interaction database41 (if available in the pathway models), which could be used in the future to add stoichiometry information to the subnetworks or link to kinetic databases.
Fig. 4 depicts the properties retrieved with the second subquery: first, identifiers of the source and target metabolite were retrieved (part 1), which were needed to connect the results from this query to the previous query. Pathway and disease ontology were retrieved (part 2), from which collection this pathway is retrieved (WikiPathways, Reactome, LIPID MAPS) (part 3), and available literature references (either for the pathway, the reaction, or the source or target metabolite) (part 4).
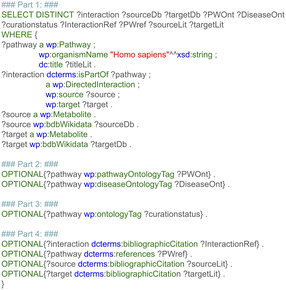 | ||
| Fig. 4 SPARQL query details related to extracting ontologies and references for metabolic reactions from WikiPathways. | ||
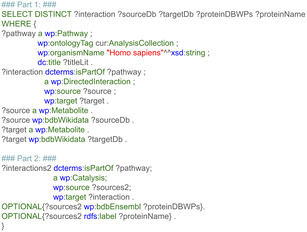
The third subquery (Fig. 5, part 2) retrieved the protein names and corresponding identifiers from Ensembl, which were connected to the metabolic reactions via the relationship “Catalysis”. Ensembl identifiers were used since this database provides unique mappings for proteins and genes within the WikiPathways RDF. The results of the three queries were stored in TSV format.
2.2 Creating and storing the directed small molecules network (DSMN graph database)
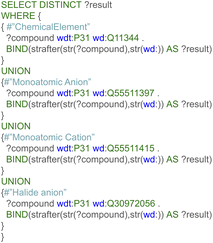
All data was stored in the graph database Neo4j (https://neo4j.com/),27 which is Java-based database software, designed to store and query labeled property graph databases. The data was loaded in the Neo4j Community Edition (version 3.5.7), which is an open-source version distributed under a GPLv3 license (available at: https://neo4j.com/download/). All scripts needed to fill the graph database are available in Java code and for the analysis presented in this paper have been run with Eclipse IDE (2019-12, 4.14.0), 64-bit, Linux (Ubuntu 18.04), see https://github.com/cyneo4j/DSMN. Documentation on setting up the code in Eclipse, downloading and starting Neo4j, and loading data into Neo4j are available in the documentation of this repository, as well as the extended documentation and tutorial website: https://cyneo4j.github.io/DSMN/. The nodes in the network were built from Wikidata, with ChEBI and HMDB added to the final network as “Mapping” Nodes, to allow easy integration with other identifier types commonly used in the metabolomics community.In order to only use the relevant biological reactions for the shortest path calculation, a list of side metabolites was created (Table 1), for which the connected reactions were relabeled in the DSMN graph. This step allowed the algorithm to exclude the full list of metabolites deemed to be irrelevant to the actual biological process. Reactions between two side metabolites were labeled as “:SideInteractions”. The original reactions' metadata properties were copied over to the new “Side interaction” relation, and the old reaction was removed to avoid redundancy in the edge data. The list with side metabolites was established with the following procedure: first, the highest in and out-degree and the number of occurrences of the metabolic reactions in different pathways were calculated. Second, the metabolites having a large in-degree, out-degree, occurring in multiple pathways, or a combination of these items were listed as potential side metabolites. Third, the biological background of these metabolites was investigated in the literature, after which the final list of side metabolites was created. Furthermore, all reactions connected to chemical elements, monoatomic cations, (halide) anions, and spurious nodes (e.g. DNA, RNA, electron), were relabeled in the network as side-metabolite, since these were considered irrelevant for the main biological reaction.
| Biological role | |||
|---|---|---|---|
| Electron donor/receiver | Energy donor/receiver | ||
| Identifier | Name | Identifier | Name |
| Q5203615 | O2 | Q80863, Q27113900 | ATP, ATP4− |
| Q506710 | H+ | Q185253, Q27225748 | ADP, ADP3− |
| Q3154110 | Na+ | Q318369 | AMP |
| Q283 | H2O | Q422582 | GDP |
| Q171877 | H2O2 | Q392227 | GTP |
| Q1997 | CO2 | Q26987754 | NADP+ |
| Q177811 | PO43− | Q26841327 | NADPH |
| Q27104508 | HPO4− | ||
| Q411092 | Pyrophosphoric acid | Q26987253, Q28529711 | NAD+, NAD− |
| Q190901 | Ammonium cation NH4+ | Q26987453, Q27125072 | NADH, NADH2− |
| Q4087 | Ammonia NH3 | Q27102690 | FADH2 |
| Biological role | |
|---|---|
| Miscellaneous, relevant for various metabolic reactions | |
| Identifier | Name |
| Q307434 | S-Adenosyl-L-homocysteine |
| Q201312 | S-Adenosyl-L-methioninate |
| Q407635 | Coenzyme A |
| Q715317 | Acetyl coenzyme A |
| Biological role | |
|---|---|
| Spurious identifiers | |
| Identifier | Name |
| Q7430 | DNA |
| Q11053 | RNA |
| Q172290 | Sulfate ion |
| Q427071Q2225 | Hydroxyl radical electron |
| Q428946 | Iron(II) |
| Q3233795 | Iron(III) |
| Q24301658 | L-Amino acid |
The list of identifiers for these nodes was retrieved with the queries as depicted in Fig. 6 from the SPARQL endpoint of Wikidata (https://query.wikidata.org/) on 2020-11-16.
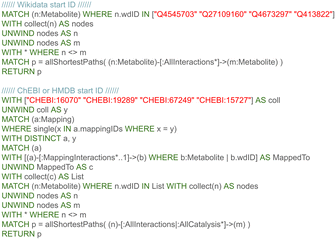
After the primary directed network was constructed, other commonly used database identifiers (ChEBI35 and HMDB36) were added to the model as separate nodes, labeled “:Mapping”. These identifier mapping nodes were connected with their counterpart Wikidata metabolite node through edges labeled as “:MappingInteractions”. These nodes allow querying for old and new HMDB identifier types (making use of the BridgeDb framework directly from the RDF), and ChEBI with and without the prefix “CHEBI:”.
2.3 Subnetwork retrieval for biomarker data visualization
The data was queried with the shortest path algorithm to connect metabolites of interest to one another and retrieve accompanying information (literature, ontologies, pathways). The analyses in this paper were performed with the Neo4j Community Edition (version 3.5.7, Java 8). The data was visualized in Cytoscape (version 3.9.1, Java 11).29 For users who wish to use the GUI of Cytoscape rather than a script, the existing app CyNeo4j (version 2.2.0)42 was extended with the main DSMN functionalities. The Neo4j database containing the DSMN is available at DOI: https://doi.org/10.5281/zenodo.7113243.The first study, MTBLS265,46 compared metabolic profiles with liquid chromatography-mass spectrometry (LC-MS) in blood samples of 15 young (29 ± 4 years of age, 10 male and 5 female) and 15 elderly (81 ± 7 years of age, 4 male and 11 female) healthy individuals (BMI not provided). No information was provided on the ethnicity of the participants. In total, 126 metabolites were identified out of which 14 were found to be age-related, which were determined by comparing the coefficient of variation-results between the two groups. For the data visualization through the DSMN, CV30 and p-values from ESI Dataset S1† as provided in the original paper were used.
The second study, MTBLS404,47 compared urinary profiles with liquid chromatography coupled with high-resolution mass spectrometry (LC-HRMS) for 183 adults (health status unknown, participants with BMI above 32.9 kg m−2 were excluded). The study included 100 males and 83 females (age range: 40.9 ± 10.3 years); no information was shared on the ethnicity of the participants. In total, 120 metabolites were identified, out of which 30 were found to be related to age, by univariate statistics (Spearman rank correlation test) and orthogonal partial least-squares. For the data visualization, the log2 fold changes (log2FC) for urine from Table 1 of the original paper were used, for which all metabolites related to age were annotated with the provided HMDB identifiers; for 22 compounds, no HMDB identifier was provided. If a compound was measured in positive and negative ionization mode, the average value for the log2FC was calculated.
For the third study, Rist et al. ,48 fasting blood and urine samples were analyzed by non-targeted comprehensive two-dimensional gas chromatography (GC × GC)-MS, different targeted GC-MS and LC-MS/MS methods as well as 1H-NMR, for 301 healthy (BMI between 17.8-31.4 kg m−2) men and women; these included 172 men and 129 women (out of which 73 were considered to be postmenopausal) (total group 47.5 ± 17.1 year of age); no information was presented on the ethnicity of the participants. For plasma, more than 400 metabolites were identified, and for urine more than 500, out of which in total 14 were found to be age-related for both fluids independent of sex and therefore used in this analysis. These markers were determined by three machine learning methods, support vector machine (SVM) with linear kernel, generalized linear model net (glmnet), and Partial Least Squares (PLS). In total 19 identifiers were found for these 14 compounds, since several names could be connected to multiple identifiers due to small differences in stereochemistry, e.g.D-ornithine (Q27077099), L-ornithine (Q410198), and DL-ornithine (Q27102952). Thirteen of these identifiers represented plasma biomarkers and six urine.
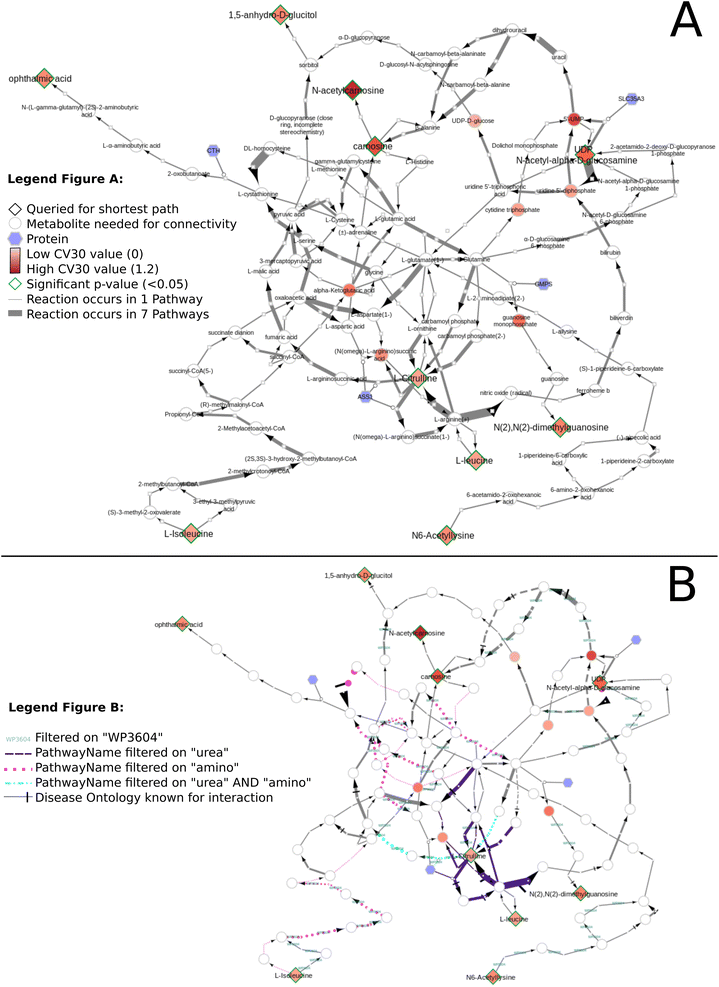
The biomarkers relevant to age where queried against the Neo4j DSMN database using Java (QueryNeo4j_4.java) retrieving the interactions from all databases combined (:AllInteractions) and their corresponding enzymes (:AllCatalysis). Additional data visualization steps were executed in Cytoscape manually; the Cytoscape session files are available in the GitHub repository exampleCytoscapeFiles. The values belonging to the measured biomarkers were added to the relevant subnetworks (‘Import Table from File’ option). The visualization of this data was adapted using the ‘Style’ menu options. The node ‘Fill Color’ (continuous mapping style) was used to represent the main values for each dataset (MTBLS265: CV-30; MTBLS404: log2FC; Rist: SVM). The node ‘Border Paint’ property was set to green using the bypass option for significantly changed metabolites (MTBLS265 and MTBLS404: p-value) or to represent additional data (Rist: glmnet values). The edge ‘Width’ used a column mapping (type continuous) to showcase how often a metabolic conversion reaction occurs in all pathway models. An example visualization script is available using R (https://github.com/cyNeo4j/DSMN/blob/main/visualizationScripts/DatasetVisualization.Rmd) to execute the visualization steps in an automated manner. The interpretation of the subnetworks was performed manually, by comparing statements in the original publication on relevant pathways for their significantly changed metabolites to the edges in the subnetworks using Cytoscape's filter options. This information is visualized in the networks using the edge ‘Stroke Color’ bypass option. For Fig. 11B uses the ‘Target Arrow Shape’ edge bypass property to visualize interactions with information from the Disease Ontology. The comparison between the individual datasets was performed using the ‘Merge’ tool in Cytoscape; the Cytoscape Session file is available at https://github.com/cyNeo4j/DSMN/blob/main/exampleCytoscapeFiles/Network_Comparison_265404Rist.cys.
• naming and storing each shortest path calculation result as a separate network,
• highlighting the metabolites which were queries for the shortest path calculation,
• showing the reactions' occurrence in different pathways by the thickness of the arrows (edges) between the nodes,
• showing a results panel for analyzing which queried metabolites were not part of the graph database or could not be connected through the shortest path query,
• adding a mapped identifiers column, based on the user input (ChEBI or HMDB).
The app visualizes the queried paths in a directed manner, with the prefuse-force directed layout, the identifiers from the Wikidata query as orange nodes, and the occurrence of reactions over different pathways as the edge thickness. Queries were performed against the “:AllInteractions” edges by default. For the main figures presented in this paper, several column filters in Cytoscape were applied to showcase the metadata available in the DSMN. The applied filters are described in the figure captions and can be found in the Layout Tools panel, under the Filter Button, in Cytoscape.
The network was expanded with the names of the compounds and enzymes, and with a chemical structure identifier, which was obtained with the SPARQL query as depicted in Fig. 9.
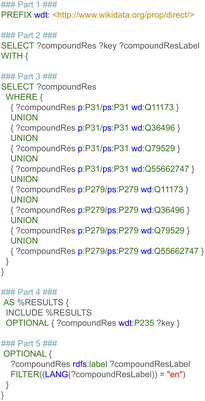 | ||
| Fig. 9 SPARQL query to retrieve names and structural identifiers for Wikidata chemical structures in the Wikidata RDF. | ||
This query retrieves the Wikidata identifier of each metabolite, which has the property “instance of” (p:/ps:P31) or subclass of (p:/ps:P279) connected to the item “chemical compound” (wd:Q11173), “ion” (Q36496), “chemical substance” (Q79529), “pair of enantiomers” (Q55662747), with a UNION-query (part 3). Furthermore, the structural identifiers are retrieved with an optional statement, since these identifiers can be absent from the item (part 4). The name is retrieved in the English language with the filter statement (part 5). The resulting file is further processed by removing the URL in front of the Wikidata identifiers, to be able to connect the identifier directly in Cytoscape with the calculated subnetwork. When chemical entries in Wikidata were not tagged as either chemical compound, substance, ion, or pair of enantiomers, the name was retrieved manually. In a similar fashion, the protein names can be added to the network using their Ensembl identifier.
3 Results
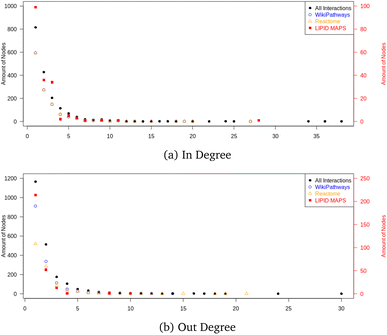
The final graph database contained 16.618 nodes and 34![[thin space (1/6-em)]](https://www.rsc.org/images/entities/char_2009.gif) 703 edges, where 2397 nodes were metabolites and 999 nodes were proteins. The node count also contained mappings to 2204 CHEBI identifiers and 1370 HMDB entries; the remaining nodes were reaction nodes connecting the proteins to their corresponding metabolic conversion(s). Regarding all metabolic conversion data, there were a total of 4358 reactions, with LIPID MAPS representing 379 reactions, the Reactome collection 2,009, the WikiPathways collection containing 2,615, and the Analysis Collection (combining WikiPathways and Reactome) 4209; note that there was overlap between several reactions from the individual databases. The full list of side metabolites contained 212 identifiers, and in total 254 edges were relabeled to belong to side reactions. Fig. 10 shows the in- and out-degree for the full network and the individual collections (LIPID MAPS, Reactome, and WikiPathways) as Quality Control Measures. These degrees counted how many neighbors a node had (without adding the mapping nodes since these would cause additional in-degrees for many nodes without biological meaning). The in- and out-degree distribution showed a scale-free topology typical for real networks. The minimum path length was 1, and the maximum directed path length was 38 (excluding the reaction nodes).
703 edges, where 2397 nodes were metabolites and 999 nodes were proteins. The node count also contained mappings to 2204 CHEBI identifiers and 1370 HMDB entries; the remaining nodes were reaction nodes connecting the proteins to their corresponding metabolic conversion(s). Regarding all metabolic conversion data, there were a total of 4358 reactions, with LIPID MAPS representing 379 reactions, the Reactome collection 2,009, the WikiPathways collection containing 2,615, and the Analysis Collection (combining WikiPathways and Reactome) 4209; note that there was overlap between several reactions from the individual databases. The full list of side metabolites contained 212 identifiers, and in total 254 edges were relabeled to belong to side reactions. Fig. 10 shows the in- and out-degree for the full network and the individual collections (LIPID MAPS, Reactome, and WikiPathways) as Quality Control Measures. These degrees counted how many neighbors a node had (without adding the mapping nodes since these would cause additional in-degrees for many nodes without biological meaning). The in- and out-degree distribution showed a scale-free topology typical for real networks. The minimum path length was 1, and the maximum directed path length was 38 (excluding the reaction nodes).
Fig. 11 presents the shortest path visualization for the first dataset(MTBLS265).46 The calculated shortest path subnetwork (Fig. 11A) contains similar pathways as the original paper (e.g. amino acids (pink), urea cycle (purple)). Furthermore, the nearest neighbors of carnosine (N-actetylcarnosine, L-histidine, adrenaline, and beta-alanine) are also linked to several pathways or underlying biochemical mechanisms mentioned in the original study (e.g. ‘muscle contraction pathway’, ‘alanine and aspartate metabolism’, ‘histidine catabolism’, Fig. 11B). Four biomarkers are not depicted: pantothenic acid (Wikidata identifier:Q179894) is part of several pathways, however, cannot be connected through directed shortest path calculations. N-Acetyl-arginine was not present in any of the three merged pathway databases. Last, NAD+ and NADP+ are labeled side metabolites and therefore not part of the visualization.
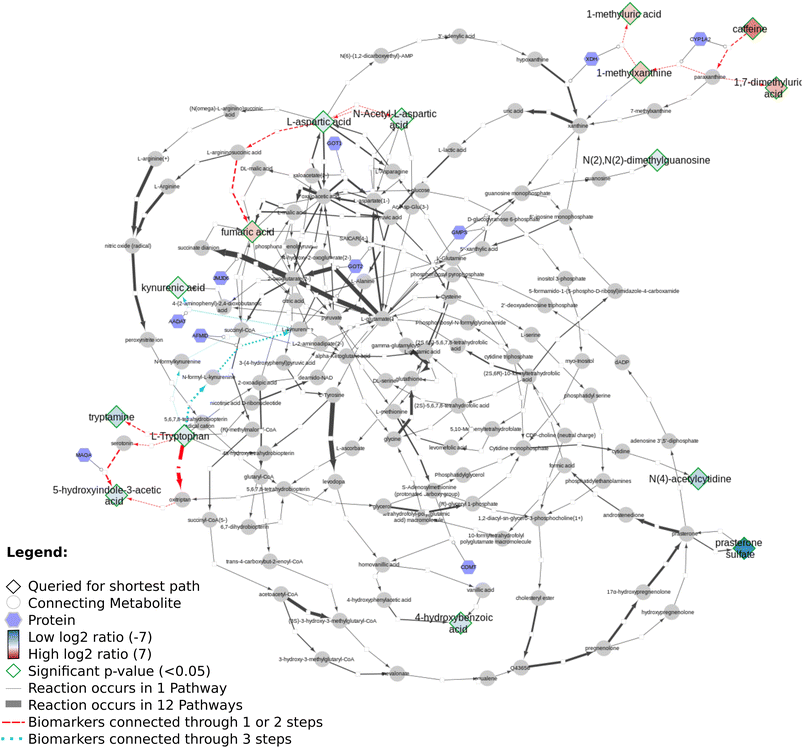
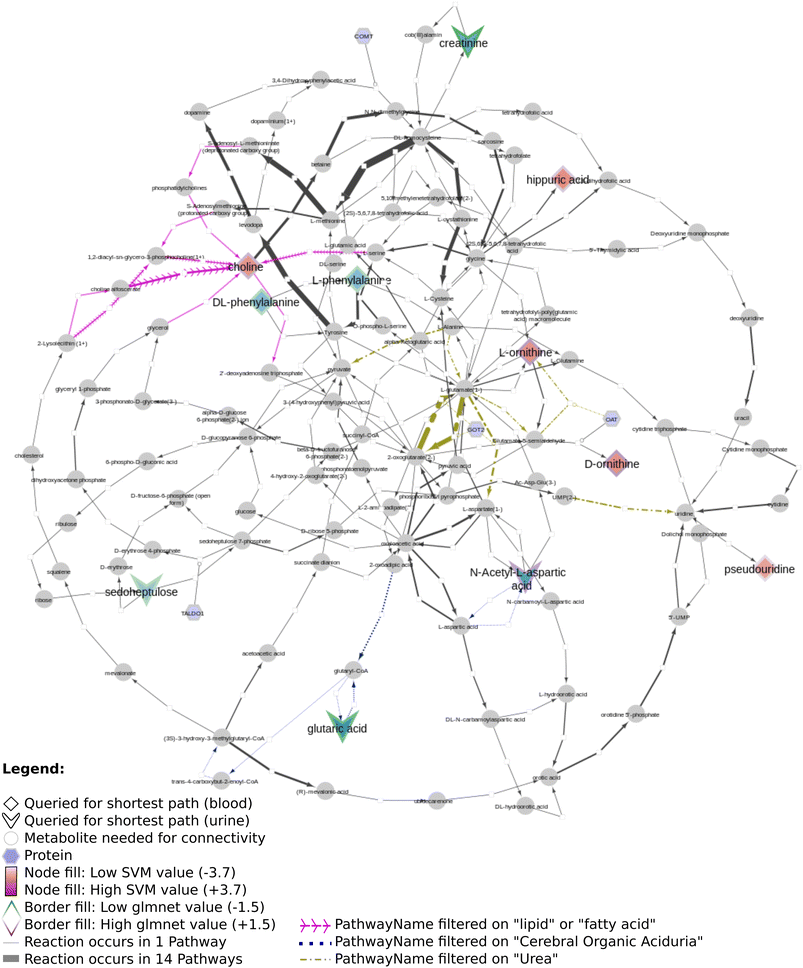
Fig. 12 shows several biomarkers related to age in urine (MTBLS404)47 visualized through the DSMN approach. Red dashed lines show biomarkers only one or two steps removed from one another; blue dotted lines show reactions between biomarkers three steps away. The biomarkers fill color is linked to the log2 values with a blue-white-red gradient depicting negative to positive values. Fifteen compounds out of 30 queried biomarkers could be linked to one another through directed shortest path calculations, one metabolite (pantothenic acid, also measured in the previously described study MTBLS265) was found to be part of the graph database, however not connectable in a directed manner. The remaining biomarkers were not part of the graph database. Fig. 13 visualizes aging biomarkers found in blood or urine for two biological sexes (Rist et al.),48 with diamonds to depict the matrix blood and V-shapes (upside down triangles) urine. Yellow-green dash/dotted lines show Urea (Cycle) pathways; blue dotted lines the Cerebral Organic Acidurias pathway; lipid pathways (including Fatty Acid Beta Oxidation) are depicted with pink contiguous arrows. Eleven compounds out of the 19 queried identifiers could be linked through directed shortest path calculations (including D- and L-ornithine as individual compounds). These included seven (out of thirteen) compounds measured in plasma, and four (out of six) in urine. Eight identifiers could not be found in the whole graph, or are labeled as side metabolites, e.g. potassium. The aging biomarkers were scattered over several pathways, with the urea (cycle) surprisingly not connecting the urinary biomarkers together. Furthermore, two urinary markers (glutaric acid and N-acetyl-L-aspartic acid) are directly linked to the cerebral organic acidurias pathway, which describes the accumulation of organic acids in body fluids; an excess of these acids leads to severe movement symptoms. Last, the biomarker choline (measured in blood samples) is connected to several lipid pathways, at some distance from the other biomarkers.
Regarding all three datasets, no direct overlap between biomarkers in the shortest path subnetworks, however from each dataset one marker remains in a merged network (L-ornithine, L-citrulline, and L-aspartic acid, respectively). The underlying reactions are connected to pathways involving ‘amino acid synthesis, metabolism and catabolism’, ‘glucose metabolism’, ‘branched-chain amino acid metabolism’, ‘pyrimidine metabolism’, several vitamin pathways, and urea (cycle) pathways; these pathways are needed for homeostasis and serve a key role in (healthy) aging.
4 Discussion
Our developed DSMN workflow was tested using three individual datasets to showcase how an unweighted, directed, labeled property bipartite graph database containing metabolic interactions from three unique pathway databases could be used to discover the underlying biochemical mechanisms to interpret biomarkers.The findings from the DSMN for all three datasets are in line with the pathways described in the original publications, showing that the DSMN can be a useful tool to conduct pathway analysis by joining knowledge from three databases in a concise manner. The DSMN analysis of the second dataset (MTBLS404) revealed that several biomarkers are a maximum of three steps removed from one another while sharing similar log2-ratio values. This finding suggests that these metabolites cannot be regarded as independent variables when creating a model to study the variation of the urine metabolome. Cluster analysis in the original publication revealed a similar finding, which can now be backed up by specific pathway knowledge through the DSMN. Two lower abundant biomarkers (L-tryptophan and 5-hydroxy indole-3-acetic acid (5-HIAA)) are only two metabolic reaction steps removed from each other and connected through two reactions, with either serotonin or oxitriptan as intermediate metabolites (Fig. 12 left-hand side). Oxitriptan is an immediate precursor of the neurotransmitter serotonin, and although serotonin has not been detected directly in the original study, the presence of neurotransmitters is known to decline with age.49 Similar behavior for two metabolites in reaction proximity to serotonin is expected. The direct link between L-tryptophan and serotonin, as well as the conversion from oxitriptan to 5-HIAA, have only been described in two individual pathways (WP4210, ‘tryptophan catabolism’, and WP4156, ‘phenylalanine and tetrahydrobiopterin (BH4) metabolism’), which shows the importance of tracing provenance for metabolic reactions in network and graph approaches during interpretation. Two biomarkers are linked through a two-step path (Fig. 12 top center) while having contradicting values for the log2 ratio: L-aspartic acid (−0.84) and fumaric acid (+1.8) (intermediate metabolite N-(L-arginino)succinate). The original study did not find a correlation between these two metabolites; therefore the finding presented in this paper could be an excellent candidate for future research and investigation of e.g. transcriptomics, proteomics, fluxomics, and/or microRNA involvement to understand the underlying biological mechanisms related to these contradicting metabolic abundances.
Even though the use of a public (metabolomics) repository using standardized formats for data annotation should make manual identifier mapping unnecessary, the reality turned out to be different. For example, the metabolites found to be related to age in MTBLS440 were described in a table in the accompanying paper; however, the table was constructed as a figure and HMDB identifiers were used in the paper, whereas the metabolites in the repository were annotated with ChEBI identifiers. Furthermore, the names of the compounds mentioned in the paper did not always match with the ones in the repository (since the protonation calculations on the chemical structures in ChEBI and HMDB differ, leading to different mappings from ChEBI to HMDB and vice versa). For the third dataset (Rist et al.) only the top 25 changed metabolites were given, other metabolites contributing to the model to a lesser degree could not be obtained, without redoing the original analysis. Finding and reanalyzing (public) metabolomics data is a time-consuming task due to the issues mentioned above.
The DSMN addresses several issues known in biochemical graph modeling, by using a bipartite model including reaction directionality and excluding side metabolites. Defining which metabolites should be excluded from a graph model is difficult, especially if the data used to build the model does not include a clear mechanism to differentiate between “main reaction participants” and “side reaction participants”. The DSMN was built using the harmonized semantic web format (RDF) from the native PathVisio data format (GPML). Fig. 14 gives an example of a pathway drawing in GPML, where a single substrate is converted to a single product with one enzyme catalyzing the reaction, using ATP to start the reaction and releasing ADP as a side product (this reaction could have a reaction type “phosphorylation”).
The reaction formula reads ‘1 substrate + 1 ATP → (enzyme) → 1 product + 1 ADP’. In order to model this information in a machine-readable manner, no difference between side and main metabolites was made in the RDF structure, and therefore four possible combinations of source → target could be retrieved. From these combinations, only two were biologically correct (substrate → product and ATP → ADP), out of which only one was interesting to query for the shortest path (substrate → product). The presence of recurring side metabolites and metabolic reactions created so-called “hub nodes” in a network, which could lead to shortcuts for the shortest path calculation since all these conversions would be linked to each other through one ATP to ADP conversion. By using a different label on the edge for ‘SideInteractions', the shortest path algorithm could skip these reactions leading to a faster query time. Users could use this label to exclude additional reaction paths which they believe are not relevant for their subnetwork and dataset.
To interpret the visualizations from a shortest path calculation the following should be taken into account. First, the created DSMN is unweighted; therefore the same weight is assigned to each edge in the graph. Other paths could be (more) relevant, depending on enzyme kinetics. However, this data needs to be very accurate when used in modeling approaches, and protein kinetics are substantially different between model species (or cell lines) and humans.50 Furthermore, these kinetics are tissue-dependent, which is difficult to model within pathway databases and directed graphs; including transport reactions would create paths pointing to the same compound, a known issue for shortest path algorithms.24 Gene regulation and protein–protein interactions are not part of the DSMN; when these dynamics are added (e.g. through Michaelis–Menten modeling or mass-actions kinetics), the resulting network will be far more complex due to the highly diverse set of flow patterns, complicating interpretation.51 To avoid shortcuts while calculating the shortest path, metabolites labeled as “side metabolites”- even though relevant for electron and energy exchange – are disregarded, and therefore also not part of the visualizations.
Identifiers from Wikidata34 were used as unique identifiers for the metabolite nodes, offering several advantages. First, Wikidata provides the possibility to annotate chemical compounds with identifiers with (in)complete stereochemistry; this partial identification is very useful when the analytical technique used (such as mass spectrometry) is incapable of determining the exact stereochemistry for a metabolite. Wikidata provides separate identifiers for charge states of several compounds, different stereoisomers, and (racemic) mixtures or undefined isomerism. Furthermore, pathways or metabolic reactions in literature can be described using incomplete stereochemistry. If the reaction information from these sources could not be used in our approach, a great deal of data would be lost. Second, Wikidata can be directly updated by users when information is missing or erroneous. In order for the shortest path calculation algorithm to work properly, entities in a network should have one unique identifier describing them, or a reproducible method should be in place to define which identifiers can be merged. Since no such method currently exists, we decided to create a network consisting of unique identifiers (described in Section 2.1.3). This approach also avoided redundancy in the database, allowing for faster querying times. The labeling from Neo4j was used to add mapping nodes for two databases commonly used to annotate metabolite datasets with ChEBI and HMDB. This graph database structure also creates the opportunity for users to add their own identifier mappings to the DSMN, and query these identifiers with the app in Cytoscape without further adjustments, providing a flexible graph database.
Shortest path calculations are computationally expensive, especially for a graph with long paths and high connectivity. Neo4j will first use the fast bidirectional breadth-first search algorithm when all nodes in the calculated paths have the same label, e.g. ‘Metabolite’. The shortest path Cypher query used for the DSMN (Fig. 8) avoids creating a Cartesian product, by first matching all the biomarkers used in the query and then only considering paths between these nodes (rather than all nodes in the graph). This approach avoids slow performance, produces smaller amounts of data, and shows fast query processing time.
For the presented research, three databases distributing their molecular reaction data under a CC0 license were investigated. There are various other databases available with metabolic reaction data, ranging from pathway to network models, and from signaling to protein interaction to metabolic pathways (an overview can be found at http://pathguide.org/). For the addition of new databases to the DSMN in the future, the graph could incorporate neutral InChIKeys to merge entries with the same stereochemistry but different charges. This addition could also be used for a comparative evaluation of the DSMN content against other databases to evaluate overlap, consistency, and differences between the DSMN and other computational metabolic network resources. Such a comparison is currently complicated by small differences in stereochemistry or charge states of small molecules, discrepancies in cross-referencing between databases, as well as different levels of detail of modeled reactions. Additional resources could be used to extend the DSMN by users of the DSMN, without changing the model itself, to increase the coverage of metabolic reactions even further. However, there are some considerations to take into account when integrating these databases:
• KEGG52 is a well-known pathway database, which provides reaction information (https://www.genome.jp/kegg/reaction/), build on literature which is connected to their pathways (not directly to the reactions). This data is retrievable in an automated way through their Applicable Programming Interface (API), available at https://www.kegg.jp/kegg/rest/keggapi.html. The reaction information in KEGG is not directed, potentially causing biologically irrelevant paths when added to the DSMN. KEGG reactions provide a clear differentiation between side and main reactions by defining compound pairs according to a reaction classification pattern.53 Atom mappings are used to complete reaction equations if needed and to categorize the reactions in different subcategories. The reactions in KEGG are annotated with their own identifier type (starting with an R), and a link out to Rhea is provided on the website (not through the API). KEGG also uses its own identifier structure for metabolites (starting with a C for compounds, and a D for drugs); many of these are part of Wikidata and could therefore be added to the graph database as mapping identifiers. However, KEGG requires a license to work with their data; therefore we cannot include their data in the DSMN graph for redistribution.
• MetaCyc,54 part of the BioCyc database collection, also allows for the retrieval of reactions in their pathways through an API (https://biocyc.org/web-services.shtml) and is built with an extensive literature background; even though this literature is depicted on the website in the pathway browser, the references are not directly connected to the reactions in the API. These reactions are directional, which can be deduced from the information provided in a ptools-xml format, where the substrate(s) are listed under “left” and the product(s) under “right”. Since MetaCyc uses its own identifier structure (starting with “META:” and then an (abbreviated form of) the name of a compound), additional identifier mapping is needed to connect the information from this database to the network (which can be done by making an additional call to their API). The identifiers from MetaCyc are currently not part of Wikidata. No difference is made between side and main metabolic reactions, and reactions are annotated with their own identifier structure (for example “META:6PGLUCONOLACT-RXN”), with a link out to Rhea and KEGG. The addition of these identifiers can create ambiguity between identifiers describing the seemingly same reaction (since Rhea supports both directed and undirected reactions, while the latter only are listed in KEGG). Even though the data of MetaCyc is free to use, a license has to be requested to obtain the data, therefore not allowing this data to be distributed through the DSMN.
• The Small Molecule Pathway DataBase (SMPDB, http://smpdb.ca/),55 provides pathways aimed at metabolite and drug interactions. The data can be downloaded in several formats, including BioPax and SBML, which are compatible with the output from WikiPathways after converting to a GPML model. However, the data format is not directly the same as the WikiPathways RDF, therefore the queries described previously have to be rewritten to obtain the reaction information from these formats. Directional reactions are provided, and several databases are used for the identification of compounds (e.g. HMDB, Drugbank, ChemSpider, PubChem). No difference is made between the main and side reaction(s) (participants). In order to build a comprehensive metabolic network extending the DSMN, identifier standardization to one database is required, which would mean an additional step before the data of SMPDB can be integrated. The data is free to use in non-commercial settings.
• Pathway Commons56 is a database that aims to merge information from more than twenty public pathway- and interaction databases in one structured setting. The data is available through an API (https://www.pathwaycommons.org/pc2/), based on the BioPax model from the various pathway databases. No difference is made between the main and side reaction(s) (participants). A search query can be performed to find metabolic reactions; the reaction partners can then be extracted with another query. Reaction information can also be retrieved indirectly for proteins and metabolites (with a nearest neighbor search) using the relationship ‘used-to-produce’, providing directed relationships between two metabolites (example as SIF format: http://www.pathwaycommons.org/pc2/graph?source=http://identifiers.org/chebi/CHEBI:16349%26kind=neighborhood%26format=SIF for L-citrulline, ChEBI ID:16349). The identifiers are unified to ChEBI for metabolites and HGNC-names for proteins, although the query itself can contain a mix of URIs from UniProt, NCBI Gene, and ChEBI IDs. The output does not provide information from which database the reaction information originates, nor a (potential) publication connected to a reaction. Even though the unification of several pathway databases creates a massive knowledgebase, information will get lost in this unification process, which should be taken into account when extending the DSMN, as well as the lack of provenance.
5 Conclusions
A workflow was developed to query and visualize biological pathways involved in sparse metabolomics data. Using knowledge from three pathway resources, directed networks between active metabolites (biomarkers) from metabolomics data can be visualized and extended with additional knowledge. The data is made interoperable by collapsing metabolites in the pathways onto single nodes using ontological approaches. This explicit ontological linking allows for precise biological interpretation of the paths. By using Neo4j and Cytoscape, the computational calculation environment for larger networks as well as advanced visualization functionality to investigate the identified subnetworks are ensured. The generic nature of this approach opens up the option to combine with other omics data sources, such as proteomics and transcriptomics.Data availability
Data and processing scripts for this paper, including metabolic aging biomarker data are available at GitHub at [https://github.com/cyneo4j/DSMN]; the Neo4j database containing the DSMN is available at Zenodo at [https://doi.org/10.5281/zenodo.7113243].Author contributions
Data curation, formal analysis, investigation, validation, visualization, and project administration was performed by DS. MK, DS, and EW developed the software, conceptualization of the research, and methodology. Supervision of the project was performed by MK and EW. Writing – original draft (DS), writing – review and editing: all authors (DS, MK, CE, EW).Conflicts of interest
The authors declare no competing financial interests.Acknowledgements
We would like to thank all curators of the WikiPathways content; their contributions lead to the knowledge currently captured in WikiPathways. Furthermore, we want to thank the LIPID MAPS and Reactome teams for their collaboration and attitude toward free pathway data distribution, since this allowed (re)using the knowledge gathered by their teams in new applications. Thanks to Ammar Ammar (https://orcid.org/0000-0002-8399-8990) for dockerizing the Reactome Converter, and Tooba Abbassi-Daloii (https://orcid.org/0000-0002-4904-3269) for testing the DSMN setup in the Windows operating system. We want to thank the original developers of the CyNeo4j app, particularly Georg Summer (https://orcid.org/0000-0002-8774-7507). Last, thanks to Jonathan Mélius (https://orcid.org/0000-0001-8624-2972) for aligning the app to be developed further in this project.References
- C. H. Johnson, J. Ivanisevic and G. Siuzdak, Metabolomics: beyond biomarkers and towards mechanisms, Nat. Rev. Mol. Cell Biol., 2016, 17, 451–459 CrossRef CAS PubMed.
- A. Mastrokolias, R. Pool, E. Mina, K. M. Hettne, E. van Duijn, R. C. van der Mast, G. van Ommen, P. A. C. ’t Hoen, C. Prehn, J. Adamski and W. van Roon-Mom, Integration of targeted metabolomics and transcriptomics identifies deregulation of phosphatidylcholine metabolism in Huntington's disease peripheral blood samples, Metabolomics, 2016, 12, 137 CrossRef PubMed.
- W. Lu, X. Su, M. S. Klein, I. A. Lewis, O. Fiehn and J. D. Rabinowitz, Metabolite Measurement: Pitfalls to Avoid and Practices to Follow, Annu. Rev. Biochem., 2017, 86, 277–304 CrossRef CAS PubMed.
- S. Alseekh, A. Aharoni, Y. Brotman, K. Contrepois, J. D'Auria, J. Ewald, J. C Ewald, P. D. Fraser, P. Giavalisco, R. D. Hall, M. Heinemann, H. Link, J. Luo, S. Neumann, J. Nielsen, L. Perez de Souza, K. Saito, U. Sauer, F. C. Schroeder, S. Schuster, G. Siuzdak, A. Skirycz, L. W. Sumner, M. P. Snyder, H. Tang, T. Tohge, Y. Wang, W. Wen, S. Wu, G. Xu, N. Zamboni and A. R. Fernie, Mass spectrometry-based metabolomics: a guide for annotation, quantification and best reporting practices, Nat. Methods, 2021, 18, 747–756 CrossRef CAS.
- E. Poggiogalle, H. Jamshed and C. M. Peterson, Circadian regulation of glucose, lipid, and energy metabolism in humans, Metabolism, 2018, 84, 11–27 CrossRef CAS PubMed.
- A. Kerimi, N. U. Kraut, J. A. da Encarnacao and G. Williamson, The gut microbiome drives inter-and intra-individual differences in metabolism of bioactive small molecules, Sci. Rep., 2020, 10, 19590 CrossRef CAS.
- O. A. Zeleznik, C. Wittenbecher, A. Deik, S. Jeanfavre, J. Avila-Pacheco, B. Rosner, K. M. Rexrode, C. B. Clish, F. B. Hu and A. H. Eliassen, Intrapersonal stability of plasma metabolomic profiles over 10 years among women, Metabolites, 2022, 12, 372 CrossRef CAS PubMed.
- A. D. Maher, S. F. Zirah, E. Holmes and J. K. Nicholson, Experimental and analytical variation in human urine in 1H NMR spectroscopy-based metabolic phenotyping studies, Anal. Chem., 2007, 79, 5204–5211 CrossRef CAS.
- K. A. Veselkov, L. K. Vingara, P. Masson, S. L. Robinette, E. Want, J. V. Li, R. H. Barton, C. Boursier-Neyret, B. Walther and T. M. Ebbels, et al., Optimized preprocessing of ultra-performance liquid chromatography/mass spectrometry urinary metabolic profiles for improved information recovery, Anal. Chem., 2011, 83, 5864–5872 CrossRef CAS PubMed.
- U. Ceglarek, A. Leichtle, M. Bruegel, L. Kortz, R. Brauer, K. Bresler, J. Thiery and G. M. Fiedler, Challenges and developments in tandem mass spectrometry based clinical metabolomics, Mol. Cell. Endocrinol., 2009, 301, 266–271 CrossRef CAS PubMed.
- M. A. Skinnider, J. W. Squair and L. J. Foster, Evaluating measures of association for single-cell transcriptomics, Nat. Methods, 2019, 16, 381–386 CrossRef CAS.
- C. Wieder, C. Frainay, N. Poupin, P. Rodríguez-Mier, F. Vinson, J. Cooke, R. P. Lai, J. G. Bundy, F. Jourdan and T. Ebbels, Pathway analysis in metabolomics: Recommendations for the use of over-representation analysis, Expert Rev. Proteomics, 2021, 17, e1009105 CAS.
- L. Perez De Souza, S. Alseekh, Y. Brotman and A. R. Fernie, Network-based strategies in metabolomics data analysis and interpretation: From molecular networking to biological interpretation, PLoS Comput. Biol., 2020, 17, 243–255 CAS.
- S. Mubeen, C. T. Hoyt, A. Gemünd, M. Hofmann-Apitius, H. Fröhlich and D. Domingo-Fernández, The Impact of Pathway Database Choice on Statistical Enrichment Analysis and Predictive Modeling, Front. Genet., 2019, 10, 1203 CrossRef CAS.
- S. M. Lam, Z. Wang, B. Li and G. Shui, High-coverage lipidomics for functional lipid and pathway analyses, Anal. Chim. Acta, 2021, 1147, 199–210 CrossRef CAS PubMed.
- J. Ma, A. Shojaie and G. Michailidis, A comparative study of topology-based pathway enrichment analysis methods, BMC Bioinf., 2019, 20, 1–14 CrossRef CAS.
- N. Pearcy, J. J. Crofts and N. Chuzhanova, Hypergraph models of metabolism, Int. J. Agric. Biol. Vet. Agric. Food Eng., 2014, 8, 752–756 Search PubMed.
- C. Frainay and F. Jourdan, Computational methods to identify metabolic sub-networks based on metabolomic profiles, Briefings Bioinf., 2017, 18, 43–56 CrossRef CAS PubMed.
- A. Lambert, J. Dubois and R. Bourqui, Pathway preserving representation of metabolic networks, Comput. Graph. Forum, 2011, 1021–1030 CrossRef.
- R. Montanez, M. A. Medina, R. V. Sole and C. Rodríguez-Caso, When metabolism meets topology: Reconciling metabolite and reaction networks, Bioessays, 2010, 32, 246–256 CrossRef CAS.
- J. M. Posma, S. L. Robinette, E. Holmes and J. K. Nicholson, MetaboNetworks, an interactive Matlab-based toolbox for creating, customizing and exploring sub-networks from KEGG, Bioinformatics, 2014, 30, 893–895 CrossRef CAS.
- N. Swainston, R. Batista-Navarro, P. Carbonell, P. D. Dobson, M. Dunstan, A. J. Jervis, M. Vinaixa, A. R. Williams, S. Ananiadou, J.-L. Faulon, P. Mendes, D. B. Kell, N. S. Scrutton and R. Breitling, biochem4j: Integrated and extensible biochemical knowledge through graph databases, PLoS One, 2017, 12, e0179130 CrossRef.
- V. B. O'Donnell, E. A. Dennis, M. J. O. Wakelam and S. Subramaniam, LIPID MAPS: Serving the next generation of lipid researchers with tools, resources, data, and training, Sci. Signaling, 2019, 12, eaaw2964 CrossRef PubMed.
- A. Fabregat, K. Sidiropoulos, G. Viteri, O. Forner, P. Marin-Garcia, V. Arnau, P. D'Eustachio, L. Stein and H. Hermjakob, Reactome pathway analysis: a high-performance in-memory approach, BMC Bioinf., 2017, 18, 142 CrossRef PubMed.
- D. N. Slenter, M. Kutmon, K. Hanspers, A. Riutta, J. Windsor, N. Nunes, J. Mélius, E. Cirillo, S. L. Coort, D. Digles, F. Ehrhart, P. Giesbertz, M. Kalafati, M. Martens, R. Miller, K. Nishida, L. Rieswijk, A. Waagmeester, L. M. T. Eijssen, C. T. Evelo, A. R. Pico and E. L. Willighagen, WikiPathways: a multifaceted pathway database bridging metabolomics to other omics research, Nucleic Acids Res., 2018, 46, D661–D667 CrossRef CAS.
- Y. Theoharis, Y. Tzitzikas, D. Kotzinos and V. Christophides, On graph features of semantic web schemas, IEEE Trans. Knowl. Data Eng.v, 2008, 20, 692–702 Search PubMed.
- J. Webber, A programmatic introduction to Neo4j, Conference Proceeding SPLASH '12, 2012 Search PubMed.
- G. A. Pavlopoulos, M. Secrier, C. N. Moschopoulos, T. G. Soldatos, S. Kossida, J. Aerts, R. Schneider and P. G. Bagos, Using graph theory to analyze biological networks, BioData Min., 2011, 1, 10 CrossRef PubMed.
- P. Shannon, A. Markiel, O. Ozier, N. S. Baliga, J. T. Wang, D. Ramage, N. Amin, B. Schwikowski and T. Ideker, Cytoscape: a software environment for integrated models of biomolecular interaction networks, Genome Res., 2003, 13, 2498–2504 CrossRef CAS PubMed.
- M. Martens, A. Ammar, A. Riutta, A. Waagmeester, D. N. Slenter, K. Hanspers, R. A. Miller, D. Digles, E. N. Lopes, F. Ehrhart, L. J. Dupuis, L. A. Winckers, S. L. Coort, E. L. Willighagen, C. T. Evelo, A. R. Pico and M. Kutmon, WikiPathways: connecting communities, Nucleic Acids Res., 2021, 49, D613–D621 CrossRef CAS PubMed.
- A. Bohler, G. Wu, M. Kutmon, L. A. Pradhana, S. L. Coort, K. Hanspers, R. Haw, A. R. Pico and C. T. Evelo, Reactome from a WikiPathways Perspective, PLoS Comput. Biol., 2016, 12, e1004941 CrossRef PubMed.
- M. P. van Iersel, T. Kelder, A. R. Pico, K. Hanspers, S. Coort, B. R. Conklin and C. Evelo, Presenting and exploring biological pathways with PathVisio, BMC Bioinf., 2008, 9, 399 CrossRef.
- M. P. van Iersel, A. R. Pico, T. Kelder, J. Gao, I. Ho, K. Hanspers, B. R. Conklin and C. T. Evelo, The BridgeDb framework: standardized access to gene, protein and metabolite identifier mapping services, BMC Bioinf., 2010, 11, 5 CrossRef.
- A. Waagmeester, G. Stupp, S. Burgstaller-Muehlbacher, B. M. Good, M. Griffith, O. L. Griffith, K. Hanspers, H. Hermjakob, T. S. Hudson, K. Hybiske, S. M. Keating, M. Manske, M. Mayers, D. Mietchen, E. Mitraka, A. R. Pico, T. Putman, A. Riutta, N. Queralt-Rosinach, L. M. Schriml, T. Shafee, D. Slenter, R. Stephan, K. Thornton, G. Tsueng, R. Tu, S. Ul-Hasan, E. Willighagen, C. Wu and A. I. Su, Wikidata as a knowledge graph for the life sciences, Elife, 2020, 9, e52614 CrossRef.
- J. Hastings, G. Owen, A. Dekker, M. Ennis, N. Kale, V. Muthukrishnan, S. Turner, N. Swainston, P. Mendes and C. Steinbeck, ChEBI in 2016: Improved services and an expanding collection of metabolites, Nucleic Acids Res., 2016, 44, D1214–D1219 CrossRef CAS PubMed.
- D. S. Wishart, Y. D. Feunang, A. Marcu, A. C. Guo, K. Liang, R. Vázquez-Fresno, T. Sajed, D. Johnson, C. Li, N. Karu, Z. Sayeeda, E. Lo, N. Assempour, M. Berjanskii, S. Singhal, D. Arndt, Y. Liang, H. Badran, J. Grant, A. Serra-Cayuela, Y. Liu, R. Mandal, V. Neveu, A. Pon, C. Knox, M. Wilson, C. Manach and A. Scalbert, HMDB 4.0: the human metabolome database for 2018, Nucleic Acids Res., 2018, 46, D608–D617 CrossRef CAS.
- D. Slenter and BiGCaT, Metabolite BridgeDb ID Mapping Database (20201104), Figshare, 2020, DOI:10.6084/m9.figshare.12782264.v1.
- K. L. Howe, P. Achuthan, J. Allen, J. Allen, J. Alvarez-Jarreta, M. R. Amode, I. M. Armean, A. G. Azov, R. Bennett, J. Bhai, K. Billis, S. Boddu, M. Charkhchi, C. Cummins, L. Da Rin Fioretto, C. Davidson, K. Dodiya, B. El Houdaigui, R. Fatima, A. Gall, C. Garcia Giron, T. Grego, C. Guijarro-Clarke, L. Haggerty, A. Hemrom, T. Hourlier, O. G. Izuogu, T. Juettemann, V. Kaikala, M. Kay, I. Lavidas, T. Le, D. Lemos, J. Gonzalez Martinez, J. C. Marugán, T. Maurel, A. C. McMahon, S. Mohanan, B. Moore, M. Muffato, D. N. Oheh, D. Paraschas, A. Parker, A. Parton, I. Prosovetskaia, M. P. Sakthivel, A. I. A. Salam, B. M. Schmitt, H. Schuilenburg, D. Sheppard, E. Steed, M. Szpak, M. Szuba, K. Taylor, A. Thormann, G. Threadgold, B. Walts, A. Winterbottom, M. Chakiachvili, A. Chaubal, N. De Silva, B. Flint, A. Frankish, S. E. Hunt, G. R. IIsley, N. Langridge, J. E. Loveland, F. J. Martin, J. M. Mudge, J. Morales, E. Perry, M. Ruffier, J. Tate, D. Thybert, S. J. Trevanion, F. Cunningham and A. D. Yat, Ensembl 2021, Nucleic Acids Res., 2021, 49, D884–D891 CrossRef CAS PubMed.
- BiGCaT, Gene/Protein BridgeDb ID Mapping Database (Ensembl 91), Zenodo, 2020, DOI:10.5281/zenodo.3667670.
- A. Waagmeester, M. Kutmon, A. Riutta, R. Miller, E. L. Willighagen, C. T. Evelo and A. R. Pico, Using the Semantic Web for Rapid Integration of WikiPathways with Other Biological Online Data Resources, PLoS Comput. Biol., 2016, 12, e1004989 CrossRef.
- A. Morgat, T. Lombardot, K. B. Axelsen, L. Aimo, A. Niknejad, N. Hyka-Nouspikel, E. Coudert, M. Pozzato, M. Pagni, S. Moretti, S. Rosanoff, J. Onwubiko, L. Bougueleret, I. Xenarios, N. Redaschi and A. Bridge, Updates in Rhea - an expert curated resource of biochemical reactions, Nucleic Acids Res., 2017, 45, D415–D418 CrossRef CAS.
- G. Summer, T. Kelder, K. Ono, M. Radonjic, S. Heymans and B. Demchak, cyNeo4j: connecting Neo4j and Cytoscape, Bioinformatics, 2015, 31, 3868–3869 CrossRef CAS.
- E. W. Dijksta, A note on two problems in connection with graphs, Numer. Math., 1959, 1, 269–271 CrossRef.
- C. Y. Lee, An Algorithm for Path Connections and Its Applications, IEEE Trans. Electron. Comput., 1961, 3, 346–365 Search PubMed.
- K. Haug, R. M. Salek, P. Conesa, J. Hastings, P. de Matos, M. Rijnbeek, T. Mahendraker, M. Williams, S. Neumann, P. Rocca-Serra, E. Maguire, A. González-Beltrán, S.-A. Sansone, J. L. Griffin and C. Steinbeck, MetaboLights–an open-access general-purpose repository for metabolomics studies and associated meta-data, Nucleic Acids Res., 2013, 41, D781–D786 CrossRef CAS PubMed.
- R. Chaleckis, I. Murakami, J. Takada, H. Kondoh and M. Yanagida, Individual variability in human blood metabolites identifies age-related differences, Proc. Natl. Acad. Sci. U. S. A., 2016, 113, 4252–4259 CrossRef CAS.
- E. A. Thévenot, A. Roux, Y. Xu, E. Ezan and C. Junot, Analysis of the Human Adult Urinary Metabolome Variations with Age, Body Mass Index, and Gender by Implementing a Comprehensive Workflow for Univariate and OPLS Statistical Analyses, J. Proteome Res., 2015, 14, 3322–3335 CrossRef.
- M. J. Rist, A. Roth, L. Frommherz, C. H. Weinert, R. Krüger, B. Merz, D. Bunzel, C. Mack, B. Egert, A. Bub, B. Görling, P. Tzvetkova, B. Luy, I. Hoffmann, S. E. Kulling and B. Watzl, Metabolite patterns predicting sex and age in participants of the Karlsruhe Metabolomics and Nutrition (KarMeN) study, PLoS One, 2017, 12, e0183228 CrossRef PubMed.
- R. Peters, Ageing and the brain, Postgrad. Med. J., 2006, 82, 84–88 CrossRef CAS.
- H. E. Benson, S. Watterson, J. L. Sharman, C. P. Mpamhanga, A. Parton, C. Southan, A. J. Harmar and P. Ghazal, Is systems pharmacology ready to impact upon therapy development? A study on the cholesterol biosynthesis pathway, Br. J. Pharmacol., 2017, 174, 4362–4382 CrossRef CAS.
- U. Harush and B. Barzel, Dynamic patterns of information flow in complex networks, Nat. Commun., 2017, 8, 218 CrossRef.
- M. Kanehisa and S. Goto, KEGG: kyoto encyclopedia of genes and genomes, Nucleic Acids Res., 2000, 28, 27–30 CrossRef CAS.
- M. Kotera, Y. Okuno, M. Hattori, S. Goto and M. Kanehisa, Computational assignment of the EC numbers for genomic-scale analysis of enzymatic reactions, J. Am. Chem. Soc., 2004, 126, 16487–16498 CrossRef CAS PubMed.
- R. Caspi, R. Billington, I. M. Keseler, A. Kothari, M. Krummenacker, P. E. Midford, W. K. Ong, S. Paley, P. Subhraveti and P. D. Karp, The MetaCyc database of metabolic pathways and enzymes - a 2019 update, Nucleic Acids Res., 2020, 48, D445–D453 CrossRef CAS.
- T. Jewison, Y. Su, F. M. Disfany, Y. Liang, C. Knox, A. Maciejewski, J. Poelzer, J. Huynh, Y. Zhou, D. Arndt, Y. Djoumbou, Y. Liu, L. Deng, A. C. Guo, B. Han, A. Pon, M. Wilson, S. Rafatnia, P. Liu and D. S. Wishart, SMPDB 2.0: big improvements to the Small Molecule Pathway Database, Nucleic Acids Res., 2014, 42, D478–D484 CrossRef CAS.
- E. G. Cerami, B. E. Gross, E. Demir, I. Rodchenkov, O. Babur, N. Anwar, N. Schultz, G. D. Bader and C. Sander, Pathway Commons, a web resource for biological pathway data, Nucleic Acids Res., 2011, 39, D685–D690 CrossRef CAS.
Footnote |
| † Electronic supplementary information (ESI) available: Data and processing scripts for this paper, including metabolic aging biomarker data are available at GitHub at [https://github.com/cyneo4j/DSMN]; the Neo4j database containing the DSMN is available at Zenodo at [https://doi.org/10.5281/zenodo.7113243]. See DOI: https://doi.org/10.1039/d3dd00069a |
| This journal is © The Royal Society of Chemistry 2024 |

