 Open Access Article
Creative Commons Attribution 3.0 Unported Licence
Apples to apples: shift from mass ratio to additive molecules per electrode area to optimize Li-ion batteries
Bojing
Zhang†‡§
 *,
Leon
Merker
,
Monika
Vogler
 ,
Fuzhan
Rahmanian†‡§
 and
Helge S. Stein†‡§
 *
*
Helmholtz Institute Ulm, Helmholtzstr. 1, 89737 Ulm, Germany. E-mail: bojing.zhang@tum.de; hstein@tum.de
First published on 30th May 2024
Abstract
Electrolyte additives in liquid electrolyte batteries can trigger the formation of a protective solid electrolyte interphase (SEI) at the electrodes e.g. to suppress side reactions at the electrodes. Studies of varying amounts of additives have been done over the last few years, providing a comprehensive understanding of the impact of the electrolyte formulation on the lifetime of the cells. However, these studies mostly focused on the variation of the mass fraction of additive in the electrolyte while disregarding the ratio (radd) of the additive's amount of substance (nadd) to the electrode area (Aelectrode). Herein we utilize our accurate automatic battery assembly system (AUTOBASS) to vary electrode area and amount of substance of the additive. Our data provides evidence that reporting the mass ratios of electrolyte components is insufficient and the amount of substance of additive relative to the electrodes' area should be reported. Herein, the two most utilized additives, namely fluoroethylene carbonate (FEC) and vinylene carbonate (VC) were studied. Each additive was varied from 0.1 wt-%–3.0 wt-% for VC, and 5 wt-%–15 wt-% for FEC for two electrode loadings of 1 mA h cm−2 and 3 mA h cm−2. To help the community to find better descriptors, such as the proposed radd, we publish the dataset alongside this manuscript. The active electrode placement correction reduces the failure rate of our automatically assembled cells to 3%.
Introduction
Lithium-ion batteries have become a ubiquitously used electrochemical energy storage method in portable electronics and vehicles.1 However, the extension of cycle and calendar life are of high interest for established and next-generation chemistries.2–4 To further improve the cell performance and lifetime,5 electrolyte additives are typically used. Fluoroethylene carbonate (FEC)6 and vinylene carbonate (VC)7 are the two most well-known, most frequently used, and most studied additives in electrolyte formulations. Many studies have demonstrated that the addition of FEC predominantly contributes to an improved cycle stability of the cells by facilitating the formation of a robust and uniform SEI film on the anode material.6,8,9 On the other hand, the presence of VC in the electrolyte can normally lead to an improved SEI on the graphite electrode by reducing itself instead of ethylene carbonate (EC)7,9 whilst forming a protective layer. Some studies also indicate that one of the benefits of adding VC is to greatly suppress the rate of parasitic reactions as well as the electrolyte oxidation at the cathode.8,10,11Both the FEC and the VC have been shown to significantly improve the cycle stability and lifespan of lithium ion batteries. Further investigations on the impact of varying the concentration of both additives have also been done over the past years. Those studies have demonstrated different optimal concentrations for both additives to enhance the cell performance.10 It is found that for the additive FEC, a volumetric rate of 7 wt-% is sufficient to boost capacity retention12 to 82.75% after 50 cycles. For VC, the optimal concentration is highly application dependent. According to a study by Burns et al.13 based on LiCoO2/graphite, it is found that 2 wt-% seem to be an optimal concentration to reach a satisfactory cycling performance. However, they also found that concentrations above 1 wt-% lead to higher cell impedance. Further investigation on the high VC concentration (∼6 wt-%) show that a trade-off between lifespan and cell impedance can be observed.13,14
There are comprehensive investigations on varying the amount of additives (e.g. VC, FEC) in the electrolyte though these studies only relate the weight or volume ratios of the additives to the rest of the electrolyte and not the surface area where they are (re)acting.9,14 The important distinction to make here is the difference between the electrode area and the available active material surface area. While the geometric electrode area can remain constant a doubled mass loading will roughly correspond to a 100% increase of active material surface area (assuming negligible particle cracking and binder–surface interactions). To the best of our knowledge, there are presently no studies on reporting the systematic variation of additive amounts based on additive molecules per active material surface area where both are varied.
There are reports, that under a threshold amount of 5% additive either by weight or volume (w.r.t. other electrolyte components and not electrode) the cycle life for Li-ion batteries is significantly impacted.15 More specifically, it was observed by Burns et al.16 that within the weight percentage of 6% (again w.r.t. the electrolyte components alone) an increasing concentration of VC resulted in improved coulombic efficiency and longer cycle life. We have found none but one study that looks at a variable ratio of additives to the effective surface area of negative electrode17 where the VC to graphite surface area was found to be a parameter impacting the impedance of anode and cathode. The unique precision and accuracy of AUTOBASS5,18 allow us to perform a comprehensive study on varying additive amounts and electrode surface areas (through different loadings). Whilst the initial version of AUTOBASS did not have active corrections for electrode placements we now report an update to the system that allows not just for micrometer exact placements of the electrodes but also nanoliter exact dispensation of electrolytes through the addition of an automated pipette.
Methods
System design
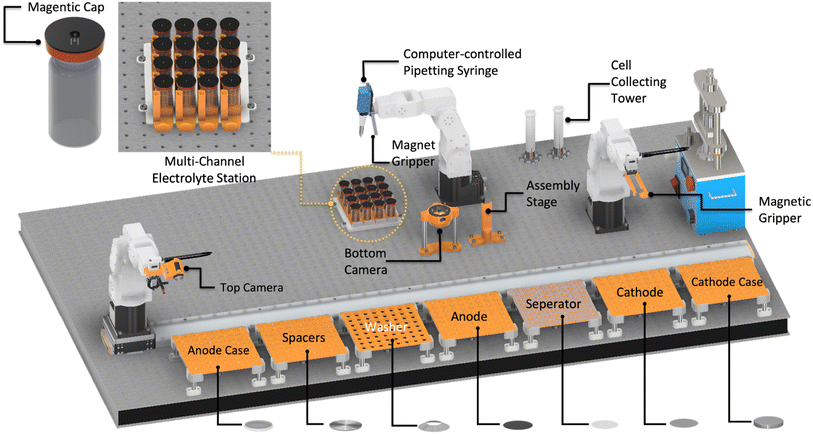
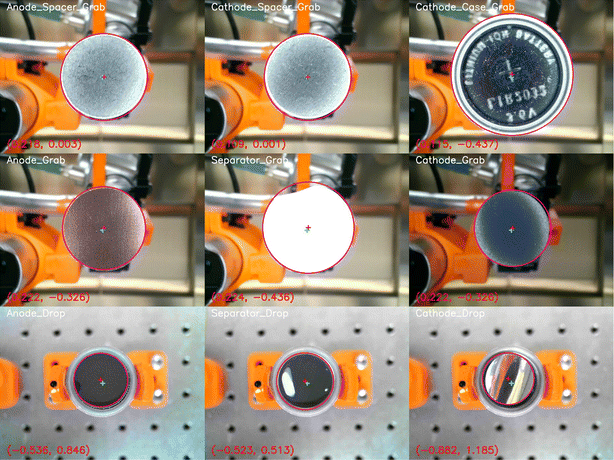
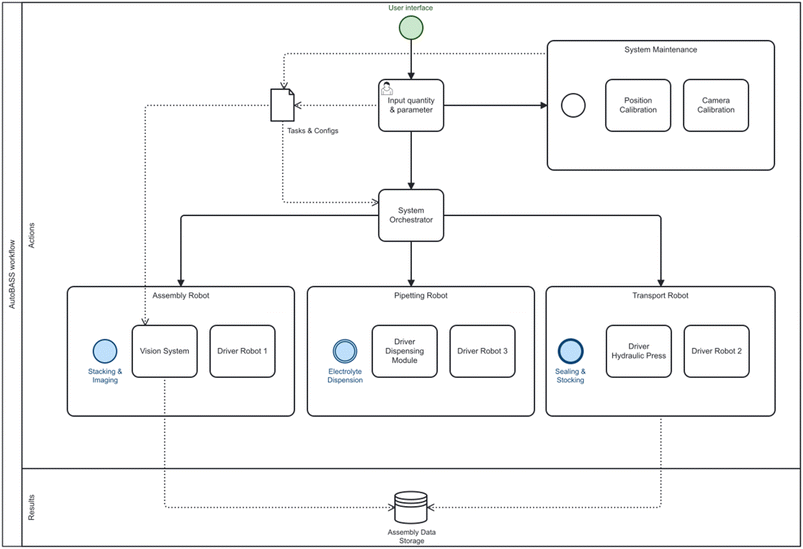
This paper's methods are based on the automatic battery assembly system (AUTOBASS),5,18 that is capable of assembling 64 CR2032 (20 mm diameter, 3.2 mm height) coin cells with excellent reproducibility and full data lineage tracking. Herein we report an update to the first version of AUTOBASS as shown in Fig. 1, which is now able to automatically adjust the position of components, increasing the accuracy of the assembly even further. To further minimize the cell-to-cell variation, an optical sensing system was developed to compensate for the random offset error caused during the grabbing of the components. The system's vision system is composed of two self-modified webcams (Hama C-800 Pro) and (Microsoft LifeCam Studio) integrated in a 3D-printed holder, the bottom camera with a 2K resolution is installed on the optical table next to the assembly stage, the top camera with 1080P resolution is integrated with the end-effector and mounted on the assembly robot (Fig. 1 left). By performing the automated correction, the assembly robot first picks up the component from the tray with the vacuum gripper, then moves it above the bottom camera approx. 5 cm high, the bottom camera takes the live image of vacuum gripper grabbing the component, hough circle transform method supplied by openCV19 will be applied to the image, the circle edge of the component will be detected and the center coordinate will be extracted in the form of pixel numbers (x, y), by comparing it with the tool center point that is pre-calibrated in the image frame the offset of the components will be then computed in pixel variation (Δx, Δy) and transferred into 3D real-world offsets by utilizing a homographic transformation, thus implement compensation accordingly when eventually place the component onto the building stage or stack of other components. Subsequent to the drop of the component, the building robot will adjust its position, positioning the lens of the top camera towards the component dropped earlier and take the image. An assessment of offset from the center of the building stage will again be performed using the same process as for the bottom camera, and the information is recorded together with the images (as an example shown in Fig. 2). However, it needs to be noted that, in the recorded images (shown as an example in Fig. 2 bottom), the offset value printed on the left bottom of the image belongs to the metadata that produced during the processing, the value is calculated based on the pixel value of the detected components' central and image central, which is manually calibrated to be directly objecting onto the physical central point of the building stage, additionally, due to the resolution variance of the top camera and the image distortion the absolute offset is scaled to an order based on our empirical calibration and computation of 0.2, the actual offset between each active component (electrodes and separator) which also matters most in the cell assembly is therefore yield through the difference of the values. Additionally, to further increase throughput and productivity, a multithreaded operation has been implemented during assembly, in which the operations such as removing caps from the vials as well as aspirating electrolyte from the stock solution is implemented simultaneously while stacking the inactive components, also when dealing with batch assembly of cells is synchronized in the way that the next cell is started while the previous cell is crimping. This results in an average assembly time of 3.8 minutes for each cell which is a speedup of almost a factor of 2x and pushing the fabrication time of one batch of 64 cells to a little over 4 hours. Another significant optimization of the system is the newly integrated multi-pipetting system, with which 16 stock solutions of electrolyte can be handled. In this design, 16 vials of electrolytes are kept in the 4 × 4 tray (Top left in Fig. 1) with specific 3D printed capes embedded with magnets to prevent evaporation during the operation. The caps were designed into two separate layers and manufactured in a dual-extrusion process with an advanced 3D printer (Ultimaker® Model S5): the top layer is made of Polylactide (PLA Ultimaker®) with a circular hole to hold the magnet and the bottom layer is made of flexible thermoplastic polyurethane (TPU 90 Ultimaker®) to provide proper sealing with the vial opening, then a pellet-shape magnet (ø2 mm × 1 mm) is manually placed into the hole and sealed with tapes. While ejecting electrolyte, the 6-axis-robot approaches each individual cap effector which is also embedded with a magnet to remove the cap. The robot performs a swerving motion to switch to the pipetting tool (r-line from sartorius) and locate itself above the pipetting tip that belongs to the electrolyte stocking element individually. The tip is attached to the dispensing pipett's sleeve by a forced motion and displaced into the vial to perform aspiration of the electrolyte. The pipette is guaranteed to have a random error of less than 0.5 μL. Only during the necessary handling time of the electrolyte the lid of the vial is opened. The time from first electrolyte dispensation to cell closing is the exact same as demonstrated in the original AUTOBASS paper.5The code and 3D printed files are available at AutoBASS_2.0. Similar to the previous version of AutoBASS, the operation of the latest system can be implemented through a user-friendly interface supported by the python tkinter, structuring of the script is schematically represented in Fig. 3, first, individual driver (blue rectangle) is programmed for each device, robot stations (orange circles) integrate coupled devices to perform specific actions (as purple hexagon) which need to be carried out during the assembly, and finally, those actions are subsequently orchestrated by an overall script (yellow circle) according to the validated command transferred from the user interface (green circle).
Experimental design
In this paper, 3 batches of experiments were designed to study the impact of molar additive amount relative to the ratio of active surface area. Based on the formula, which is one of the most widely used in the commercial electrolyte for Li ion batteries, we set the formulation of 1 M LiPF6 in EC![[thin space (1/6-em)]](https://www.rsc.org/images/entities/char_2009.gif) :
:![[thin space (1/6-em)]](https://www.rsc.org/images/entities/char_2009.gif) EMC 3
EMC 3![[thin space (1/6-em)]](https://www.rsc.org/images/entities/char_2009.gif) :
:![[thin space (1/6-em)]](https://www.rsc.org/images/entities/char_2009.gif) 7 (wt%) (E-Lyte Innovations) as our baseline electrolyte and prepared the target electrolyte with various of additive amount. We have studied electrolytes with two different additives namely VC (E-Lyte Innovations) and FEC (E-Lyte Innovations), for each additive we have used four different weight percentages of additives trying to cover the common range of interesting ratios. For batch FEC we have 5 wt-%, 7.5 wt-%, 12.5 wt-% and 15 wt-% and for the VC batch, we have 0.1 wt-%, 0.5 wt-%, 2.5 wt-% and 3.0 wt-%. The electrode material used was supplied through the BIG-MAP project (The Battery Interface Genome – Materials Acceleration Platform). The cathode electrode was Lithium Nickel Oxide (LNO) coated on an aluminum sheet supplied by BASF with 94 wt% of active material, 3 wt% of PVDF binder and 3 wt% of conductive carbon with two different mass loadings, namely 1 mA h cm−2 and 3 mA h cm−2. The anode electrode was Graphite coated on an copper foil supplied by CIDETEC containing 94% C-NERGY ACTILION GHDR 15–4 (Imerys), 2% C45 (Timcal), 2% CMC (Chempoint), 2% SBR (Zeon) with balanced mass loading. For the active material surface area we assume a Brunauer–Emmett–Teller (BET) surface area of 4.1 m2 g−1 as per the Imerys data sheet. The separator material we used is Celgard 2325 with a thickness of 25 μm. The thickness of the anode after calendering was measured by the manufacturers to be 39 μm and 82 μm and the thickness of the cathode was measured to be 15 μm and 43 μm after calendering for the two different mass loadings of 1 mA h cm−2 and 3.1 mA h cm−2. Electrodes were not calendered to the same thickness. The total amount of electrolyte is kept constant at 35 μL for both loadings. This is the exact same chemistry as in the original AutoBASS paper.5
7 (wt%) (E-Lyte Innovations) as our baseline electrolyte and prepared the target electrolyte with various of additive amount. We have studied electrolytes with two different additives namely VC (E-Lyte Innovations) and FEC (E-Lyte Innovations), for each additive we have used four different weight percentages of additives trying to cover the common range of interesting ratios. For batch FEC we have 5 wt-%, 7.5 wt-%, 12.5 wt-% and 15 wt-% and for the VC batch, we have 0.1 wt-%, 0.5 wt-%, 2.5 wt-% and 3.0 wt-%. The electrode material used was supplied through the BIG-MAP project (The Battery Interface Genome – Materials Acceleration Platform). The cathode electrode was Lithium Nickel Oxide (LNO) coated on an aluminum sheet supplied by BASF with 94 wt% of active material, 3 wt% of PVDF binder and 3 wt% of conductive carbon with two different mass loadings, namely 1 mA h cm−2 and 3 mA h cm−2. The anode electrode was Graphite coated on an copper foil supplied by CIDETEC containing 94% C-NERGY ACTILION GHDR 15–4 (Imerys), 2% C45 (Timcal), 2% CMC (Chempoint), 2% SBR (Zeon) with balanced mass loading. For the active material surface area we assume a Brunauer–Emmett–Teller (BET) surface area of 4.1 m2 g−1 as per the Imerys data sheet. The separator material we used is Celgard 2325 with a thickness of 25 μm. The thickness of the anode after calendering was measured by the manufacturers to be 39 μm and 82 μm and the thickness of the cathode was measured to be 15 μm and 43 μm after calendering for the two different mass loadings of 1 mA h cm−2 and 3.1 mA h cm−2. Electrodes were not calendered to the same thickness. The total amount of electrolyte is kept constant at 35 μL for both loadings. This is the exact same chemistry as in the original AutoBASS paper.5
Cycling and testing protocol
Assembled cells were stored in an inert atmosphere with the cathode side down (spacer up) for 24 h to ensure good wetting of the electrodes. The following cycling procedure was programmed in a Arbin battery cycler (LBT21084-5): formation charging at constant current of C-Rate C/10 a potential of 4.2 V which was kept until a current of less than C/20 was reached. Formation discharge was performed under a constant current of C/10; repetitive charging and discharging under these conditions was performed three times before the standard Constant-Current/Constant-Voltage (CCCV) cycling at 1C with the same cut-off voltage of 4.2 V and cutoff-current of C/20. A total of 200 CCCV cycles was performed with Internal Resistance (IR) checks every 50 cycles. In the IR check step, a CV step with a C-rate of C/10 is performed until the cut-off voltage of 4.2 V is reached, which is again kept until C/20, after 30 minutes of resting a fast discharge with 2C is performed for 30 seconds, then, after 10 minutes of resting, a discharge with constant current C/10 is applied until cell voltage reaches 2.5 V.Results
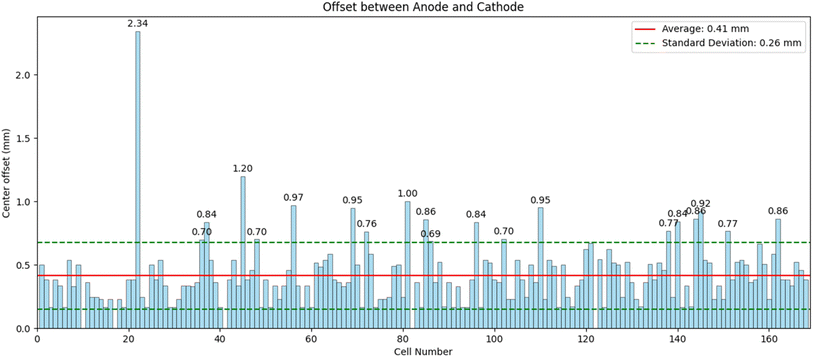
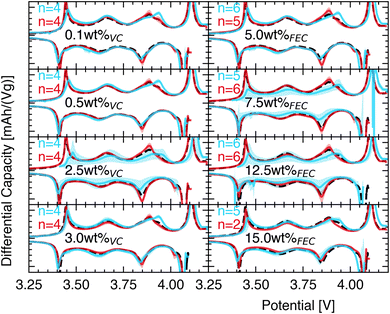
Cells were manufactured according to the method section using the AUTOBASS system.Based on the optical analysis on the photographs of the anodes and cathodes taken during assembly, the relative geometric L2-norm offset between the anode and cathode centers of all assembled 169 cells is shown in Fig. 3. The average offset is 410 μm and a standard deviation 260 μm (Fig. 4). In total 20 out of 169 cells were observed with offsets above 690 μm. All errors originate largely from a miscalculated central point abritute to the curving of the negative electrodes. We believe this error could be mitigated through a precession movement around the center of the gripper to reconstruct the electrode including its curvature in 3D. All manufactured cells were stored for 24 hours with the cathode facing downwards in the glovebox (spring upward). This is to ensure good wetting prior to testing. Cells that passed formation passed through two hundred 1C/1D CCCV cycles and IR drop tests every 50 cycles. From all 169 cells produced a total of 5 did not pass through formation (short circuit detected) and were discarded as faults. Due to a wrong procedure setup in a second battery cycler setup 63 cells were discarded due to overcharging that led to premature aging. In the first cycle the formation voltage exhibited large amounts of noise, likely attributable to gas formation as observed in previous studies on this material.5 The analysis in Fig. 5 therefore shows the differential capacity analysis20–22 of the second formation cycle. Shown are the base dQ/dV plots i.e. the average dQ/dV of a batch of seven cells that did not have any additive in the electrolyte. This is compared at different additive weight ratios in the electrolyte to two mass loadings on the electrodes in blue (loading of 1 mA h cm−2) and red (loading of 3 mA h cm−2) in a balanced cell i.e. the anode and cathode have the same capacity per area. It is evident from Fig. 5 that adding different amounts of additive to the electrolyte leads to changes in the shape of the differential capacity. The most prominent difference is observed at the charge peaks at 3.65 V and 3.85 V that alter their intensity with different additive amounts. The differential capacity here is scaled gravimetrically to allow comparisons across areal loadings.
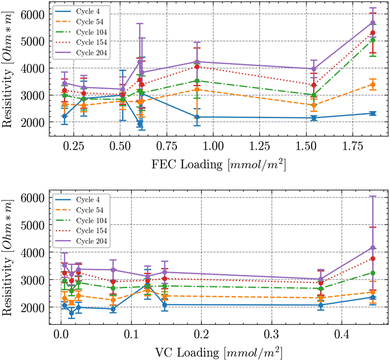
The challenge when criticizing a commonly used and convenient factor like wt-% loading of additives in the electrolyte is that one needs to propose a better descriptor. From a fundamental point of view it should be the surface area of the electrode where the additive reacts to form the solid electrolyte interphase (SEI). Hence we propose to use the ratio of the amount of substance of additive per electrode surface area – referring to the active material surface measured by BET on the powder prior to coating and calendering. We assume that the SEI will primarily grow on the active material surface and neglect the influence of binder and conductive carbon. Furthermore, we neglect any particle cracking upon calendering. We calculate the active anode material area through the mass loading of the electrodes and the specific surface area of the active material provided by the manufacturer (Imerys). The amount of substance of the additives in the electrolyte were set through gravimetric mixing and verified by NMR. The internal resistance was measured from the voltage drop from 100% SOC (here defined as the point after a CV phase at 4.2 V until a current equivalent to C/20 was reached with a subsequent to a 30 min rest) through a 2D discharge pulse as described in the Methods section. The resulting data is shown in Fig. 6. Since the active material area of the two mass loadings used is different the IR drop needs to be recalculated into resistivity. For this calculation one needs the area through which the current passes and the distance through which it is passed. Since all charge needs to pass through the particle surface we assume the surface to be the BET area and the average distance to be the sum of the thickness of the separator and half or the thickness of the anode and cathode after calendering as reported in the Methods section. The resulting resistivity vs. additive loading (measured in μmol m−2) is shown in Fig. 6. The resulting graphs show that for the two closeby loadings around 0.6 mmol m−2 the resistivities are relatively close by after about 54 cycles (within the error margins calculated from the statistics from all cells with the respective loading). Overall there is an upward resistivity trend with cycles and FEC loading. For VC there is a trend of increasing resistivity with cycles but only a minor upward trend with VC loading. To the best of our knowledge this is the first report of electrolyte additive influence that spans electrode loading/thickness. Overall these plots provide evidence that the electrodes surface area should always be considered when working with additives.
Conclusion
We herein present an updated automatic battery assembly system capable of automatically stacking of electrodes with active placement correction and highly accurate combinatorial electrolyte dispensation. The system can correct wrongly picked parts and reduces failure rates to 3%. This system was utilized to elucidate additive amount influence on cell parameters through studying hundreds of cells. The data suggests that a better descriptor to study the effect of additives onto the cell is additive loading onto the active material surface particle area.Data availability
The data presented in this manuscript is available at https://zenodo.org/records/11060629 the code to build AutoBass V2 is available at https://github.com/Helge-Stein-Group/AutoBASS.Conflicts of interest
There are no conflicts to declare.Acknowledgements
This project received funding from the European Union's Horizon 2020 research and innovation programm under grant agreement No. 957189. The project is part of BATTERY 2030+, the large-scale European research initiative for inventing sustainable batteries for the future. BATTERY 2030+ funded by European Union's Horizon 2020 research and innovation program under Grant Agreement No. 957213.References
- J. Amici, P. Asinari, E. Ayerbe, P. Barboux, P. Bayle-Guillemaud, R. J. Behm, M. Berecibar, E. Berg, A. Bhowmik and S. Bodoardo, others. A Roadmap for Transforming Research to Invent the Batteries of the Future Designed within the European Large Scale Research Initiative BATTERY 2030+, Adv. Energy Mater., 2022, 2102785 CrossRef CAS
.
- A. Bhowmik, M. Berecibar, M. Casas-Cabanas, G. Csanyi, R. Dominko, K. Hermansson, M. R. Palacin, H. S. Stein and T. Vegge, Implications of the BATTERY 2030+ AI-Assisted Toolkit on Future Low-TRL Battery Discoveries and Chemistries, Adv. Energy Mater., 2021, 2102698 Search PubMed
.
- M. Fichtner, K. Edström, E. Ayerbe, M. Berecibar, A. Bhowmik, I. E. Castelli, S. Clark, R. Dominko, M. Erakca, A. A. Franco and others, Rechargeable Batteries of the Future—the State of the Art from a BATTERY 2030+ Perspective, Adv. Energy Mater., 2022, 12(17), 2102904 CrossRef CAS
.
- M. Fichtner, Recent Research and Progress in Batteries for Electric Vehicles, Batteries Supercaps, 2022, 5(2), 1–9, DOI:10.1002/batt.202100224
.
- B. Zhang, L. Merker, A. Sanin and H. S. Stein, Robotic Cell Assembly to Accelerate Battery Research, Digital Discovery, 2022, 1(6), 755–762, 10.1039/D2DD00046F
.
- T. Hou, G. Yang, N. N. Rajput, J. Self, S.-W. Park, J. Nanda and K. A. Persson, The Influence of FEC on the Solvation Structure and Reduction Reaction of LiPF6/EC Electrolytes and Its Implication for Solid Electrolyte Interphase Formation, Nano Energy, 2019, 64, 103881, DOI:10.1016/j.nanoen.2019.103881
.
- D. Aurbach, K. Gamolsky, B. Markovsky, Y. Gofer, M. Schmidt and U. Heider, On the Use of Vinylene Carbonate (VC) as an Additive to Electrolyte Solutions for Li-Ion Batteries, Electrochim. Acta, 2002, 47(9), 1423–1439, DOI:10.1016/S0013-4686(01)00858-1
.
- S. Dalavi, P. Guduru and B. L. Lucht, Performance Enhancing Electrolyte Additives for Lithium Ion Batteries with Silicon Anodes, J. Electrochem. Soc., 2012, 159(5), A642–A646, DOI:10.1149/2.076205jes
.
- A. M. Haregewoin, A. S. Wotango and B.-J. Hwang, Electrolyte Additives for Lithium Ion Battery Electrodes: Progress and Perspectives, Energy Environ. Sci., 2016, 9(6), 1955–1988, 10.1039/C6EE00123H
.
- F. Lindgren, C. Xu, L. Niedzicki, M. Marcinek, T. Gustafsson, F. Björefors, K. Edström and R. Younesi, SEI Formation and Interfacial Stability of a Si Electrode in a LiTDI-Salt Based Electrolyte with FEC and VC Additives for Li-Ion Batteries, ACS Appl. Mater. Interfaces, 2016, 8(24), 15758–15766, DOI:10.1021/acsami.6b02650
.
- S. J. An, J. Li, C. Daniel, D. Mohanty, S. Nagpure and D. L. Wood, The State of Understanding of the Lithium-Ion-Battery Graphite Solid Electrolyte Interphase (SEI) and Its Relationship to Formation Cycling, Carbon, 2016, 105, 52–76, DOI:10.1016/j.carbon.2016.04.008
.
- J. Park, I. Choi, M. J. Lee, M. H. Kim, T. Lim, K. H. Park, J. Jang, S. M. Oh, S. K. Cho and J. J. Kim, Effect of Fluoroethylene Carbonate on Electrochemical Battery Performance and the Surface Chemistry of Amorphous MoO2 Lithium-Ion Secondary Battery Negative Electrodes, Electrochim. Acta, 2014, 132, 338–346, DOI:10.1016/j.electacta.2014.03.173
.
- J. C. Burns, R. Petibon, N. Nelson, N. N. Sinha, A. Kassam, B. M. Way and J. R. Dahn, Studies of the Effect of Varying Vinylene Carbonate (VC) Content in Lithium Ion Cells on Cycling Performance and Cell Impedance, J. Electrochem. Soc., 2013, 160, A1668, DOI:10.1149/2.031310jes
.
- J. C. Burns, N.
N. Sinha, D. J. Coyle, G. Jain, C. M. VanElzen, W. M. Lamanna, A. Xiao, E. Scott, J. P. Gardner and J. R. Dahn, The Impact of Varying the Concentration of Vinylene Carbonate Electrolyte Additive in Wound Li-Ion Cells, J. Electrochem. Soc., 2011, 159(2), A85–A90, DOI:10.1149/2.028202jes
.
- S. S. Zhang, A Review on Electrolyte Additives for Lithium-Ion Batteries, J. Power Sources, 2006, 162(2), 1379–1394, DOI:10.1016/j.jpowsour.2006.07.074
.
- J. C. Burns, R. Petibon, K. J. Nelson, N. N. Sinha, A. Kassam, B. M. Way and J. R. Dahn, Studies of the Effect of Varying Vinylene Carbonate (VC) Content in Lithium Ion Cells on Cycling Performance and Cell Impedance, J. Electrochem. Soc., 2013, 160(10), A1668, DOI:10.1149/2.031310jes
.
- D. Pritzl, S. Solchenbach, M. Wetjen and H. A. Gasteiger, Analysis of Vinylene Carbonate (VC) as Additive in Graphite/LiNi0.5Mn1.5O4 Cells, J. Electrochem. Soc., 2017, 164(12), A2625, DOI:10.1149/2.1441712jes
.
- H. S. Stein, A. Sanin, F. Rahmanian, B. Zhang, M. Vogler, J. K. Flowers, L. Fischer, S. Fuchs, N. Choudhary and L. Schroeder, From Materials Discovery to System Optimization by Integrating Combinatorial Electrochemistry and Data Science, Curr. Opin. Electrochem., 2022, 101053 CrossRef CAS
.
-
A. Kaehler and G. Bradski, Learning OpenCV 3, O'Reilly Media, Inc., 2016 Search PubMed
.
- J. P. Badiali, M. L. Rosinberg and J. Goodisman, Contribution of the Metal to the Differential Capacity of an Ideally Polarisable Electrode, J. Electroanal. Chem. Interfacial Electrochem., 1983, 143(1–2), 73–88, DOI:10.1016/S0022-0728(83)80255-1
.
- A. J. Smith, J. C. Burns and J. R. Dahn, High-Precision Differential Capacity Analysis of LiMn 2 O 4/Graphite Cells, Electrochem. Solid-State Lett., 2011, 14(4), A39–A41, DOI:10.1149/1.3543569
.
- A. J. Smith and J. R. Dahn, Delta Differential Capacity Analysis, J. Electrochem. Soc., 2012, 159(3), A290–A293, DOI:10.1149/2.076203jes
.
Footnotes |
| † Present Address: Technische Universität München, TUM School of Natural Sciences, Department of Chemistry, Lichtenbergstr. 4, 85748 Garching near Munich. |
| ‡ Present Address: Munich Data Science Institute (MDSI), Walther-von-Dyck Str. 10, 85748 Garching bei München. |
| § Present Address: Munich Institute for Robotic and Machine Intelligence (MIRMI), Georg-Brauchle-Ring 60–62, 80992 Munich. |
| This journal is © The Royal Society of Chemistry 2024 |

