 Open Access Article
Creative Commons Attribution 3.0 Unported Licence
Influence of annealing temperature on persistent luminescence in BaAl2O4:Eu2+/Eu3+ nanocrystals and its application for latent fingerprint detection†
Shivaramu
Nagarasanakote Jayaramu
 *,
Divya
Janardhana
,
Lucas J. B.
Erasmus
,
Elizabeth
Coetsee
 *,
David E.
Motaung
 and
Hendrik C.
Swart

Department of Physics, University of the Free State, Bloemfontein, ZA-9300, South Africa. E-mail: nj.shivaram@gmail.com; coetseee@ufs.ac.za
First published on 25th September 2024
Abstract
The luminescent properties of europium (Eu) doped BaAl2O4 phosphors were strongly influenced by post-annealing temperatures for blue-green persistent luminescence and latent fingerprints (LFPs). The X-ray powder diffraction patterns of the BaAl2O4: 1 mol% Eu nanophosphor, annealed between 1000 and 1300 °C, indicated a hexagonal ferroelectric phase. The X-ray photoelectron spectroscopy (XPS) revealed that the Ba atoms occupied two different sites in the BaAl2O4. The XPS and photoluminescence (PL) results revealed the presence of Eu3+ and Eu2+ states. The Eu-doped BaAl2O4 showed the characteristic red emission of Eu3+ at 251 and 464 nm excitations, while excitations at 340 and 380 nm showed yellowish-green emission. Strong evidence of energy transfer between a charge transfer band and the different energy levels of Eu2+ and Eu3+ ions was obtained. The existence of the Cr ion impurity in the aluminates was confirmed with UV-VIS diffuse reflectance and PL spectroscopy. The present results suggested that  and O′′i defects have introduced electron and hole traps in the host that acted as luminescent centers for persistent luminescence. LFPs detection using BaAl2O3:Eu2+/Eu3+ phosphor showed an excellent marking agent for applications in forensic science.
1. Introduction
The alkaline earth aluminates are chemically and thermally stable at room temperature (RT) and at atmospheric pressure.1 Barium aluminate (BaAl2O4) is one of the best aluminate materials for making light-emitting diodes (LEDs) and for long persistent luminescence (persL).1,2 Many studies were conferred on various preparation techniques because the crystallite or particle size greatly influences the luminescent properties.1,3,4 The paraelectric–ferroelectric (PE–FE) phases exhibit stuffed tridymite BaA12O4 and these phases have a hexagonal crystal structure.5,6 The structure is represented as a derivative of tridymite with the corners sharing an AlO4 tetrahedra that forms a three-dimensional framework where the hexagonal channels are filled with Ba atoms. The structure of the PE phase belongs to the P6322 space group, with lattice parameters of about a = 5.22 Å and c = 8.78 Å and a unit-cell volume of 207.43 Å3.6 Whereas the FE phase exhibit a super-structure with space group P63, a = 10.47 Å, c = 8.82 Å and a unit-cell volume of 837.23 Å3.5 The difference is mostly identified by the configuration of the A1–O strings oriented along the c-axis. All the strings are equal in the PE phase while straight and uneven strings alternate in an ordered behaviour in the FE phase. This result in Bragg reflections that correspond to double the a and b unit-cell parameters. It is due to small atomic displacements from the real structure that lead to a reduction of symmetry to P63.5 Horkner and Müller-Bushbaum5 observed the FE phase from single crystal X-ray diffraction (XRD) of BaAl2O4 at low temperature and Huang et al.6 reported it from a powder form of BaAl2O4. The stoichiometry of a hexagonal BaAl2O4 matrix showed complicated polymorphism as a function of temperature,7,8 when studied by X-ray powder diffraction (XRPD).9Oxygen interstitials or oxygen vacancies are created at alkaline metal ion sites in the barium aluminate matrix after the substitution of trivalent or divalent lanthanide ions.1 Oxygen interstitials and oxygen vacancies act as hole and electron traps located above the valence band and below the conduction band in the host. These traps store the absorbed energy, that is responsible for improving the emission intensities and persL. Bao-gai Zhai et al.10 studied the P63 phase of a BaAl2O4:Dy3+ phosphor and this phosphor displayed a broadband blue-green emission with the maximum at about 490 nm. D. Jia et al.1 investigated on site dependent luminescence from a P63 phase of Ce doped BaAl2O4. They observed emissions from two Ba2+ sites in BaAl2O4 at 450 and 402 nm due to the 5d–4f transition of Ce3+. Biserka Gržeta et al.3 reported photoluminescence (PL) studies of Eu-doped BaAl2O4. The prepared material exhibited a P63 phase and displayed red PL emission, that was characteristic of the Eu3+ ion in the non-symmetric site, under UV excitation. Hermi F. Brito et al.11 reported on combustion synthesized Eu2+ doped BaAl2O4 that showed structural distortions due to the size difference between the Eu2+ (coordination number (CN) 9, 1.30 Å) and Ba2+ (1.47 Å) ions. The result was that the Eu2+ ion, at the Ba1 site, shifted towards the nearest Ba2+ ion along the unit-cell's c axis in the channel formed by the interconnected AlO4 tetrahedra. The Ba2+ ion also shifted marginally towards the Eu2+ ion along this channel. As a result, the Eu–Ba1 distance decreased by 0.154 Å. It can be expected that empty spaces existed in the structure after the movement of Ba2+ and Eu2+ ions within this channel.11 M. A. Gomes et al.12 investigated the PL behaviour of Eu doped BaAl2O4 and they suggested that in materials that were synthesized and annealed at 1200 °C, the Eu3+ inhabited a more symmetric site than in samples annealed at 600 °C. The optical properties of rare earth oxide doped BaAl2O4 materials; however, is strongly influenced by the synthesis conditions and the post-annealing temperatures.
Therefore, in this work, the BaAl2O4:Eu (1 mol%) phosphor was prepared with a solution combustion method and annealed at different temperatures that ranged from 900 and 1300 °C, for 2 h in air. The influence of the different annealing temperatures on the materials’ crystal structure, purity, particle size, morphology, elemental distributions, bandgap evaluation, surface chemical oxidation states and identification of defects were studied with XRPD, field emission scanning electron microscopy (FE-SEM), energy dispersive X-ray spectroscopy (EDS), UV-vis diffuse reflectance, X-ray photoelectron spectroscopy (XPS) and electron paramagnetic resonance (EPR) spectroscopy. The oxidation states of the Eu ion and the luminescent properties were studied by PL spectroscopy. The PL intensities were correlated with substitutional cation site symmetries. The persistent luminescence of BaAl2O4:Eu2+/Eu3+ was systematically investigated via its PL emission, excitation and decay curves and thermoluminescence. Additionally, the optimized phosphor was potentially employed as the fingerprint detection.
2. Experimental methods
2.1. Synthesis
BaAl2O4:xEu (x = 0.01 mol%) was prepared using the solution combustion synthesis. The detailed synthesis was discussed in the authors’ previous work.13 The synthesized powders were grounded with an agate mortar, then annealed in an alumina crucible at various temperatures (900–1300 °C) for 2 h in air in steps of 5 °C min−1. Finally, the naturally cooled samples were grounded thoroughly to obtain a fine powder. For convenience, the phosphor annealed at 900, 1000, 1100, 1200 and 1300 °C were denoted as Eu0.1-BAO-900, Eu0.1-BAO-1000, Eu0.1-BAO-1100, Eu0.1-BAO-1200 and Eu0.1-BAO-1300, respectively, from this point onwards in the manuscript.2.2. Characterizations
Phase purities and crystal structures of the materials were analysed using the XRPD patterns. The XRPD patterns were recorded at RT, using a Bruker D-8 advance (Germany) powder X-ray diffractometer, with Cu Kα1 radiation (1.5406 Å) at 40 kV and 40 mA, in the 2θ range of 15 to 70° with a 0.0066° step size and a scan speed of 0.4° min−1. The morphology and the microstructure of the Eu0.1-BAO samples were characterized using a FE-SEM (JEOL JSM-7800F, Japan). The elements and elemental mappings of the materials were obtained using EDS connected to the FE-SEM. The surface chemicals were studied by XPS using a PHI 5000 Scanning ESCA Microprobe equipped with a monochromatic Al Kα X-ray source (1486.6 eV) at RT. The details of the XPS instrument and the measurement conditions were discussed in the authors’ previous work.14 The unresolved peaks were separated by using Multipack version V8.2C, 2007-9-04 program with Gaussian-Lorentz line profiles and Iterated-Shirley backgrounds.The diffuse reflectance (DR) spectra were obtained using a UV–vis spectrometer (PerkinElmer, Lambda 950, USA) equipped over the range of 200–800 nm using with a BaSO4 powder as a standard reference with a 150 mm diameter integrating sphere. The photoluminescence excitation (PLE) and PL (200–900 nm) spectra were measured at RT using a Varian Cary Eclipse fluorescence spectrophotometer (Agilent Technologies, USA) with a 150 W Xe lamp as the excitation source. The PLE, PL, PL decay curve and persistent luminescence of the materials were analysed using a FS5 Spectrofluorometer (Edinburgh, UK) at RT. PL decay for the Eu2+ of the materials were measured using a FLS980 system with an excitation at 340 nm. The colour chromaticity coordinates of the Eu0.1-BAO phosphors were preformed using an Osram-Sylvania colour calculator (GOCIE-V2, CIE-1931) programme.
The X-band ESR measurements were carried out using a JEOL spectrometer JES FA 200 equipped with an Oxford ESR900 gas-flow cryostat with temperature control (Scientific instruments 9700). The microwave power was constantly maintained at 30 mW while the frequency was set at 9.4 GHz. 22 mg powder of each phosphor were separately irradiated by UV radiations with an 8 W, 254 and 360 nm UV lamp at RT. After irradiation the phosphors were placed in the dark for 10 min and maintained at RT. TL glow curves of the UV irradiated phosphors were then observed at a heating rate of 5 °C s−1 using a TL Reader (model: TL/OSL1008; Nucleonix Systems, India) in the temperature range of 30–450 °C. Glow curve deconvolution (GCD) with the general order kinetic function was applied to deconvolute the broad TL bands.
3. Results and discussion
3.1. Crystal structure and phase identification
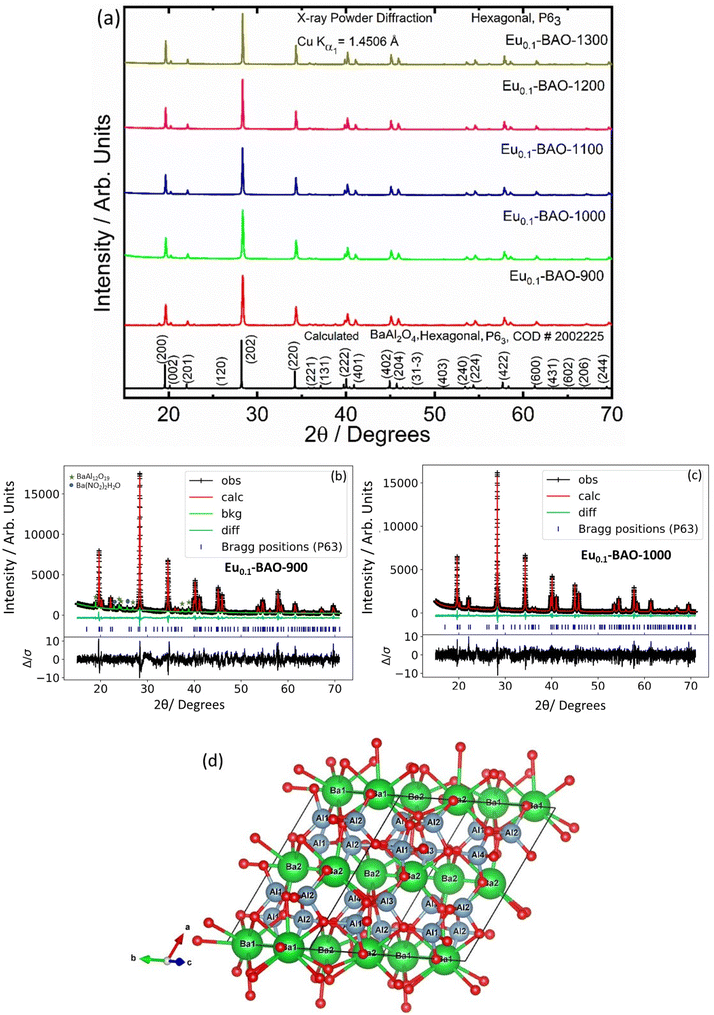
The phase purity of the annealed samples was first investigated by XRPD. Fig. 1a shows the XRPD patterns of the BaAl2O4:Eu (1 mol%) phosphors annealed at different temperatures between 900 and 1300 °C for 2 h in air. The calculated pattern that corresponded to the hexagonal crystal structure of BaAl2O4 with a space group of P63 is also shown in Fig. 1a. All the diffraction peaks of the prepared samples annealed at temperatures between 1000 and 1300 °C can be indexed to the hexagonal crystal structure of BaAl2O4 with a space group of P63 (COD #2002225). This indicated that the annealed aluminate materials exhibit a single crystal structure of BaAl2O4. No diffraction peaks from impurities were detected in the material annealed at 1000 °C and above, which indicated pure crystallinity. The intense diffraction peak at ∼28.3° did not shift. The peak's width; however, narrowed with increased annealing temperature. Apart from the hexagonal structure that was also observed in the Eu0.1-BAO-900 sample, a few additional diffraction peaks were observed at 18.9, 22.9, 23.9, 24.3, 25.7, 26.9, 37.5 and 38.8°, see Fig. 1b. These peaks corresponded to the coexistence of the non-stoichiometry phase of BaAl12O19 (peaks marked as ★)15 and to the unreacted Ba(NO2)2H2O (peaks marked as ●)16 in the product. The BaAl12O19 phase occurred due to the material's temperature that reach above 1600 °C within a short period during synthesis.Rietveld refinement was additionally done on the Eu0.1-BAO-x (x = 900–1300) (Fig. 1c and see Fig. S1 in the ESI†) samples by using the General Structure Analysis System-II (GSAS II) program. (This product includes software developed by the UChicago Argonne, LLC, as operator of Argonne National Laboratory (2013)). The unit cell parameters, unit cell volume, crystal density, phase fraction and fitting parameters obtained in the Rietveld structural refinements are enlisted in Table S1.† A low value of goodness of fit and for the weighted profile R-factor (Rwp) were obtained. This suggested that the refinement of the phosphors were effective and that the obtained phosphors were of good quality. A. M. Abakumo et al.17 reported on the PE–FE phase transitions in BaAl2O4 that was examined in situ by transmission electron microscopy. Electron diffraction revealed that the PE and FE phases have hexagonal crystal systems.17,18 The lattice constant (a) and unit cell volume obtained in the Rietveld structural refinements for the present phosphors were well consistent with those values reported by A. M. Abakumo et al.17 The Eu0.1–BAO structure did not show the Eu2O3 reflection and this was also confirmed by the Rietveld structural refinements. The ionic radius and valence of Ba, Al and Eu were: Ba2+ (1.47 Å), Al3+ (0.39 Å) and Eu2+ (1.30 Å)/Eu3+ (1.12 Å).19 The crystal structure of BaAl2O4 with the P63 space group consists of two different barium sites, Ba1 and Ba2.5 Ba1 and Ba2 are situated on 6c and 2a Wyckoff positions and each Ba2+ ion is coordinated by nine oxygen ions with an average Ba–O distance of 2.97 Å for Ba1 and 2.89 Å for Ba2, respectively.5 In principle, Eu2+ and Eu3+ ions can be substituted into both Ba2+ sites,4 herein, we propose that Eu2+ and Eu3+ ions were randomly substituted to occupy both Ba2+ sites. When Eu2+ (in the nine-fold coordination) would occupy both Ba2+ sites in BaAl2O4, it would form a distorted octahedral geometry in the matrix lattice (eqn (1)), due to the ionic size difference between the Ba2+ and Eu2+. While Eu3+ (in the nine-fold coordination) ions would occupy both Ba2+ sites in BaAl2O4. Hence, during substitution of Eu3+ in the Ba2+ sites, one interstitial oxide (Oi) gets created for every two Eu3+ ions due to charge compensation (eqn (2)) and in addition forming a structural distortion. The complete process can be stated as follow:
| Eu2+ + Ba2+ → [Eu3+]′Ba | (1) |
 | (2) |
The unit cell structure of BaAl2O4 was illustrated by the Visualization for Electronic and Structural Analysis version 3 program as shown in Fig. 1d. Hexagonal BaAl2O4 belongs to a family of stuffed tridymite tetrahedral structures. Accordingly, in this structure, the Ba2+ and Al3+ ions are in hexagonal BaAl2O4 (S.G.: P63) layers (see Fig. 1d) and Ba2+ is coordinated with 9 oxygen atoms. There are clearly visible empty channels between two Ba2+ ions’ inter layers. In addition, the distance between Ba1–Ba2 ions is about 5.2 Å and therefore, Eu ions can occupy Ba positions and one interstitial oxide ion bond with two Eu3+ substitutions in the two Ba2+ (Ba1 and Ba2) sites. Interstitial oxide ions occupied empty channels between the Ba1 and Ba2 ions’ inter layers. The inter distance between Ba1 and Ba2 ions has sufficient space to be occupied with Eu3+–O2−–Eu3+ ions (bond distance of Eu3+–O2−–Eu3+ is about 4.1 Å).20 As a result, the average Ba1–O and Ba2–O bond lengths slightly decreased when nominal 1 mol% of Eu replaced Ba2+ positions in BaAl2O4 due to the ionic radii of Eu3+ ions that are relatively smaller than the 9-coordinated Ba2+. Refinement of the cation and anion occupancies showed that all sites were occupied; therefore, there was no indication of vacancy formation. The obtained bond distances compared well with the results reported in the literature.3,5,17
The unit-cell volume of the annealed materials increased with annealing temperatures due to an increase of the crystallite size. Furthermore, the lattice constant (a = b and c) and X-ray density slightly deviated from the calculated values (see Table S1†) due to the presence of interstitial oxides and lattice distortion in the hexagonal crystal system. The crystallite sizes were determined from the Scherrer equation. The most intense and well-resolved diffraction peaks were used to determine the average crystallite size of the phosphors. This was found to be at 45, 67, 83, 101 and 109 nm for the 900, 1000, 1100, 1200, and 1300 °C annealed phosphors, respectively. Furthermore, the average lattice strain was determined and the values decreased from 7.74 to 3.19, with an increase in annealing temperature. It can therefore be concluded that an increase in the annealing temperature of these phosphors improved the crystallite growth and crystallinity.
3.2. Microstructure and elemental analysis
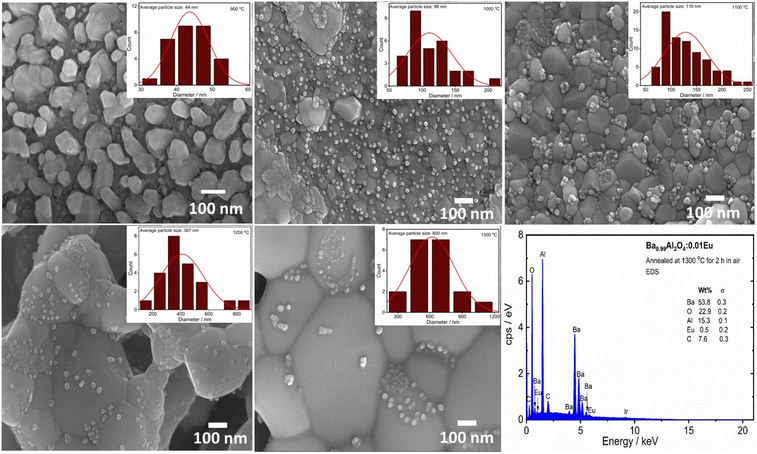
The microstructure for the different annealing temperatures of the Eu0.1–BAO phosphor was characterized by FE-SEM and is shown in Fig. 2. The grains and grain boundaries were clearly visible in the image. The grains have a hexagonal shape with an average particle size of 44, 98, 110, 367 and 600 nm after thermal annealing at 900, 1000, 1100, 1200 and 1300 °C for 2 h, respectively. This was obtained by the statistical analysis of the FE-SEM images as shown in the inset Fig. 2. The particle size increased with annealing temperatures due to the sintering and strong sintering occurred above 1100 °C. Small particles accumulated on the surface of the large particles in the phosphors annealed at higher temperatures (≥1000 °C); whereas, the Eu0.1-BAO-900 sample did not show small particles on the surface of the larger particles. The tiny particles have a hexagonal morphology with an average particle size of 24, 25, 27 and 33 nm following thermal annealing at temperatures of 1000, 1100, 1200, and 1300 °C for 2 h, respectively. The particle size increased with annealing temperature. These analyses were determined through the statistical analysis of the FE-SEM images, as provided in Fig. S2 of the ESI.† The chemical constituents of the Eu0.1-BAO samples annealed at selected temperatures were evaluated by EDS analysis. In Fig. 2 and S3,† EDS data of Ba, Al, O, Eu, and C of the Eu0.1-BAO-x (x = 900–1300) phosphor can be observed. The presence of carbon in all the samples was attributed to the carbon tape used during the analysis21 and to adventitious carbon from the air. The presence of adventitious carbon was confirmed by the O 1s spectra in the XPS analysis presented in the next section. EDS elemental mapping analysis were done and is shown in Fig. S4.† Ba, Al, O and Eu elemental components were evenly distributed throughout the sample.3.3. Surface chemicals and oxidation state analysis
To reveal the modifications in the surface's chemicals, XPS was performed on the annealed samples. Fig. 3a–f show the high resolution XPS spectra of Ba 3d, O 1s and Eu 3d. A slight variation in the peaks’ binding energies and full width at half maximum (FWHM) values were observed as a function of annealing temperatures. This was due to surface chemical modifications in the samples and was confirmed by XRPD Rietveld refinement results. Fig. 3d shows a typical Eu0.1-BAO-1300, Ba 3d spectrum, fitted with three peaks with binding energies at 779.7, 780.8 and 781.9 eV. The 779.7 and 780.8 eV peaks corresponded to Ba 3d5/2 situated at the Ba2 and Ba1 sites in the hexagonal BaAl2O4 crystal structure, respectively.5 The high binding energy peak, denoted as Ba(II), was attributed to Ba atoms in the form of BaCO3 or Ba(OH)2,22,23 respectively. The presence of carbonate or hydroxyl groups were possibly due to annealing in air atmosphere. The Ba 3d peaks consisted of two separate peaks of Ba 3d5/2 and Ba 3d3/2, due to spin–orbit-splitting (SOS) of the peaks. The binding energy difference was 15.3 eV (see Fig. 4d).24,25 The Ba2+ area ratio between the Ba2 and Ba1 sites was 1![[thin space (1/6-em)]](https://www.rsc.org/images/entities/char_2009.gif) :
:![[thin space (1/6-em)]](https://www.rsc.org/images/entities/char_2009.gif) 1 and the separation was 1.1 eV in the P63 phase. These data were comparable with data obtained in literature.22,25
1 and the separation was 1.1 eV in the P63 phase. These data were comparable with data obtained in literature.22,25
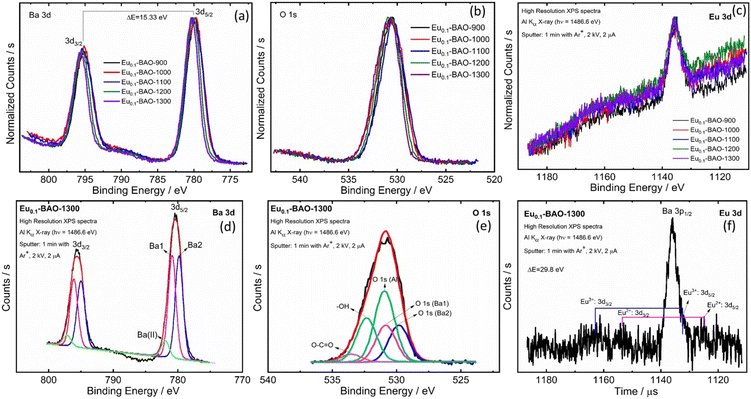 | ||
| Fig. 3 High resolution XPS spectra of Eu0.1-BAO phosphors: (a) Ba 3d, (b) O1s and (c) Eu 3d and the peak fits for (d) Ba 3d, (e) O 1s and (f) Eu 3d for the Eu0.1-BAO-1300 sample. | ||
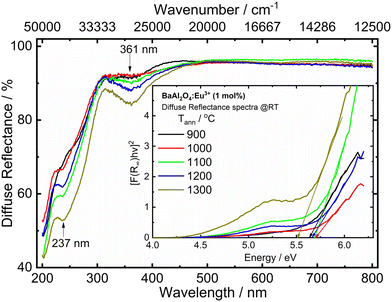 | ||
| Fig. 4 UV-vis diffuse reflectance spectra of the Eu0.1-BAO samples annealed at various temperatures. The inset shows the energy of the optical bandgap. | ||
A typical Eu0.1-BAO-1300, O 1s spectrum was fitted with seven peaks (see Fig. 3e). The first five peaks were situated at binding energies of 529.8, 530.8 and 530.9 eV and corresponded to lattice oxygen at Ba2, Ba1 and Al sites in BaAl2O4.13 The high binding energy peaks located at 532.4 and 533.5 eV were linked to the surface contaminants of O–H and O–C![[double bond, length as m-dash]](https://www.rsc.org/images/entities/char_e001.gif) O.13,22,23 The peaks area ratios of lattice oxygen were consistent with the Ba 3d peaks. The formation of the two distinct Ba sites in the barium aluminate were confirmed with XPS results and this was also consistent with the XRPD Rietveld refinement. Fig. 3f shows the Eu0.1-BAO-1300, Eu 3d spectrum with two small peaks at about 1124.8 and 1132.2 eV that corresponded to Eu 3d5/2 in Eu2+ and in Eu3+.26 Eu 3d also split into two peaks due to SOS and their higher binding energy, Eu 3d3/2 peaks, were obtained at 1154.6 and 1162.0 eV. The SOS binding energy variance was 29.8 eV.26 Eu3+ and Eu2+ ions, would occupy both Ba1 and Ba2 sites. However, the Eu3+ and Eu2+ ions’ peaks were not clearly noticeable in the Eu 3d peak because of the low doping concentration of Eu ions (1 mol%). Furthermore, the substitution of Eu3+ in the Ba2+ sites, create one Oi for every two Eu3+ ions due to charge compensation. This peak was also not distinctly noticeable due to the even lower concentration.
O.13,22,23 The peaks area ratios of lattice oxygen were consistent with the Ba 3d peaks. The formation of the two distinct Ba sites in the barium aluminate were confirmed with XPS results and this was also consistent with the XRPD Rietveld refinement. Fig. 3f shows the Eu0.1-BAO-1300, Eu 3d spectrum with two small peaks at about 1124.8 and 1132.2 eV that corresponded to Eu 3d5/2 in Eu2+ and in Eu3+.26 Eu 3d also split into two peaks due to SOS and their higher binding energy, Eu 3d3/2 peaks, were obtained at 1154.6 and 1162.0 eV. The SOS binding energy variance was 29.8 eV.26 Eu3+ and Eu2+ ions, would occupy both Ba1 and Ba2 sites. However, the Eu3+ and Eu2+ ions’ peaks were not clearly noticeable in the Eu 3d peak because of the low doping concentration of Eu ions (1 mol%). Furthermore, the substitution of Eu3+ in the Ba2+ sites, create one Oi for every two Eu3+ ions due to charge compensation. This peak was also not distinctly noticeable due to the even lower concentration.
3.4. Optical studies
The UV-vis DR spectra of BaAl2O4 in the presence of Eu ions of the samples annealed at 900–1300 °C are shown in Fig. 4. The optical response characteristics with absorption bands centred at ∼237 nm was due to the host's absorption band. The additional band centred at 361 nm was due to the overlapping of a charge transfer band (CTB) of a Cr6+–O2− transition from impurity levels27,28 and the excitation band of the 4f7 → 4f65d1 transition of Eu2+.29 The Cr ion impurity is commonly present in aluminium compounds; hence, Cr3+ can be present in the Eu0.1-BAO phosphor from the Al(NO3)3·9H2O raw material that was used during the sample preparation.28 In addition, the CTB of Eu3+–O2− overlapped with the wide band centred at 237 nm.29 These bands are well consistent with the PLE bands in the PL section.The optical bandgap (Eg) of the samples was estimated using the Kubelka–Munk (K–M) model.13 According to the K–M model, [F(R∞)hϑ]2versus hϑ is plotted for the direct bandgap. The linear region was extrapolated to zero in the energy coordinate on the x-axis. The optical bandgap of the phosphors were determined from the intersection point on the energy coordinate as displayed in the inset in Fig. 4. The obtained bandgap values, of the post-annealed and annealed at various temperatures samples, showed a mean value of 5.6 eV. This indicated no influence of annealing temperature on the optical band gap of the Eu0.1-BAO samples.
3.5. PL properties
The crystal structure's parameters of the materials obtained at different annealing temperatures, with the local structure of the dopant ions, have a fundamental impact on the luminescent properties. The PLE and emission spectra of the synthesized BaAl2O4:Eu material annealed at various temperatures were measured at RT and are shown in Fig. 5a and b. The PLE spectra was acquired at λem = 611 nm. The excitation spectra showed that all the phosphors exhibited relatively wide absorption in the UV region from 220 to 300 nm, with a peak centered at 251 nm (see Fig. 5a). This peak originated from the Eu3+–O2− CTB.30 Additionally, weak excitation peaks, centered at 317, 361, 378, 393, 464 and 532 nm corresponded to the 8S7/2 → 6P3/2–7/2, 7F0 → 5D4, 7F0 → 5G2–6, 7F0 → 5L6, 7F0 → 5D2 and 7F0 → 5D1 transitions of Eu3+, respectively.30,31 The PL spectra acquired upon 251 nm excitation, presented in Fig. 5b, showed the characteristic broad band of the 4f65d1 → 4f7 transition of Eu2+ with a maximum centered at 500 nm.31,32 An intense sharper band centered at 611 nm, corresponded to an electric dipole (ED) transition of Eu3+ (5D0 → 7F2).30 This band is a hypersensitive transition and is strongly influenced by the surrounding environment.3,28,29 Less intense narrow lines were also present due to induced f–f transitions of Eu3+: 5D0 → 7F0 (576 nm), 5D0 → 7F1 (582–600 nm), 5D0 → 7F3 (654 nm) and 5D0 → 7F4 (702 nm) (Fig. 5b). If Eu3+ ions occupy the lower symmetry sites, the emission from the 5D0 → 7F2 transition becomes strong; otherwise, the emission will be weak, while the magnetic dipole (MD) 5D0 → 7F1 transition is not affected by the site symmetry.3,31,32 The dominant emission at 611 nm showed that the Eu3+ ions occupied the lower symmetry sites of barium in the matrix. The relative intensity of the induced ED 5D0 → 7F2 (611 nm) transition to that of the MD 5D0 → 7F1 (594 nm) transition (asymmetric ratio), decreased by increasing the annealing temperature of the material (see Fig. 5b). This indicated that the Eu3+ ions occupied more of the high symmetry sites with an increase in the annealing temperature. The higher value of asymmetric ratio implied that the lower symmetry site favours efficient red emission. Both Eu3+ and Eu2+ moved into distorted sites favouring non-radiative losses due to sintering at higher annealing temperatures. As a result, there was a decrease in the PL intensities of Eu2+ and Eu3+.30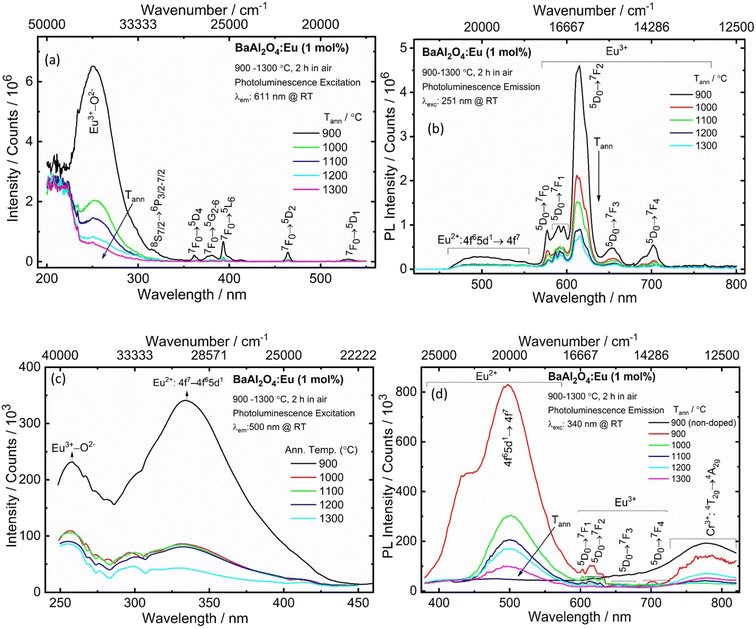 | ||
| Fig. 5 The PLE (a and c) and PL (b and d) spectra of Eu0.1-BAO phosphors annealed at selected temperatures. | ||
Fig. 5c shows the PLE spectra of the BaAl2O4:Eu samples annealed at 900–1300 °C at room temperature, monitored at 500 nm emission. The spectra covered a very broad spectral region (from 250 to 450 nm) and consisted of two excitation bands centered at 257 and 340 nm. These bands were attributed to the CTB of Eu3+–O2− and the 4f7 → 4f65d1 transition of Eu2+.29 Upon excitation at 340 nm, Fig. 5d, the BaAl2O4:Eu samples demonstrated a wide and strong emission in the wavelength range of 455–600 nm that was associated with the 4f65d1 → 4f7 transition of Eu2+. Additionally, there were also weaker emissions between 550 and 760 nm, whose appearance indicated the intra-configurational 4f–4f transitions of Eu3+ in the BaAl2O4 matrix.30 Incorporation of Eu ions into the BaAl2O4 phosphor by solution combustion synthesis and the annealed temperatures between 900 and 1300 °C, for 2 h in air, showed the existence of Eu2+ and Eu3+ in the BaAl2O4 matrix. The synthesized samples were partially oxidized because O2 were absorbed during annealing at higher temperatures, in air.
The reduction of Eu3+ to its divalent charge state has been described in some papers that used a special and a non-reducing atmosphere during sample production.11,12,29,33 M. Peng and G. Hong29 reported PL at RT of a BaAl2O4:Eu powder that was prepared by solid-state reaction and then heated at 1400 °C in air. The material that was heat treated in air, showed line emission of Eu3+ at excitation of 254 nm. Whereas, the synthesis of a BaAl2O4:Eu2+ material that was synthesized in a thermal carbon reducing atmosphere exhibited Eu2+ emission under the excitation of 340 nm. B. Gržeta et al.3 studied the PL of 4.9 atom% Eu doped BaAl2O4 powders, prepared by using a hydrothermal synthesis. This sample was thermally treated at 1100 °C in a furnace with static air. The Eu-doped sample under UV excitation displayed the characteristic red PL of the Eu3+ ion in the non-symmetric site. The PL studies of the BaAl2O4:Eu displayed exciton emissions and the characteristic Eu3+ transitions.3 M. Peng et al.34 reported the reduction of Eu3+ to Eu2+ in air in BaMgSiO4:Eu, produced by a high-temperature solid-state reaction. Z. Pei and Q. Su35 lodged four conditions for the abnormal reduction of Eu3+ to Eu2+ in a solid state compound when the doped phosphors were prepared in air at a high temperature without a reducing atmosphere: (1) there were no oxidized ions present in the hosts, (2) the doped Eu3+ ions replaced the divalent cations in the hosts, (3) the substituted cations have similar radii to Eu2+ ions and (4) the host matrix has suitable crystal structures, based on tetrahedral anion groups (such as BO4, PO4, SO4 and AlO4). BaAl2O4 satisfied all these conditions; therefore, it is feasible that Eu2+ and Eu3+ may co-exist under specific preparation circumstances. In this work the maximum PL intensity was obtained for the sample annealed at low temperature (900 °C). This was then probably due to both the Eu3+ and Eu2+ ions that occupied the less distorted Ba2+ sites in BaAl2O4 and this resulted in the radiative transition to be stronger. As the samples’ annealing temperature was increased, the PL intensities of Eu3+ and Eu2+ emission decreased. This could be because maybe both Eu3+ and Eu2+ moved in a more distorted environment in BaAl2O4 and as a result non-radiative transition dominated. In addition, a broad band was observed between 700 to 820 nm and was assigned to the 4T2g → 4A2g transition of Cr3+ (see Fig. 5d).
The emission spectra observed at λexc = 251, 340, 380 and 464 nm (Fig. S5a†), for the 900 °C annealed sample, exhibited sharp peaks for 4f–4f transitions of Eu3+ between ∼560 to 750 nm and a broadband emission centred at 500 nm due to the 5d → 4f transition of Eu2+. The emission intensity of the 5D0 → 7F2 transition of Eu3+ was stronger under excitation of 251 and 464 nm, than under 340 and 380 nm excitation. The 5d → 4f transition of Eu2+ became stronger due to the different excited states. The samples annealed at different temperatures showed similar emission profiles except for the intensities. M. A. Gomes et al.12 observed exciton, Eu3+ and Eu2+ transitions from a X-ray-irradiated Eu doped BaAl2O4 material. The exciton emissions and Eu2+ transitions overlapped at the wavelengths between about 400 to 575 nm.12 In this work the samples did not show the exciton emissions; however, the wide band emission in the blue region was associated with the 5d → 4f transition of Eu2+.
The chromatic coordinates ‘x’ and ‘y’ were calculated using the colour calculator program (1931 CIE chromaticity diagram).36 The typical colour coordinates of the BaAl2O4:Eu (900 °C) phosphor are shown in the inset of Fig. S5a.† The values of the x and y coordinates of the materials were denoted by the circle (λem: 611 nm; λexc: 251 nm), square (λem: 611 nm; λexc: 464 nm), star (λem: 500 nm; λexc: 340 nm) and triangle (λem: 500 nm; λexc: 380 nm) marks in the CIE diagram in Fig. S5a.† It can be noted that when the sample was excited at 251 and 464 nm the emission showed a red-orange light. When the sample was excited at 340 and 380 nm the emission was yellowish-green. Fig. S5b† shows the PLE (λem: 701 nm) and PL (λexc: 580 nm) spectra of the Eu0.1-BAO-900 sample. The PLE spectrum showed strong intense sharp lines in the wavelength of 350–550 nm, that were attributed to the intra-configurational 4f–4f transitions of Eu3+. It also showed additional weak bands with maxima at 415 and 580 nm (λem: 701 nm). These weak bands originated from the spin-allowed transitions of 4A2g → 4T1g (F) and 4A2g → 4T2g (F) of Cr3+, respectively.37 When the sample was excited at 580 nm, a sharp emission at 701 nm appeared and this was assigned to the 2Eg → 4A2g (R-line) transition of Cr3+.38 The existence of the Cr3+ impurity in the BAO material was discussed in the UV-vis diffuse reflectance spectra section.
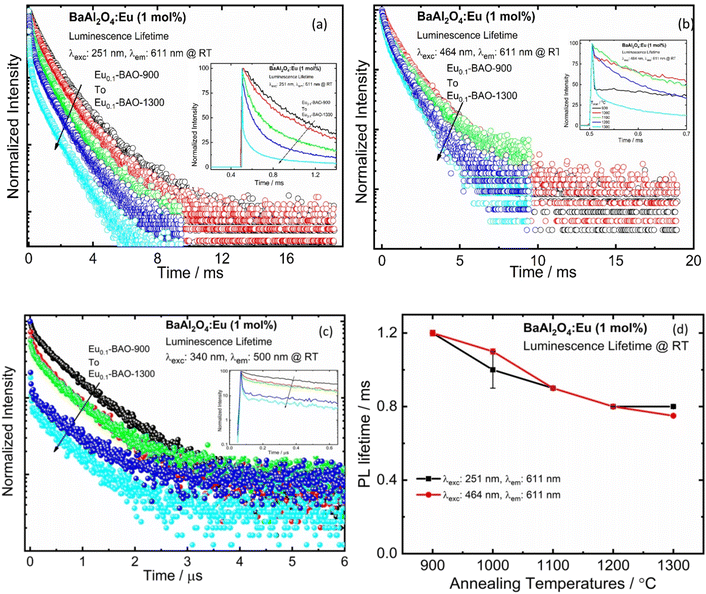
Fig. 6a–c presents the lifetime of the 5D0 → 7F2 transition (recorded at λexc = 251 and 464 nm) and the 5d → 4f transition (recorded at λexc = 340 nm) of BaAl2O4:Eu3+. The lifetime of the 5D0 → 7F2 (611 nm) decay curve can be fitted by a double exponential function as follows:39
 | (3) |
3.6. EPR analysis
Electron paramagnetic resonance (EPR) is a non-destructive analytical technique for an efficient way to probe the point defects and local structure of Eu2+ ions. EPR spectra of europium doped BaAl2O4, are shown in Fig. S8.† The EPR of Eu2+ ions with 4f7 configuration have 8S7/2 and L = 0 as its electronic ground state and is therefore insensitive to crystal field effects. The 4f65d1 configuration of Eu2+ is far more liable to the crystal field and coulombic interactions, due to the d-orbital degeneracy, which is boosted by interactions with the local ligand environment.41 The Eu2+ ion has long spin–lattice relaxation times so the EPR spectrum could be clearly identified. The Eu2+ ions in the lower symmetries are known to result in 8 lines that is a result from the splitting of the J = 7/2 state into 2J + 1 levels. Additional spectral lines of g ≫ 2.0 and g < 2.0 were also observed. The separations between these lines depend on the symmetry around the Eu ion in the host. The crystal field strength and Zeeman interaction are affected on the EPR spectrum of Eu2+ ions.41,42 When the frequency of microwaves is less than the crystal filed splitting, EPR signals will be seen only between Kramers-conjugate states. This results in prominent features at certain well-defined g values and then the resonance signals will appear at g > 2.0. When the frequency of the microwaves is larger than the crystal field splitting, EPR signals will appear close to g ≈ 2.0.41–43 In the present work, highly intense resonance appeared around 300 mT. This corresponded to g = 2.21. A relatively less intense resonance signal was also observed around 155 mT that corresponded to g = 4.30. This implied that there were crystal field splitting of similar magnitude larger than the applied microwave frequency. Additional EPR signals of g < 2.0 and g ≫ 2.0 were also observed. Nakamura et al.42 reported that Eu2+ occupied two different sites in BaAl2O4:Eu2+ by using EPR measurements. Vijay Singh et al.43 also reported that Eu2+ ions occupied two sites in the BaMgAl10O17:Eu2+ phosphor with EPR measurements. The observed resonance signals with the g factors of 19.89, 7.93, 5.64, 4.30, 3.01, 2.21 and 0.96 were attributed to Eu2+ that occupied two different sites of Ba2+ in the BaAl2O4 matrix with a moderate distortion. The PL emission in the blue-green region and high-resolution Eu 3d XPS had already indicated the presence of Eu as Eu2+ ions in these phosphors. Their presence were further confirmed by EPR studies. The population of spin levels for the resonance signal at g = 2.21 has been calculated for the selected annealing temperatures 900, 1000 and 1300 °C of BaAl2O4:Eu phosphor at room temperature. It was obtained to be 3.41 × 10¹¹, 10.42 × 10¹¹ and 4.76 × 10¹¹, respectively. The sample annealed at 1000 °C in air showed an increase in the number of spins at room temperature. This indicated that more Eu2+ ions formed upon heat treating the phosphor in air atmosphere. At the higher annealing temperature (1300 °C) in air, the population of spin levels at g = 2.21 was reduced. This indicated that lesser Eu2+ ions formed and that there were more Eu3+ ions.3.7. Persistent luminescence study
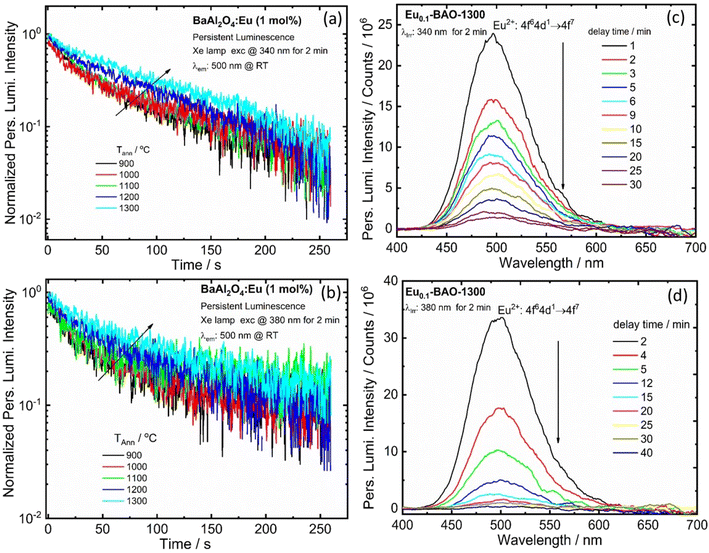
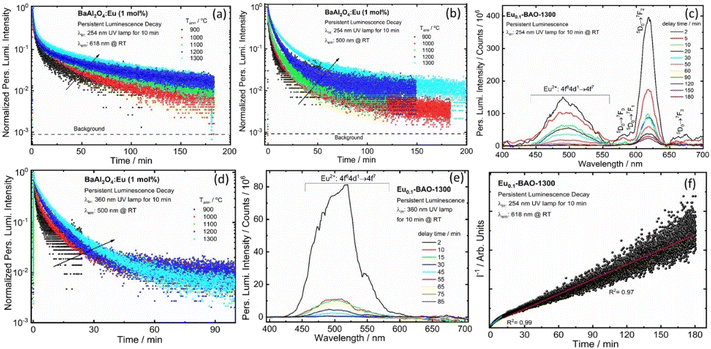
The BaAl2O4:Eu3+ phosphor also depicted persL after the excitation source was ceased. The effects of annealing temperature on the green persL's performance of the BaAl2O4:Eu3+ sample, after being excited by 340 and 380 nm for 2 min, were investigated. The persL's intensity increased gradually with an increase in annealing temperatures, see Fig. 7(a and b). The data point in Fig. 7(a) and (b) were recorded as a function of the persL intensity at 500 nm versus the decay time and the recordings lasted for 260 s. The initial green persL intensity decreased quite rapidly in the first 1 min, followed by a slow decay process until the end of the measurement. This clearly confirmed that the green persL originated from Eu2+ emitters. Fig. 7(c and d) display the persL spectra obtained under the same conditions at wavelengths of 340 nm and 380 nm, after the excitation ceased. The persL intensity band, centered at 500 nm, exhibited a reduction in intensity as the delay time increased. Emission was observed for the 340 nm and 380 nm excitation sources up to 30 min and 40 min, respectively, after the excitation was stopped. In addition, the persL decay curve of the Eu0.1-BaO-900 and Eu0.1-BaO-1300 phosphors, where the reciprocal of the persL intensity (I−1) as a function of time (t), was also explored, as shown in Fig. S9.† The I−1 − t curve was very close to a linear fit. In the initial stage (t < 40 s for Eu0.1-BAO-900 and t < 25 s for Eu0.1-BAO-1300), the electrons, that thermally escaped at RT from the shallow traps, could quickly moved to the Eu2+ levels for effective recombination through the CB. This resulted in an initially rapid decay. At a later stage, the deep traps could recombine directly with the nearby excited states of Eu2+via a quantum tunnelling process, as a substitute of going through the CB. Thus, the recombination rate would be slower, leading to a weaker PersL intensity and therefore, a notably longer PersL time. This will be discussed in depth according to the results shown in the TL glow curves.In addition, we conducted measurements on the persL decay curve of the BaAl2O4:Eu3+ (1 mol%) phosphor annealed at selected temperatures ranging from 900 to 1300 °C by monitoring emission at 618 and 500 nm after irradiation with a 254 nm UV lamp for 10 min, as shown in Fig. 8a and b. Fig. 8a and b depict data points recorded as a function of the persistent emission intensity at 618 and 500 nm (I) against the decay time (t) and the recordings lasted approximately 180 minutes. The emission intensity of BaAl2O4:Eu3+ (1 mol%) phosphor first exhibited a rapid decrease in red and blue-green persistent emissions within the first few minutes. Subsequently, the emission intensity gradually decreased until the measurement was completed. After 180 minutes of continuous emission, the intensity of the red and blue-green persL emission remained significantly higher over the background. A similar observation was noted when monitoring the 500 nm emissions after 10 minutes of irradiation with a 360 nm UV lamp, as shown in Fig. 8d.
Fig. 8c and e display the persL emission spectra for the optimum sample (Eu0.1-BAO-1300), captured at various delay times after the removal of the irradiation at wavelengths of 254 nm and 360 nm, respectively. The profile of the persL emission spectrum coincided with the photoluminescence emission spectrum (Fig. 5b and d), that indicated that the red and blue-green persL originated from the Eu3+ and Eu2+ emitters, respectively. The two linear fit results of the reciprocal of the persL intensity (I−1), presented as a function of time (t) (Fig. 8f) indicated that the persistent luminescence was mainly caused by two effective trap centers.44 The tunnelling or temperature-assisted tunnelling process participated in the persistent luminescence.45 We investigated the effects of irradiation duration on the persistent luminescence performance of the optimum annealed Eu0.1-BAO-1300 sample after being irradiated by a 254 nm and 360 nm UV radiation for various durations ranging from 2 to 30 minutes (Fig. S10a and S10b†). It appeared that the phosphor can be fully charged in 10 minutes of 254 nm UV irradiation and 20 minutes of 360 nm UV irradiation, respectively.
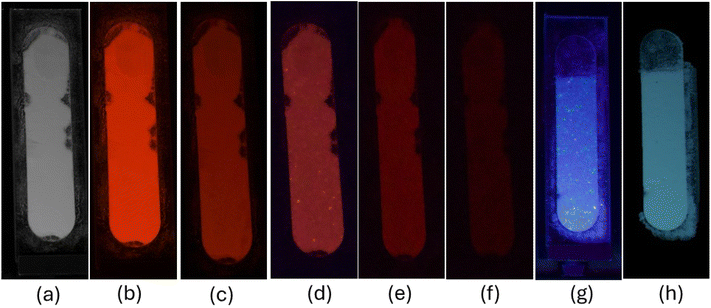
As shown in Fig. 9b, the nanophosphor powders can be effectively charged for 10 minutes using a 254 nm UV lamp. The emission brightness decayed slowly over time, with visible red emission that lasted up to 3 minutes in a dark environment (see Fig. 9c–e). After 3 minutes, the emission was not detected due to the sensitivity limit of our UV camera (note that the actual decay time is likely much longer, around 3 hours). Under 360 nm UV irradiation, the material exhibited a bluish-green emission; however, the UV background interfered with the emission from the material (Fig. 9g). After stopping the 360 nm irradiation, the material emitted a bluish-green color for up to 1 minute (Fig. 9h), after which the emission diminished.
3.8. TL glow curve analysis
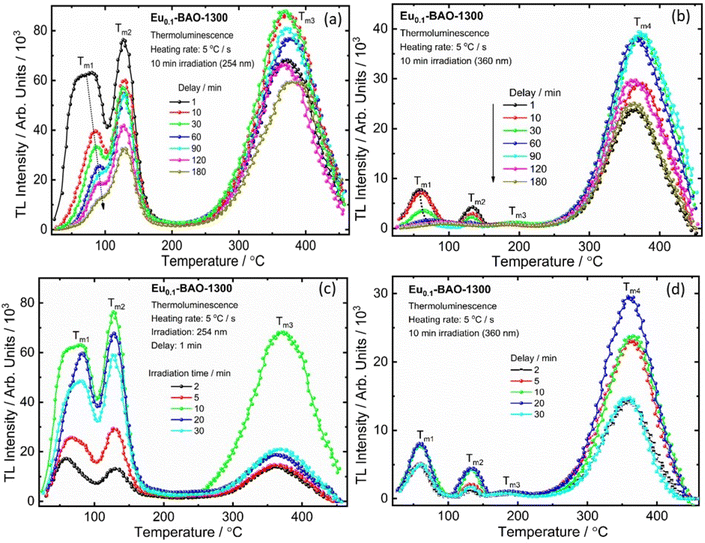
It is well known that the nature of the traps play a dynamic role in persL. The reason why the BAO host is suitable for Eu2+/Eu3+ ions to produce persL is, that appropriate defects exist in the BAO:Eu2+/Eu3+ phosphor. Usually, evidence on traps and trap depths can be obtained from the analysis of the TL band. Thus, the TL bands of all the samples were measured under the same conditions. Fig. 10 shows the TL glow curves of the Eu (1 mol%) doped BaAl2O4 phosphors. The TL glow curves were monitored in a wide temperature range from 30–450 °C, after the samples were irradiated with 254 and 360 nm UV radiation for 10 min at RT. Fig. 10a displays the TL glow curve for the annealed samples irradiated with 254 nm UV radiation and it consisted of a broad band with maximum intensities at 88, 131, 189 and 376 °C. While the samples irradiated with 360 nm UV radiation showed TL bands with maximum intensities at 62, 135 and 360 °C (Fig. 10c). These bands were attributed to, when one Eu3+ ion substituted a Ba2+ ion in the crystal lattice, two substitutional defects formed. The
  defect is positive and act as an electron trap. Due to the requirement of charge neutrality, two Eu3+ ions are needed to replace two Ba2+ ions. One interstitial oxygen ion (O′′i) was also generated and acted as a hole trap. One Eu2+ ion that substituted a Ba2+ ion in the crystal lattice, created a one substitutional defect, [Eu3+]′Ba. The phosphor annealed at 1300 °C showed a greater intensity of the TL bands due to better crystallinity and a reduction of –OH and C
![[double bond, length as m-dash]](https://www.rsc.org/images/entities/char_e001.gif) O impurities.46 The high temperature TL bands (>150 °C) signified deeper traps and were more stable. They faded relatively slower and this provided proficient energy storage phosphors. The broad TL bands were deconvoluted by using the glow curve deconvoluted (GCD) technique with general order kinetics. The equation made by Kitis et al.47 was as follows:
O impurities.46 The high temperature TL bands (>150 °C) signified deeper traps and were more stable. They faded relatively slower and this provided proficient energy storage phosphors. The broad TL bands were deconvoluted by using the glow curve deconvoluted (GCD) technique with general order kinetics. The equation made by Kitis et al.47 was as follows: | (4) |
 , Zm = 1 + (b − 1)Δm,
  , k is the Boltzmann constant (8.6 × 10⁻⁵ eV K−1), Im and Tm are the maximum TL band intensity (Arb. Units) and TL band temperature (K), E is the trap depth (eV) and b is the order of kinetics. The TL kinetics parameters were optimized to align the simulated glow curve with the experimental data, minimizing the figure of merit (FOM). The FOM reflects the quality of the glow curve fit and is defined by eqn (5).48
 | (5) |
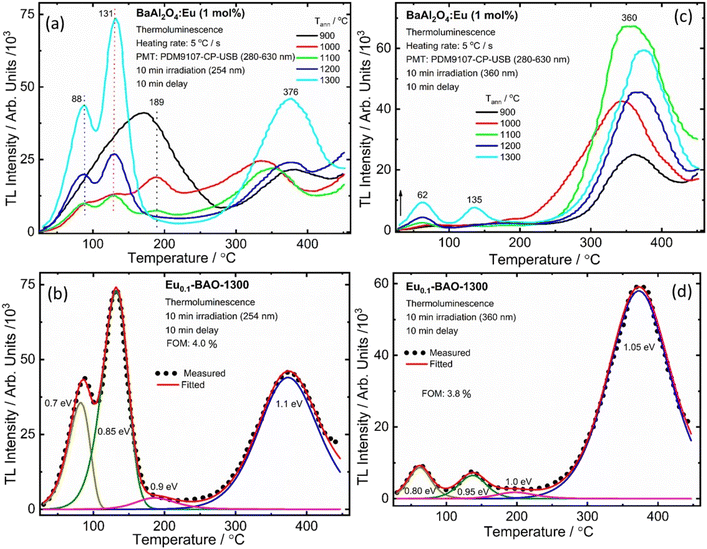 | ||
| Fig. 10 The TL glow curve and peak fits for the Eu doped BaAl2O4 phosphors irradiated for 10 min with UV (254 nm (a and b) and 360 nm (c and d)) radiation. | ||
Here, yi represents the experimental value, y(xi) denotes the fitting value of the TL intensity at temperature Ti. The FOM reaches its minimum value when the fitted function precisely corresponds to the experimental data. Thus, a lower FOM indicates a better fit quality.48 For each fit, the FOM was noted until the parameters yielding the minimum FOM were identified. In this study, the FOM values obtained were consistent with those documented in literature,49,50 as shown in Table 1.
| Irradiation | Bands | Temperature (Tm)/°C | Trap depth (E)/eV | Trap density/104/cm−3 | Order of kinetics (b) | FOM/% |
|---|---|---|---|---|---|---|
| 254 nm | 1 | 82 | 0.70 | 10 | 1.0 | 4.0 |
| 2 | 132 | 0.85 | 22 | 1.2 | ||
| 3 | 186 | 0.90 | 1 | 2.0 | ||
| 4 | 373 | 1.10 | 25 | 2.0 | ||
| 360 nm | 1 | 62 | 0.80 | 2 | 1.8 | 3.8 |
| 2 | 136 | 0.95 | 1.7 | 1.4 | ||
| 3 | 197 | 1.00 | 0.6 | 2.0 | ||
| 4 | 373 | 1.05 | 37 | 1.7 | ||
Fig. 10b illustrates the four deconvoluted TL bands centered at 82, 132, 186 and 373 °C after irradiation with 254 nm UV radiation for 10 min for the Eu0.1-BAO-1300 phosphor. The corresponding trap depths/activation energies were 0.7, 0.85, 0.9 and 1.1 eV, respectively. Similarly, the samples irradiated with 360 nm UV radiation for 10 min can be deconvoluted into four bands with peaks centered at 62, 136, 197 and 373 °C (Fig. 10d). These corresponded to trap depths that varied between 0.8 to 1.05 eV, respectively. These activation energies in the phosphors implied shallow and deeper trap states within the band gap of the phosphor. The value of E (eV) was high when electrons were released from deep trap sites. The corresponding traps were also stable and this resulted in a slow fading rate of the corresponding TL band which is characteristic of a slow decay with long persL. E was low when electrons were released from shallow trap sites and these corresponding traps were less stable. This resulted in a faster fading rate and this is characteristic of a rapid decay with short persL. In addition, the strong TL bands’ intensities observed for the sample annealed at 1300 °C, resulted in a better green persL.
The trap density (eqn (6)) for the TL bands were determined by using the given expression,13
 | (6) |
 . The temperatures T1 and T2 were the temperatures on the minimum and maximum sides that corresponded to half of the band's intensity and β is the linear heating rate (5 K s−1). It was confirmed that the shallow and deeper traps have higher trap densities under 254 nm irradiation, while the 360 nm irradiated samples showed that the deeper traps had a greater trap density and the obtained parameters were tabulated in Table 1. This indicated that more energy was stored at defects state in the sample after the phosphors were irradiated under 254 nm UV radiation.
It is well established that the properties of persistent luminescence are influenced by the traps that capture electrons or holes. The temperature of the TL bands indicates the depth of these traps, while the intensity reflects their concentration. To reveal the process of capturing and releasing electrons by traps in BaAl2O4:Eu, TL glow curve analysis of delay times and duration of irradiation after pre-irradiation, using a 254 nm and a 360 nm UV lamp, was performed. Fig. 11a and b shows the TL glow curves at different delay times after irradiation by 254 nm and 360 nm UV lamps for 10 min. With the increase of the delay time, the TL intensities (Im1 and Im2) of the Tm1 and Tm2 bands decreased, as shown in Fig. S11a and S11b† and the low-temperature TL band at the Tm1 position moved to a higher temperature (Fig. S11a and S11b†). Meanwhile, the position of the second TL band at Tm2 remained constant with an increase of delay time, as shown Fig. S11a and S11b.† The high temperature TL bands (Tm3 for 254 nm and Tm3 and Tm4 for 360 nm) maintained constant positions, however their intensities varied. This might be due to the non-uniform distribution of traps or to complex centers.51 At a delay time of 180 min for both 254 and 360 nm UV irradiation, the intensities of the low-temperature bands (Tm1 and Tm2) significantly decreased. Meanwhile, the intensity of the high-temperature bands (Tm3 for 254 nm and Tm4 for 360 nm) remained strong. This indicated that a substantial number of trapped electrons were still present in the deep states. The low-temperature TL band results aligned well with the persistent luminescence decay curve and emission spectra shown in Fig. 8c and e. The time evolution of the TL curves clearly demonstrated that emptying of shallow traps was more pronounced than that of deep traps, due to the release of trapped electrons through room temperature thermal stimulation. Electrons are difficult to release from deep traps at room temperature. The trap depths were also determined using the GCD technique, and the determined trap depths of the TL bands are presented in Fig. S11c and 11d.† The determined trap depth of the low-temperature TL band (Tm1) varied from 0.43 to 0.95 eV for 254 nm pre-irradiation and from 0.70 to 0.93 eV for 360 nm pre-irradiation, as the phosphor decayed from 2 min to 180 min. Additionally, the trap depths of Tm2, Tm3 and Tm4 remained constant. This suggested that the low-temperature TL bands were strongly responsible for the blue-green and red persistent luminescence than the high temperature TL bands at room temperature.
Fig. 11c and d show the TL glow curves of Eu0.1-BAO-1300 after irradiation with 254 nm and 360 nm UV lamps for different durations (2 to 30 minutes). The intensities of the TL band maximum (Tm1, Tm2, and Tm3) increased with irradiation time up to 10 minutes for 254 nm and up to 20 minutes for 360 nm, and thereafter, it decreased. The variation in the TL band intensities coincided with the variation in the persL intensities under the same conditions. The increased TL band intensities suggested that the number of captured electrons in the traps rised.52 Once the traps were fully filled, the TL peaks’ intensities stopped increasing. The decrease in the TL signal can be attributed to increased competition with nonradiative centers at higher irradiation time or doses, which lead to a reduction in the TL signal.53 It indicated that this phosphor can be fully charged in 10 minutes for 254 nm and in 20 minutes for 360 nm. However, due to the greater energy of 254 nm radiation compared to 360 nm, the phosphor showed a faster charging process when exposed to 254 nm UV radiation. The position of the maximum TL bands did not change with the duration of irradiation and this indicated that the estimated trap depth was essentially independent of the irradiation duration.54
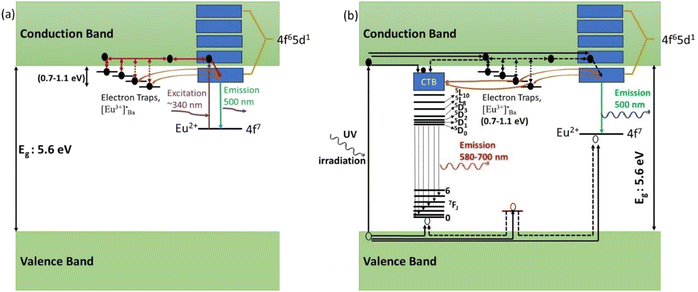
When the samples were excited by UV radiation, the electrons get excited from the 4f7 ground state of Eu2+ to the 4f65d1 excited state of Eu2+ (Fig. 12a). The Eu2+ excited states are located within the CB and just below the CB. The excited electrons can then move quite freely in the CB and is then captured by traps nearby the bottom of the CB. The probable origin of the electron traps is  and [Eu3+]′Ba or even defects. These traps and defects then act as luminescent centres for Eu2+ persL. The
  defect may trap an electron from the CB, thus creating the Eu2+ species or an Eu3+-e− pair.11 The shallow traps (electron traps) can re-trap electrons from defects states at RT after the excitation source was ceased. The electrons can then move to Eu2+ excitation states via the CB of the host and this can result in rapid decay with high intense persL at the beginning. Furthermore, electrons can tunnel from the deeper electron traps to reach the Eu2+ emission centres or they might move through the CB and this can result in the relatively slow decay with a weak Eu2+ persL.55,56 It can be concluded that the persL originated mainly from Eu2+ in the BaAl2O4:Eu2+/Eu3+ sample.
Furthermore, based on the results and discussion, a schematic model for the persistent luminescence of Eu3+ and Eu2+ ions in BaAl2O4:Eu3+/Eu2+ is proposed and illustrated in Fig. 12. When the nanophosphor was irradiated with a UV mercury lamp (254 nm), electrons in the valence band were excited to the conduction band, leaving holes behind in the valence band. Subsequently, some of these excited electrons undergo nonradiative transitions from the conduction band to the 5D3 state of Eu3+ and the 4f6 5d1 level of Eu2+ ions (Fig. 12b). These electrons then relaxed back to the ground states and recombined with holes, resulting in the characteristic emissions of Eu3+ and Eu2+. Meanwhile, a smaller fraction of excited electrons became trapped in shallow and deep electron traps through the conduction band. After the irradiation stopped, trapped electrons were released from these traps with the aid of thermal energy at room temperature. They then get transferred back to the excited states of Eu3+ and Eu2+ ions. Additionally, deep traps can facilitate tunnels to reach the Eu3+ and Eu2+ emission centers, leading to the direct recombination of electrons and holes and thus to the persistent luminescence of Eu3+ and Eu2+ ions.57,58 We presumed that no energy transferred from Eu2+ to Eu3+ ions because the nanophosphor, when excited at 340, 360, or 380 nm, exhibited no persistent luminescence (Fig. 7c, d and 8e). Additionally, there was no energy transfer from Eu3+ to Eu2+ ions since the excited states of Eu2+ are above the emission energy of Eu3+ ions, resulting in no persistent luminescence.
3.9. Fingerprint analysis
The experiment was conducted to investigate potential applications in the field of fingerprint detection. Fingerprint is the remarkable tangible evidence of a person's unique information. Latent fingerprints, which are not visible to the unaided human eye, are mostly encountered at crime scenes and demand accurate perception technique. However, the development and visualisation of latent fingerprints (LFPs) presents several challenges. The clarity of LFP visualization depends on multiple factors, including the quality of the deposited fingerprints and external conditions such as moisture, lighting, and air contamination. Additionally, the age of the fingerprint, specifically the time elapsed since its formation plays a crucial role. Latent fingerprints can lose clarity due to various environmental factors like humidity, temperature, and contamination. Prolonged exposure to UV light may also degrade the residual oils in the fingerprints.59,60The main advantage of using luminescent material over conventional powder in this application is the enhanced contrast between the ridges and the background. Conventional powders work by scattering incoming light, usually visible light, from their rough surfaces. However, this also results in the reflection of the same light from surrounding surfaces and the fingerprint's background, which becomes a significant issue on highly reflective surfaces.
Luminescent materials, on the other hand, can be designed to be excited by light outside the visible spectrum. This allows the camera system to ignore the reflected excitation light from the background while detecting the visible luminescence emitted by the material. Researchers are exploring ultraviolet (UV) or infrared (IR) radiation as excitation sources. For UV radiation, down-shifting luminescent materials can be used, while IR radiation would require upconverting materials. However, upconverting materials have disadvantages due to their nonlinear response to excitation intensity. Additionally, silicon-based CCD sensors in cameras are sensitive to IR radiation (<1100 nm), which can result in the detection of unwanted excitation light. While this can be mitigated with filters, it adds complexity and cost, making the use of luminescent materials less practical.
The ideal solution is to use a material with a broad excitation range in the UV region, which can be excited by readily available UV lamps or UV-LEDs. Since camera sensors have limited sensitivity in the UV range, the luminescent material should re-emit in the visible spectrum, where both human eyes and camera sensors have high sensitivity, particularly in the green to red region (500 to 650 nm). Tailoring the material to emit in this range is therefore advantageous. Also using inorganic phosphors offers better long-term stability and resistance against UV degradation when compared to its organic counterparts.61
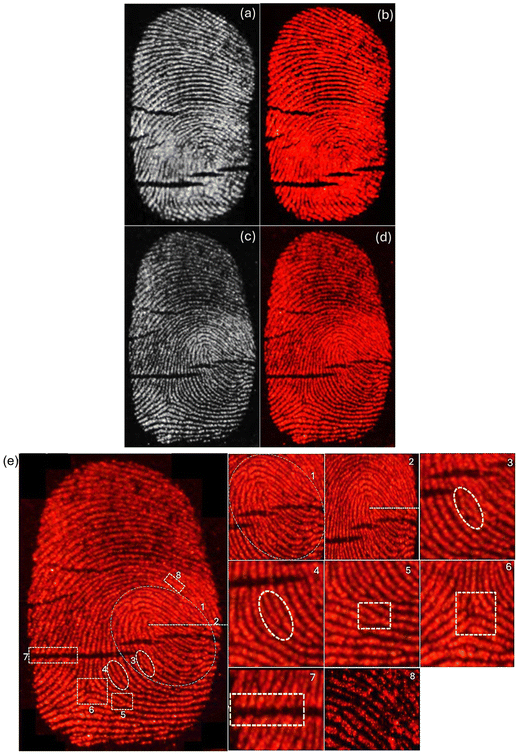
Implementation of the powder dusting method using BaAl2O4:Eu3+ (Eu0.1-BAO-900) phosphor on the different fingerprint smooth surface (glass slide, plastic Petri dish and silicon wafer), which were thoroughly cleaned beforehand. Fingers were firmly pressed onto the fingerprint carriers to assess the efficacy of the prepared phosphor. Subsequently, the phosphor powder was evenly distributed onto the fingerprint carriers, and excess powder was removed. Finally, digital camera images of the fingerprints were captured under ultraviolet radiation (254 nm). As illustrated in Fig. 13a–d, intense red luminescence was observed on both the glass slide and plastic Petri dish under fluorescent lamp and ultraviolet radiation, revealing well-defined edges, boundary streamlines, and ridge widths recognized by naked eyes under ultraviolet radiation. Detailed information on the latent fingerprints (LFPs) obtained from plastic Petri dish, including loop, core area, enclosed, ridge ending, bifurcation, delta, crease, and pores, can be easily recognized at high-magnification (Fig. 13e). Furthermore, as presented in Fig. 9b, brighter red emission could be observed in the other surface of glass slide. These results suggest that LFPs can be successfully imaged with the BaAl2O4:Eu3+ phosphor under 254 nm. Additionally, the periodic changes in the luminescence intensity (gray-scale values) between the ridges and furrows along the white line in latent fingerprints, under 254 nm UV lamp, showed more regular variations (Fig. S12a and S12b†). The gray scale values as a function of distance were plotted using the ImageJ program. Finger marks collected from the right and left thumbs of the same volunteer showed clearly a visible variation in the LFPs imaging photographs (Fig. S13a and 13b†). Additionally, LFP imaging of the same volunteer on various surfaces demonstrated a perfect match and confirmed reproducibility (see Fig. 13a, b and S13a†).
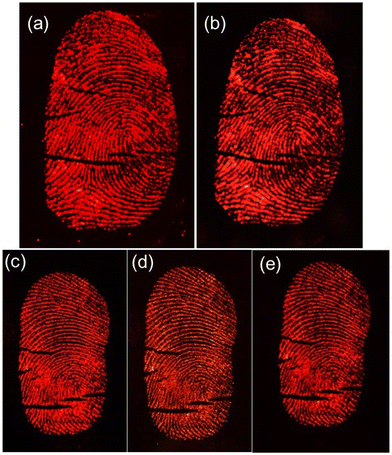
Considering the real situation, latent fingerprint detection and analysis often occur after a certain time has elapsed. Therefore, it is important to assess the effectiveness of powder-stained LFPs after a prolonged period. The fingerprints on a silicon wafer surface were aged for 1, 40 and 60 days by storing them in an open tray inside a cupboard, which minimized exposure to natural light at RT within an office. Subsequently, the Eu0.1-BAO-900 nanophosphor powder was gently applied to aged LFP using a paint brush (Fig. 14a–e). As depicted in Fig. 14a–e, the nanophosphor on the fingerprints displayed bifurcation, enclosed, crease, deltas, well-defined ridge patterns without background staining and remained clearly visible to the naked eye, with constant brightness, detection sensitivity, and contrast even after 60 days of aging under a 254 nm mercury-vapor UV lamp. Significantly, the LFPs retained clear fingerprint textures even after a period of 60 days of aging. These observations confirmed the storage stability of the developed LFPs using the current phosphors. Over time, water evaporated from the fingerprints, leaving behind only oily substances such as amino acids.62 The oxide materials reacted with the trace amounts of amino acids present in the latent fingerprints, demonstrating a strong affinity. Consequently, the LFP marks remained clearly visible even after 60 days of aging in an ambient atmosphere. In summary, Eu0.1-BAO-900-based nanophosphors proved chemically stable in ambient conditions and show potential for latent fingerprint detection.
4. Conclusions
A hexagonal crystal structure with a ferroelectric (S.G.: P63) phase of Eu doped BaAl2O4 phosphors was obtained by using solution combustion synthesis. Pure P63 hexagonal BaAl2O4 structures were obtained, irrespective of the different annealing temperatures (1000–1300 °C). The size of the crystallites and particles increased with annealing temperatures due to the strong sintering effect. The dual oxidation states of Eu3+ and Eu2+ were obtained during the combustion synthesis process without applying reducing atmospheres or co-dopants. This was confirmed by XPS, DR, PL, PL lifetime, and EPR analysis. The Eu3+ ions were also obtained during the annealing in the air atmosphere. The Eu3+/Eu2+ ions substituted the Ba2+ ions in both sites in BaAl2O4, Eu3+ and this could have resulted in interstitial oxygen sites. Structural deformations due to charge compensation and different ionic radii of Eun+ and Ba2+ were too small to be observed. The Eu3+/Eu2+ PL intensities were strongly dependent on annealing temperature. The highest PL was achieved with an annealing temperature at 900 °C because of partial disorganisation in the crystal structure. Both Eu3+ and Eu2+ moved into distorted sites, favoring non-radiative losses due to sintering at higher annealing temperatures. The BaAl2O4:Eu2+/Eu3+ phosphors displayed four traps, that were between 0.7 to 1.1 eV in the bandgap of the host, and this was confirmed by TL analysis. These traps originated from the Eu3+ ions that substituted Ba2+ ions in the crystal lattice. This formed two substitutional defects and a subsequent Oi charge compensation defect. In addition, one substitutional defect [Eu3+]′Ba was formed after the Eu2+ ions substituted for Ba2+ ions. The luminescence decay and TL revealed several traps though the energies were not really optimized for the RT function. Persistent luminescence originated mainly from Eu3+ and Eu2+. The maximum persistent red and blue-green luminescence was obtained with Eu0.1-BAO-1300 sample, and it lasted for more than 180 minutes after the 254 nm UV irradiation was stopped. Defect engineering would, therefore, improve the performance of these samples that act as phosphor materials. We demonstrated that the BaAl2O3:Eu2+/Eu3+ phosphor showed an excellent marking agent for imaging of fingerprints on different substrates. The observed LFPs clearly distinguished between ridges, furrows, bifurcations, enclosed areas, creases, and deltas, even after 60 days of aging, confirming the reproducibility of LFPs for potential applications in forensic science.
Author contributions
Shivaramu Nagarasanakote Jayaramu: conceptualization, formal analysis, investigation, methodology, writing – original draft. Divya Janardhana: writing – review & editing. Lucas Erasmus and David E Motaung: conceptualization. Elizabeth Coetsee: writing – review & editing, supervision, project administration, Hendrik C. Swart: writing – review & editing, resources, project administration, methodology, funding acquisition.Consent statement
Informed consent was obtained from all human subjects.Data availability
The data supporting this article have been included as part of the ESI.†Conflicts of interest
There are no conflicts to declare.Acknowledgements
The authors express their sincere thanks to the South African Research Chairs Initiative of the Department of Science and Technology and the National Research Foundation of South Africa (No. 84415). The financial assistance from the University of the Free State is highly recognized.The authors also thank Prof. Jorma Hölsä from the Department of Physics at the University of the Free State, South Africa, for his discussions on the results. Some rights are reserved for the graphical abstract and figures containing images of fingerprints. Permission must be sought by the consenting author/owner before being reproduced.
References
- D. Jia, X. J. Wang, E. Van Der Kolk and W. M. Yen, Opt. Commun., 2002, 204, 247–251 CrossRef CAS.
- B. Cheng, L. Fang, Z. Zhang, Y. Xiao and S. Lei, J. Phys. Chem. C, 2011, 115, 1708–1713 CrossRef CAS.
- B. Gržeta, D. Lützenkirchen-Hecht, M. Vrankić, S. Bosnar, A. Šarić, M. Takahashi, D. Petrov and M. Bišćan, Inorg. Chem., 2018, 57, 1744–1756 CrossRef PubMed.
- M. A. Gomes, A. B. Andrade, M. V. do. S. Rezende and M. E. G. Valerio, J. Phys. Chem. Solids, 2017, 102, 74–78 CrossRef CAS.
- W. Horkner and H. k. Von Müller-Buschbaum, Z. Anorg. Allg. Chem., 1979, 451, 40–44 CrossRef.
- S. Y. Huang, R. Von Der Mühll, J. Ravez, J. P. Chaminade, P. Hagenmuller and M. Couzi, J. Solid State Chem., 1994, 109, 97–105 Search PubMed.
- Q. Wu, Z. Liu and H. Jiao, Physica B: Condens. Matter, 2009, 404, 2499–2502 CrossRef CAS.
- J. M. Perez-Mato, R. L. Withers, A. K. Larsson, D. Orobengoa and Y. Liu, Phys. Rev. B: Condens. Matter Mater. Phys., 2009, 79, 1–12 CrossRef.
- L. C. V. Rodrigues, R. Stefani, H. F. Brito, M. C. F. C. Felinto, J. Hls, M. Lastusaari, T. Laamanen and M. Malkamki, J. Solid State Chem., 2010, 183, 2365–2371 CrossRef CAS.
- B. G. Zhai, Q. L. Ma, R. Xiong, X. Li and Y. M. Huang, Mater. Res. Bull., 2016, 75, 1–6 CrossRef CAS.
- H. F. Brito, M. C. F. C. Felinto, J. Hölsä, T. Laamanen, M. Lastusaari, M. Malkamäki, P. Novák, L. C. V. Rodrigues and R. Stefani, Opt. Mater. Express, 2012, 2, 420 CrossRef CAS.
- M. A. Gomes, A. B. Andrade, M. V. do. S. Rezende and M. E. G. Valerio, J. Phys. Chem. Solids, 2017, 102, 74–78 CrossRef CAS.
- N. J. Shivaramu, E. Coetsee, W. D. Roos, K. R. Nagabhushana and H. C. Swart, J. Phys. D: Appl. Phys., 2020, 53, 475305 CrossRef CAS.
- N. J. Shivaramu, B. N. Lakshminarasappa, E. Coetsee, R. E. Kroon and H. C. Swart, Mater. Res. Bull., 2023, 161, 112153 CrossRef CAS.
- V. Singh, G. Sivaramaiah, N. Singh, M. S. Pathak, J. L. Rao, P. K. Singh and A. S. Nagpure, Bull. Mater. Sci., 2019, 42(19), 1–6 CAS.
- N. B. Zhang, C. G. Bai, M. Y. Ma and Z. Y. Li, Trans. Nonferrous Met. Soc. China, 2010, 20, 2020–2025 Search PubMed.
- A. M. Abakumov, O. I. Lebedev, L. Nistor, G. Van Tendeloo and S. Amelinckx, Phase Transitions, 2000, 71, 143–160 CrossRef CAS.
- T. S. Rong, M. Aindow and I. P. Jones, Intermetallics, 2001, 9, 499–506 CrossRef CAS.
- R. D. Shannon, Acta Crystallogr., Sect. A: Cryst. Phys., Diffr., Theor. Gen. Crystallogr., 1976, 32, 751–767 CrossRef.
- Z. K. Heiba, Y. Akin, W. Sigmund and Y. S. Hascicek, J. Appl. Crystallogr., 2003, 36, 1411–1416 CrossRef CAS.
- J. Divya, N. J. Shivaramu, W. Purcell, W. D. Roos and H. C. Swart, Appl. Surf. Sci., 2020, 520, 146294 Search PubMed.
- H. J. L. Clabel, I. T. Awan, G. Lozano, M. A. Pereira-Da-Silva, R. A. Romano, V. A. G. Rivera, S. O. Ferreira and E. Marega, Phys. Chem. Chem. Phys., 2020, 22, 15022–15034 Search PubMed.
- J. F. Moulder, W. F. Stickle, P. E. Sobol and K. D. Bomben, Handbook of X-ray Photoelectron Spectroscopy, ed., Google Sch, 1993, pp. 1–261. https://books.google.com/books/about/Handbook_of_X_ray_Photoelectron_Spectros.html?hl=fr&id=A_XGQgAACAAJ Search PubMed.
- A. H. Wako, F. B. Dejene and H. C. Swart, J. Rare Earths, 2014, 32, 806–811 CrossRef CAS.
- J. D. Baniecki, M. Ishii, T. Shioga, K. Kurihara and S. Miyahara, Appl. Phys. Lett., 2006, 89, 2004–2007 CrossRef.
- O. S. Bezrkovnyi, M. Vorokhta, M. Małecka, W. Mista and L. Kepinski, Catal. Commun., 2020, 135, 105875 CrossRef CAS.
- V. Singh, G. Sivaramaiah, J. L. Rao, S. Sripada and S. H. Kim, Ceram. Int., 2014, 40, 9629–9636 CrossRef CAS.
- V. Vitola, D. Millers, K. Smits, I. Bite and A. Zolotarjovs, Opt. Mater., 2019, 87, 48–52 CrossRef CAS.
- M. Peng and G. Hong, J. Lumin., 2007, 127, 735–740 CrossRef CAS.
- F. F. Bakare, F. G. Aga, B. W. Hirpho, S.-J. Shih and W.-L. Yeh, Adv. Mater. Sci. Eng., 2022, 2022, 1–6 CrossRef.
- M. V. S. Dos Rezende, P. J. Montes, M. E. G. Valerio and R. A. Jackson, Opt. Mater., 2012, 34, 1434–1439 CrossRef.
- M. A. Gomes, A. B. Andrade, M. V. do. S. Rezende and M. E. G. Valerio, J. Phys. Chem. Solids, 2017, 102, 74–78 CrossRef CAS.
- S. M. Rafiaei, G. Dini and A. Bahrami, Ceram. Int., 2020, 46, 20243–20250 CrossRef CAS.
- M. Peng, Z. Pei, G. Hong and Q. Su, J. Mater. Chem., 2003, 13, 1202–1205 RSC.
- Z. Pei, Q. Su and J. Zhang, J. Alloys Compd., 1993, 198, 51–53 CrossRef CAS.
- J. Divya, N. J. Shivaramu, W. D. Roos, W. Purcell and H. C. Swart, J. Alloys Compd., 2021, 854, 157221 CrossRef CAS.
- G. Liu, M. S. Molokeev, B. Lei and Z. Xia, J. Mater. Chem. C, 2020, 8, 9322–9328 RSC.
- V. Singh, R. P. S. Chakradhar, J. L. Rao and J. J. Zhu, Mater. Chem. Phys., 2008, 111, 143–148 CrossRef CAS.
- D. B. Bem, F. B. Dejene, A. S. Luyt and H. C. Swart, Physica B: Condens. Matter, 2012, 407, 1561–1565 Search PubMed.
- S. K. Gupta, K. Sudarshan, P. S. Ghosh, K. Sanyal, A. P. Srivastava, A. Arya, P. K. Pujari and R. M. Kadam, RSC Adv., 2016, 6, 3792–3805 RSC.
- N. Sabbatini, M. Ciano, S. Dellonte, A. Bonazzi, F. Bolletta and V. Balzani, J. Phys. Chem., 1984, 88, 1534 Search PubMed.
- T. Nakamura, K. Kaiya, N. Takahashi, T. Matsuzawa, C. C. Rowlands, V. Beltran-Lopez, G. M. Smith and P. C. Riedi, Phys. Chem. Chem. Phys., 1999, 1, 4011–4014 RSC.
- V. Singh, R. P. S. Chakradhar, J. L. Rao and H.-Y. Kwak, J. Lumin., 2011, 131, 1714–1718 CrossRef CAS.
- S. Yan, Y. Liang, Y. Zhang, B. Lou, J. Liu, D. Chen, S. Miao and C. Ma, J. Mater. Chem. C, 2022, 10, 17343–17352 RSC.
- J. Trojan-Piegza, J. Niittykoski, J. Hölsä and E. Zych, Chem. Mater., 2008, 20, 2252–2261 CrossRef CAS.
- N. J. Shivaramu, B. N. Lakshminarasappa, K. R. Nagabhushana and F. Singh, Spectrochim. Acta, Part A, 2016, 154, 220–231 CrossRef CAS PubMed.
- G. Kitis, J. M. Gomez-Ros and J. W. N. Tuyn, J. Phys. D: Appl. Phys., 1998, 31, 2636–2641 CrossRef CAS.
- C. Furetta, Handbook of Thermoluminescence, World Scientific, Singapore, 2003 Search PubMed.
- A. N. Nyirenda and M. L. Chithambo, J. Nucl. Sci., 2015, 2, 23–30 CrossRef.
- C. M. Sunta, W. E. F. Ayta, J. F. D. Chubaci and S. Watanabe, Radiat. Meas., 2002, 35, 47–57 CrossRef CAS.
- P. D. Townsend, G. C. Taylor and M. C. Wintersgill, Radiat. Eff., 1979, 41, 11–16 CrossRef CAS.
- Y. Wang, P. Feng, S. Ding, S. Tian and Y. Wang, Inorg. Chem. Front., 2021, 8, 3748–3759 RSC.
- R. Chen, D. Lo and J. L. Lawless, Radiat. Prot. Dosim., 2006, 119, 33–36 CrossRef CAS PubMed.
- K. Van Den Eeckhout, A. J. J. Bos, D. Poelman and P. F. Smet, Phys. Rev. B: Condens. Matter Mater. Phys., 2013, 87, 1–11 CrossRef.
- D. Poelman, D. Van Der Heggen, J. Du, E. Cosaert and P. F. Smet, J. Appl. Phys., 2020, 128, 24090 CrossRef.
- Y. Zhang, D. Chen, W. Wang, S. Yan, J. Liu and Y. Liang, Inorg. Chem. Front., 2020, 7, 3063–3071 RSC.
- J. Xu and S. Tanabe, J. Lumin., 2019, 205, 581–620 CrossRef CAS.
- H. Guo, Y. Wang, G. Li, J. Liu and Y. Li, RSC Adv., 2016, 6, 101731–101736 RSC.
- M. K. Ravindra, G. P. Darshan, D. R. Lavanya, K. M. Mahadevan, H. B. Premkumar, S. C. Sharma, H. Adarsha and H. Nagabhushana, Sci. Rep., 2021, 11, 16748 CrossRef CAS PubMed.
- S. M. Bleay, M. J. Bailey, R. S. Croxton and S. Francese, WIREs Forensic Sci., 2021, 3, e1403 CrossRef.
- X. Jin, R. Xin, S. Wang, W. Yin, T. Xu, Y. Jiang, X. Ji, L. Chen and J. Liu, Sens. Actuators, B, 2017, 244, 777–784 CrossRef CAS.
- L. K. Bharat, G. S. R. Raju and J. S. Yu, Sci. Rep., 2017, 7, 1 CrossRef CAS PubMed.
Footnote |
| † Electronic supplementary information (ESI) available. See DOI: https://doi.org/10.1039/d4dt01680g |
| This journal is © The Royal Society of Chemistry 2024 |

