 Open Access Article
Optical sensing of L-dihydroxy-phenylalanine in water by a high-affinity molecular receptor involving cooperative binding of a metal coordination bond and boronate–diol†
María K.
Salomón-Flores
 a,
Alejandro O.
Viviano-Posadas
 a,
Josue
Valdes-García
 a,
Víctor
López-Guerrero
 a,
Diego
Martínez-Otero
 ab,
Joaquín
Barroso-Flores
 ab,
Juan M.
German-Acacio
 c,
Iván J.
Bazany-Rodríguez
 d and
Alejandro
Dorazco-González
 *a
*a
aInstitute of Chemistry, National Autonomous University of Mexico, Ciudad Universitaria, México, 04510, CDMX, Mexico. E-mail: adg@unam.mx
bCentro Conjunto de Investigación en Química Sustentable, UAEM-UNAM, Instituto de Química, Universidad Nacional Autónoma de México, Carretera Toluca-Atlacomulco Km 14.5, C. P. 50200, Toluca, Estado de México, Mexico
cRed de Apoyo a la Investigación, Coordinación de la Investigación Científica-UNAM, Instituto Nacional de Ciencias Médicas y Nutrición SZ, Ciudad de México, CP 14000, Mexico
dFacultad de Química, Universidad Nacional Autónoma de México, Ciudad Universitaria CDMX, 04510 México, Mexico
First published on 18th September 2024
Abstract
Selective recognition and sensing of catecholamine-based neurotransmitters by fluorescent synthetic receptors capable of operating in pure water is a central topic of modern supramolecular chemistry that impacts biological and analytical chemistry. Despite advances achieved in the recognition of some neurotransmitters such as dopamine, little effort has been invested in the optical recognition of other neurotransmitters of paramount importance in biochemistry and medicinal chemistry such as the drug L-dihydroxy-phenylalanine (levodopa). Herein, a cationic Cu(II)–terpyridine complex bearing an intramolecular fluorescent quinolinium ring covalently linked to phenylboronic acid (CuL1) was synthesized, structurally described by single-crystal X-ray diffraction and studied in-depth as a fluorescent receptor for neurotransmitters in water. The complex CuL1 was designed to act as a receptor for levodopa through two Lewis acids of different natures (Cu(II) and B atoms) as cooperative binding points. The receptor CuL1 was found to have a strongly acidified –B(OH)2 group (pKa = 6.2) and exceptionally high affinity for levodopa (K = 4.8 × 10⁶ M−1) with selectivity over other related neurotransmitters such as dopamine, epinephrine, norepinephrine and nucleosides in the micromolar concentration range at physiological pH. Such levodopa affinity/selectivity for a boronic acid-based receptor in water is still rare. On the basis of spectroscopic tools (11B NMR, UV-vis, EPR, and fluorescence), high-resolution ESI-MS, crystal structure, and DFT calculations, the interaction mode of CuL1 with levodopa is proposed in a 1![[thin space (1/6-em)]](https://www.rsc.org/images/entities/char_2009.gif) :
:![[thin space (1/6-em)]](https://www.rsc.org/images/entities/char_2009.gif) 1 model using two-point recognition involving a boronate–catechol esterification and a coordination bond Cu(II)–carboxylate. Furthermore, a visual sensing ensemble was constructed using CuL1 and the commercial fluorescent dye eosin Y. Levodopa is efficiently detected by the displacement of the eosin Y bound to the Cu(II)–receptor, monitoring its green emission. The use of Cu(II)–boronate complexes for fast and selective neurotransmitter sensing was unexplored until now.
1 model using two-point recognition involving a boronate–catechol esterification and a coordination bond Cu(II)–carboxylate. Furthermore, a visual sensing ensemble was constructed using CuL1 and the commercial fluorescent dye eosin Y. Levodopa is efficiently detected by the displacement of the eosin Y bound to the Cu(II)–receptor, monitoring its green emission. The use of Cu(II)–boronate complexes for fast and selective neurotransmitter sensing was unexplored until now.
Introduction
A central challenge in modern supramolecular chemistry is the selective recognition and optical sensing of catecholamine-based neurotransmitters (NTs) such as dopamine, adrenaline, noradrenaline and levodopa (L-3,4-dihydroxyphenylalanine) in water using synthetic fluorescent receptors.1–8 These NTs regulate brain functioning;9 therefore, selectively sensing and quantifying neurotransmitters provides knowledge about how these biogenic catecholamines drive our motor capacity and physiological functions such as learning, memory, cognition and emotions.10–12 In general, the physiological concentrations of these NTs in the cerebrospinal fluid are very low (<10−6 M), making their selective detection and measurement difficult.13 For example, the brain's dopamine concentration ranges from 25 to 40 nM and higher levels are correlated to high blood pressure and cardiotoxicity.14 In contrast, lower dopamine concentration may cause neurological disorders such as Parkinson's disease, Alzheimer's and schizophrenia.9,15–17Levodopa is a neuromodulator and natural precursor for the biosynthesis of dopamine and epinephrine. It is well known that levodopa can cross the protective blood–brain barrier, unlike the rest of the NTs that cannot pass through it.18 For this reason, levodopa is a worldwide-prescribed drug for increasing dopamine levels in the brain in the treatment of dopamine-responsive dystonia and Parkinson's disease.14,19–21 However, recent clinical data have shown that levodopa is toxic when it is in high concentrations.22 Thus, the levels of levodopa and dopamine in physiological samples are chemical indicators of neurological disorders.23,24
To date, an overwhelming majority of levodopa detection methods have been based on electrochemical sensors,22,25 chromatography,26 CdSe quantum dots,8,27–29 TiO2- nanoparticles,30 COFs,31 aptamers32 and tyrosinase assays.33 These sensing methods still suffer from some drawbacks such as multiple steps for their construction, particularly for the nanomaterials, as well as long analysis times and the requirement for specialized labs.
Among the different neurotransmitter sensing techniques, fluorescence is particularly desired due to its high sensitivity and real-time response.4,8,34 Artificial receptors can be exploited as fluorescent chemosensors using various signaling molecular units. While the need for efficient and highly selective optical receptors for levodopa is evident, very few examples have been described to date.
Fluorescent recognition of NTs has been dominated by aldehyde-appended fluorophores able to reversibly react with the amine group from NTs to form imine derivatives, which induce pronounced changes in their optical properties.5,35–37 However, most of these receptors are not particularly selective, and interference from biological amines such as γ-aminobutyric acid (GABA), histamine, serotonin and amino acids can be a problem. Furthermore, these receptors usually require an organic cosolvent, which seriously limits their applications.36
The literature features very few examples of selective receptors for fluorescent sensing of levodopa in water. These receptors include arylboronic acids covalently linked to fluorophores such as metalloporphyrins38 lucifer yellow,39 perylene moieties and quinoline rings40 to yield a conjugated chemosensor. Typically, these borylated receptors show apparent binding constants between 103 and 105 M−1 driven by multi-site recognition that involves boronate–diol complexation with a catechol skeleton from levodopa and secondary supramolecular interactions (π–π stacking, electrostatic interactions and coordination bonds).38 They are suitable for sensing levodopa in the micromolar concentration range, but not significantly below, which is highly desirable for sensing levodopa in pharmaceutical and biological samples.13,34
On the other hand, fluorescent receptors with a single binding point based on boronic acid have the drawback of not being selective for levodopa.41,42 Thus, the creation of a fluorescent chemosensor/receptor with high levodopa affinity is not a trivial task and clearly requires elaborate molecular strategy and synthetic approaches to achieve a chemical affinity by both the catechol and carboxylate groups. Previously, Shinkai demonstrated selective two-point binding of levodopa to a boronic-acid-appended Zn(II)–porphyrin.38 In this line, we recently developed molecular receptors for levodopa43 and fructosyl valine44 in water that operate by cooperative action of boronic acid and a metal coordination bond. Mainly, Zn(II)–terpyridine bearing arylboronic acid complexes exhibited good selectivity and affinity (K ≈ 106 M−1), induced by a complexation boronate–diol and coordination of the carboxylate group from levodopa to a Zn(II) atom. Taking into account that Cu(II) has a greater carboxylate anion affinity compared to Zn(II) and its strong Lewis acidity,45 we surmised that an efficient levodopa chemosensor could be achieved by using a new water-soluble Cu(II)–terpyridine–quinolinium complex bearing a strongly acidified arylboronic acid. The results obtained for a fluorescent Cu(II) complex with phenylboronic acid, including synthesis, crystal structure, spectroscopic neurotransmitter sensing studies and theoretical DFT calculations, are summarized below.
Results and discussion
Synthesis and structural analysis
For these investigations, the bromide salts of CuL1 and CuL2 complexes were synthesized and studied as molecular receptors for a series of NTs, nucleosides and related analytes (Scheme 1).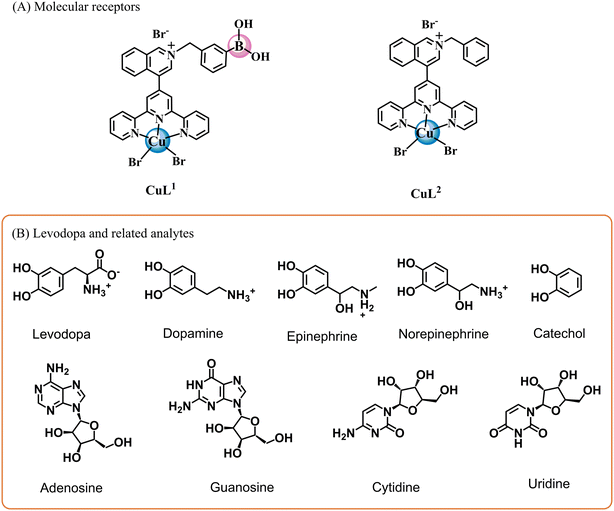 | ||
| Scheme 1 (A) Molecular receptors based on Cu(II)–boronic acid complexes employed in this study and (B) levodopa and related target analytes. | ||
CuL1 includes two Lewis acids of different natures (B and Cu(II) atoms) as binding sites for levodopa, and CuL2, lacking phenylboronic acid, was prepared for comparison purposes. The synthesis was initiated with the preparation of 4-(terpyridine-4′-yl)isoquinoline, 1, as we previously reported,43 and subsequent treatment with 3-(bromomethyl)phenylboronic acid in dry CH3CN under a N2 atmosphere gave cationic ligand L1. L2 was synthesized by the same synthetic path using benzyl bromide instead of a 3-(bromomethyl)phenylboronic acid.
Intermediary 1 and the reported cationic ligands L1–L2 were characterized by (1H, 13C, and 11B) NMR spectroscopy, a positive scan of MS-ESI and ATR-IR. The expected numbers of (1H and 13C) NMR signals of the ligands were consistent with their chemical structures (Fig. S1–S6†). CuL1 and CuL2 complexes were synthesized by direct complexation with 1.10 equiv. of anhydrous CuBr2 in CH3CN at r.t. The bromide salts were obtained as green crystalline powders for both complexes and were pure according to MS-ESI and elemental analysis (C, H, and N). One charged state for CuL1, monocationic species at m/z = 717.9822, corresponding to [CuL1Br2]+ was clearly observed and isotopically resolved from its respective analysis by a positive scan of high-resolution ESI (Fig. S7†). MS-ESI(+) of CuL2 also showed one charged state for a monocationic species at m/z = 673.80 corresponding to [CuL2Br2]+ (Fig. S8†).
X-ray crystal structures were obtained for bromide salts of CuL1 and CuL2. Fig. 1 shows a molecular perspective view of these complexes. Tables S1–S5† contain the crystallographic data, hydrogen bond parameters within the crystal packing and selected distances/angles around Cu(II) and B atoms.
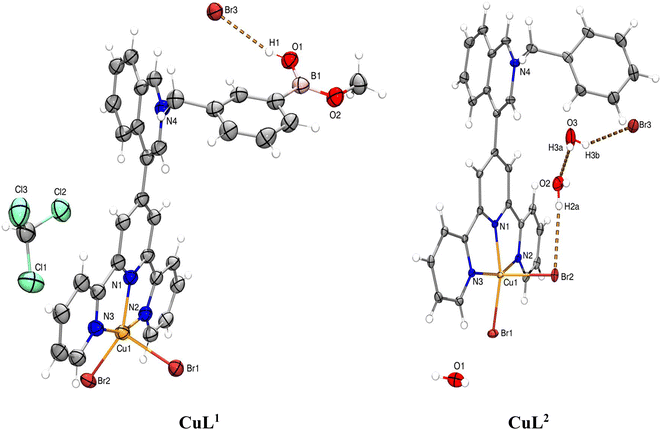 | ||
| Fig. 1 ORTEP diagrams at 50% probability for bromide salts of Cu complexes. B–O−H⋯Br− interaction in CuL1 is shown as dashed orange lines. | ||
The X-ray crystal structure of CuL1 shows a complex with the formula [CuL1Br2]Br·CHCl3 involving an sp2-hybridized B atom and a trigonal planar geometry (Σ∢(X–B–X) = 359.99°). B and Cu(II) atoms are separated by 11.07(4) Å. The single crystals of CuL1 for X-ray diffraction were obtained by diffusion of CHCl3 vapor into a CH3OH solution. As a result of this solvent, the boronic acid group was converted into a monomethyl boronic acid ester.
The methyl esterification of boronic acids from the crystallization solvent was also observed for Ir(III)–boronic acid complexes.46 The B–O–H fragment is stabilized by a Br− anion through a hydrogen bond (Table S2†). The crystal analysis showed that the Cu(II) atoms in CuL1 and CuL2 possess a distorted square-pyramidal geometry with a [CuN3Br2] coordination sphere.
The rings of quinolinium and central pyridine (from terpy) are significantly out of coplanarity for both crystals. For instance, the dihedral angle between the planes of quinolinium and central pyridine for CuL1 is 61.61°. This fact suggests that although the complex has a paramagnetic Cu(II) atom, the fluorescence emission can be maintained, at least in residual form, because this Cu(II) atom is located at a long distance from the fluorescent unit. Furthermore, there is no coplanarity between the fluorescent quinolinium ring47 and the Cu–terpy fragment. The distortion in the coplanarity between these rings seems to be primarily an electronic rather than a steric effect.48
Inspection of the crystal packings of CuL1 and CuL2 reveals the presence of strong π⋯π stacking interactions between central pyridine and lateral pyridine rings of different molecules, as shown in Fig. S11.† These π⋯π interactions are not unexpected because they become more stable when Cu–terpy fragments point in opposite directions as has been reported in the area of inorganic crystal engineering.49
Photophysical and acid–base properties
Bromide salts of ligand L1 and cationic complexes CuL1 and CuL2 possess good solubility in buffered (10 mM MOPS, pH = 7.4) pure water and follow well the Lambert–Beer law to 80 μM. Hence, concentrations within this range were used for further experiments.The absorption and emission maxima (λex = 330) are compiled in Table 1 and the corresponding spectra of L1, CuL1 and CuL2 are shown in Fig. S12–S14.† Clearly, the L1 emission is almost three times higher than that observed for the CuL1 complex; this is not unexpected due to the paramagnetic effect of the Cu(II) atom. However, it is interesting for our purposes that the Cu(II) complexes still have residual emission, and this can be explained by the fact that the fluorescent quinolinium ring is outside the coplanarity of the Cu(II) fragment. Furthermore, as observed in its crystalline structure, the Cu(II) atom and the quinolinium–phenylboronic fragment are separated by a long distance of ∼10 Å (vide supra).
The literature offers several fluorescent Cu(II)-complexes that present large distances between the fluorescent unit and the Cu(II)-fragment, such as Cu(II)–benzimidazole50 and Cu(II)–terpy complexes.51
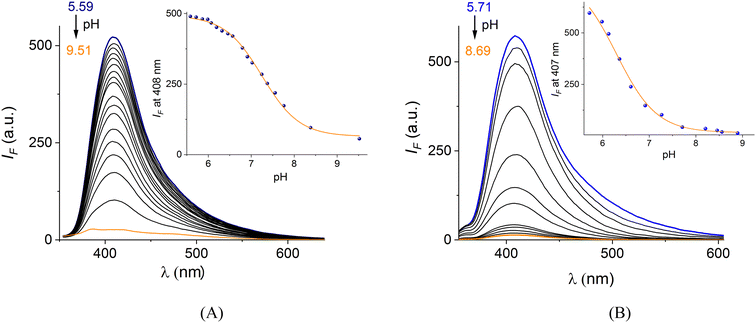
The pKa values of phenyl boronic fragment of L1 and CuL1 can be estimated by the change in the fluorescence that occurs when the B atom converts from the sp2-trigonal to sp3-tetrahedral.52 The pKa values calculated from the titration curves are shown in Fig. 2 and Table 1.
The estimated pKa of the –B(OH)2 group of CuL1 is 6.29, which is an order of magnitude lower than the free ligand L1 (pKa = 7.25). For both species, the acid–base values are significantly lower than those of common receptors based on neutral arylboronic acids (phenylboronic acid pKa = 8.90) for catechols.53–55
This finding is key to our objectives because it reveals that the –B(OH)2 group in CuL1 is in its sp3-boronate form at pH = 7.40, which is the most active B-hybridization form to coordinate diols enabling levodopa recognition under “physiological” conditions.
Furthermore, it is well known that low pKa values of arylboronic acids increase the affinity for diols.53,56–58 In principle, this strongly acidified quinolinium–B(OH)2 group is not unexpected because it is known that the cationic nature of the π electron-deficient quinolinium ring covalently appended to phenylboronic acid considerably reduces the pKa values by up to two orders of magnitude as studied by Geddes with several (iso)quinolinium-nuclei bearing boronic acids for recognition of saccharides as well as CN− and F−.52,59–61
The very low pKa (CuL1) value can only be explained by the coordination of L1 with the Cu(II) atom, which results in a dramatic decrease in its pKa value. To the best of our knowledge, this pKa value is amongst the lowest reported for a phenylboronic acid derivative, and this study is the first to report the pKa value of a phenylboronic acid appended to a Cu(II)-complex. There are two examples in the literature based on Zn(II)–boronate and Gd(III)–boronate complexes with pKa values between 4.60 and 7.33, respectively.43,62
An increase in the Lewis acidity of boronic acids is highly desired in the field of molecular recognition, and these low pKa values demonstrate that the insertion of fragments of metal complexes within boronic acids can be a novel alternative.
Levodopa molecular recognition
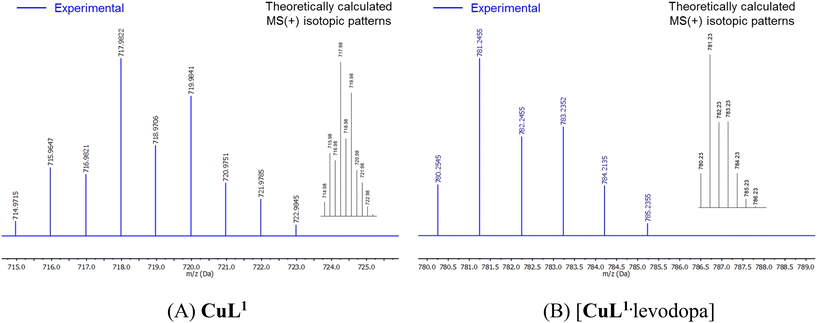
Direct evidence of the high affinity of the CuL1 complex towards levodopa was provided by electrospray ionization (ESI) mass studies, UV-vis measurements, 11B NMR spectroscopy and EPR spectra. High-resolution ESI mass spectra were performed in the positive mode with water–EtOH (v/v, 1/1) solutions of CuL1 (25 μM) in the absence and the presence of 1.1 equiv. of levodopa.For the free complex CuL1 only one charged state at m/z = 717.9822 corresponding to the monocationic species [CuL1Br2]+ is clearly seen and isotopically resolved (Fig. 3A). The HRMS-ESI spectrum with levodopa showed only one species at m/z = 781.2455, which was also isotopically resolved.
This can be ascribed to the monocationic supramolecular complex 1![[thin space (1/6-em)]](https://www.rsc.org/images/entities/char_2009.gif) :
:![[thin space (1/6-em)]](https://www.rsc.org/images/entities/char_2009.gif) 1, {[CuL1·levodopa]·EtOH}+, as shown in Fig. 3B. The experimental signals, separated by 1.0 units, match very well the theoretical isotopic distribution for the supramolecular complex 1
1, {[CuL1·levodopa]·EtOH}+, as shown in Fig. 3B. The experimental signals, separated by 1.0 units, match very well the theoretical isotopic distribution for the supramolecular complex 1![[thin space (1/6-em)]](https://www.rsc.org/images/entities/char_2009.gif) :
:![[thin space (1/6-em)]](https://www.rsc.org/images/entities/char_2009.gif) 1, and the multiplicity of this signal fits well with the presence of a B atom and a Cu atom with their corresponding isotopes. No Br atoms are observed, which suggests that the monocharged species seen in the HRMS-ESI analysis corresponds to the species formed by the tri-cation of CuL1 + boronate group –B(OH)3 + carboxylate group from levodopa.
1, and the multiplicity of this signal fits well with the presence of a B atom and a Cu atom with their corresponding isotopes. No Br atoms are observed, which suggests that the monocharged species seen in the HRMS-ESI analysis corresponds to the species formed by the tri-cation of CuL1 + boronate group –B(OH)3 + carboxylate group from levodopa.
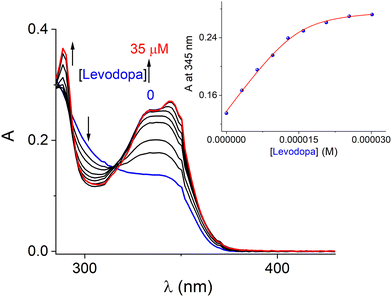
Fig. 4 displays the set of UV-vis spectra obtained when a buffered (pH = 7.4) aqueous solution of CuL1 (15 μM) is titrated with levodopa (0–35 μM). Two isosbestic points at 296 and 318 nm were observed, which indicates that only two species (free form and complexed with levodopa) are in equilibrium. The inset shows the absorbance change at 345 nm (ΔA = 0.14) on increasing the amount of levodopa. The spectrophotometric titration profile was practically saturated when the CuL1/levodopa ratio reached 1 equiv., suggesting a 1![[thin space (1/6-em)]](https://www.rsc.org/images/entities/char_2009.gif) :
:![[thin space (1/6-em)]](https://www.rsc.org/images/entities/char_2009.gif) 1 stoichiometry. This UV-vis isotherm could be well fitted to a 1
1 stoichiometry. This UV-vis isotherm could be well fitted to a 1![[thin space (1/6-em)]](https://www.rsc.org/images/entities/char_2009.gif) :
:![[thin space (1/6-em)]](https://www.rsc.org/images/entities/char_2009.gif) 1 binding model by a nonlinear least-square treatment to give an apparent binding constant of K(1:1) = (9.98 ± 0.07) × 105 M−1. HRMS-ESI and UV-vis experiments unambiguously confirm the binding of levodopa with CuL1 in water.
1 binding model by a nonlinear least-square treatment to give an apparent binding constant of K(1:1) = (9.98 ± 0.07) × 105 M−1. HRMS-ESI and UV-vis experiments unambiguously confirm the binding of levodopa with CuL1 in water.
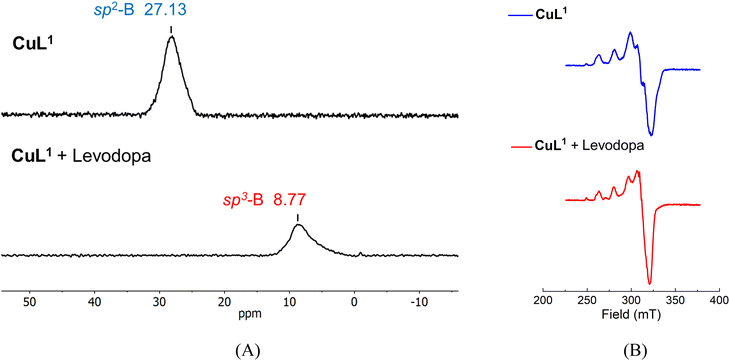
Further evidence of interaction between CuL1 and levodopa was sought through 11B NMR and EPR experiments. Encouraged by reports of an ortho-carborane-based sensor for the detection of paramagnetic Cu(II) ions by 11B NMR signals in D2O,63 we recorded the 11B NMR spectra of free CuL1 and CuL1 + levodopa in CD3OD–D2O (v/v, 2/8). The 11B NMR signal of the solution of the free CuL1 is clearly observed at δ = 27.13 ppm (Fig. 5A), and it can be assigned to a sp2-hybridized B atom, consistent with its X-ray crystal structure. However, this value is upfield shifted compared to neutral phenylboronic acid (δ ∼30 ppm).64 The 11B NMR chemical shift (Δδ ∼6 ppm) can be ascribed to the strong acidification of the phenylboronic fragment in CuL1 due to a combination of (1) the delocalized positive charge on the isoquinolinium ring as described in the literature,43,52,64 and (2) the coordination of L1 to the Cu(II) atom; a similar effect, a similar drop of pKa value, has been documented for a Tb(III)–boronic acid complex.62
The strong acidification of boronic acid from CuL1 was evidenced by the low calculated pKa = 6.29 compared to neutral phenylboronic acid (pKa = 8.80).54 The addition of 5.0 equiv. of levodopa to a solution of CuL1 provokes an upfield shift of the 11B NMR signal at 8.77 ppm. This new signal can be ascribed to conversion of the B atom from the neutral sp2 trigonal planar to the anionic sp3 tetrahedral boronate form.65
The EPR spectrum of a frozen methanolic solution of CuL1 (3.0 mM) shows an anisotropic signal with characteristic hyperfine bands of a Cu(II)–terpy complex involving values of g⊥ = 2.075 and g∥ = 2.230, as shown in Fig. 5B.66
These g values in the order of g∥ > g⊥ > 2.0023 correspond to a typical EPR spectrum for a Cu(II)–terpy with a square-based geometry, which is consistent with its X-ray structure. Furthermore, the A∥ value of 162 × 10−4 cm−1 suggested that CuL1 has a square-pyramidal geometry (A∥ = 154–164 × 10−4 cm−1 for a square-based geometry).66 On the other hand, the spectrum of the same solution containing 5.0 equiv. of levodopa shows an increase in the intensity of observed peaks and modestly modifies the spectral parameters (g⊥ = 2.065, g∥ = 2.22 and A∥ = 156 × 10−4 cm−1). These results indicate that (1) the distorted square-pyramidal geometry practically remains with a dx2–y2 ground state after binding levodopa and (2) the slight changes in the g and A∥ values may be caused by the coordination of the –CO2− group of the levodopa.
Interaction studies of Cu(II)–receptor with NTs by fluorescence spectroscopy
It is known that when catechol derivatives or diols are condensed with fluorescent boronic acids, their photophysical properties, such as intensity and emission maxima, are modified through several mechanisms. Such change provides a signal indicating boronate–diol esterification.67,68Indeed, signaling mechanisms such as photoinduced electron transfer (PET), fluorescence resonance energy transfer (FRET) and photo-induced charge transfer (PICT) are efficient mechanisms for optical phenylboronic acid-based chemosensors of NTs and saccharides.1,2,67
Taking advantage of the fact that complex CuL1 emits residual fluorescence in pure water, we studied it as an intrinsic chemosensor to get a more sensitive optical response. Next, we analyzed the fluorescent selectivity of CuL1 towards a series of NTs.
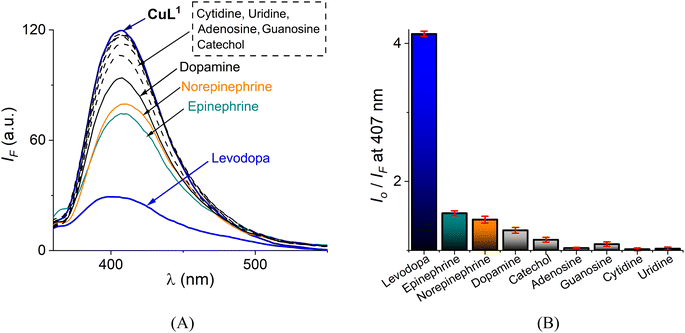
Levodopa, epinephrine, norepinephrine, dopamine and related nucleosides such as adenosine, guanosine, cytidine and uridine ([analyte]total = 30 μM) were added to a buffered (10 mM MOPS at pH = 7.4) aqueous solution of CuL1 (10 μM) and the emission spectra (λex = 330 nm) was recorded, as shown in Fig. 6A.
All nucleosides, catechols and dopamines gave a very low quenching response, IF < 10% of its initial intensity I0. Adding epinephrine/norepinephrine resulted in a modest decrease in intensity of ca. 25% but this quenching was considerably lower than that observed for levodopa. Among the studied NTs, levodopa displayed the greatest quenching effect, ∼88%, as shown in Fig. 6B in Stern–Volmer terms.
This quenching response is not unexpected because the phenylboronic acid sensors typically show a quenching analytical response due to a photoelectron transfer (PET) mechanism when forming a sp3 boronate–diol ester.2,43,67
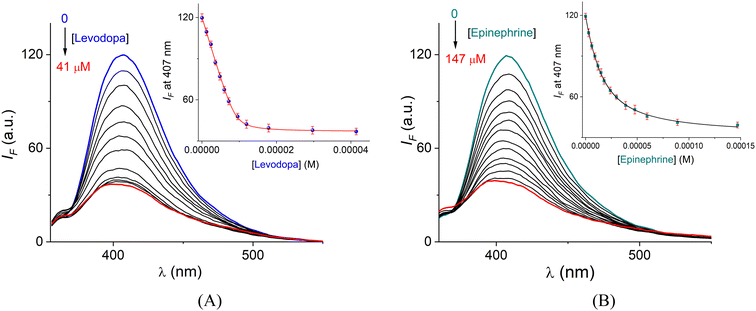
For further insight into the chemosensing ability and to estimate the affinity of CuL1 toward levodopa and epinephrine, fluorimetric titration experiments were performed under the same conditions.
The profile with levodopa at the maximum of 407 nm (Fig. 7A) could be perfectly fitted to a 1![[thin space (1/6-em)]](https://www.rsc.org/images/entities/char_2009.gif) :
:![[thin space (1/6-em)]](https://www.rsc.org/images/entities/char_2009.gif) 1 binding isotherm by a nonlinear least-squares treatment by eqn (1) to get an apparent binding constant of K = (4.76 ± 0.06) × 106 M−1 where ΔIobs corresponds to the observed change of intensity, IR is the intensity of CuL1, ΔI∞ is the change of intensity induced by the levodopa, and [A]T and [R]T are the total concentrations of the analyte and sensor CuL1, respectively. K is the apparent binding constant for the 1
1 binding isotherm by a nonlinear least-squares treatment by eqn (1) to get an apparent binding constant of K = (4.76 ± 0.06) × 106 M−1 where ΔIobs corresponds to the observed change of intensity, IR is the intensity of CuL1, ΔI∞ is the change of intensity induced by the levodopa, and [A]T and [R]T are the total concentrations of the analyte and sensor CuL1, respectively. K is the apparent binding constant for the 1![[thin space (1/6-em)]](https://www.rsc.org/images/entities/char_2009.gif) :
:![[thin space (1/6-em)]](https://www.rsc.org/images/entities/char_2009.gif) 1 model.
1 model.
 | (1) |
The apparent complexation constant estimated using fluorescence is consistent with the value calculated using UV-vis (vide supra), indicating that the complexation CuL1·levodopa practically takes place in the ground state.
The apparent binding constants for epinephrine (Fig. 7B), norepinephrine, dopamine, catechol and nucleosides (adenosine, guanosine, cytidine, uridine and L-Tyr, analytes studied for comparison purposes) were calculated under the same conditions. The K values are compiled in Table 2, and their corresponding fitted fluorimetric titration profiles at 407 nm are shown in Fig. 8A and B. In all cases, good fits to the 1![[thin space (1/6-em)]](https://www.rsc.org/images/entities/char_2009.gif) :
:![[thin space (1/6-em)]](https://www.rsc.org/images/entities/char_2009.gif) 1 binding model scheme were observed.
1 binding model scheme were observed.
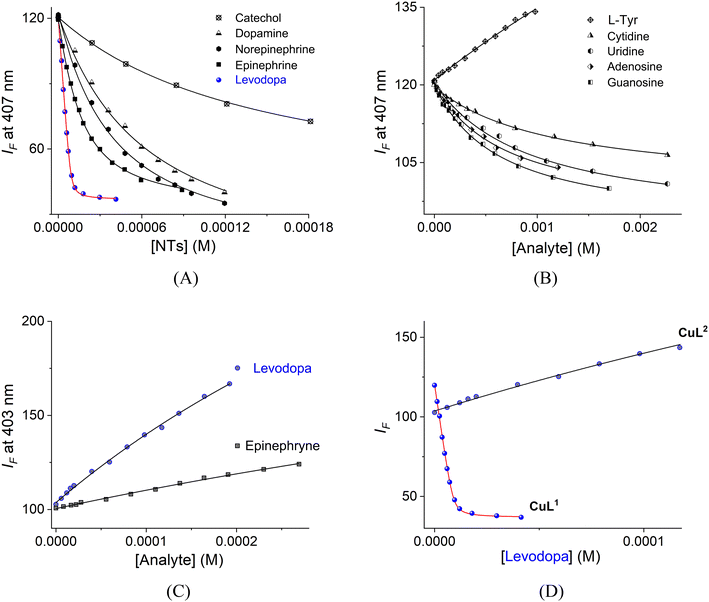 | ||
| Fig. 8 Fluorimetric titrations of buffered aqueous solutions of (A and B) CuL1 (10 μM, λex = 330 nm) and (C) CuL2 (10 μM, λex = 338 nm) upon the addition of increasing amounts of NTs, nucleosides and related analytes at pH = 7.4 and 25 °C. (D) Fluorimetric titration profiles of CuL1 and CuL2 with levodopa. The solid lines were obtained in all instances by fitting the curves to eqn (1). | ||
| Analytes | CuL1, K1:1 | Analytes | CuL1, K1;1 | Analytes | CuL2, K1:1 |
|---|---|---|---|---|---|
| a Not calculated. | |||||
| Levodopa | (4.76 ± 0.06) × 106 | Adenosine | (1.46 ± 0.09) × 103 | Levodopa | (1.37 ± 0.09) × 103 |
| Epinephrine | (9.15 ± 0.11) × 104 | Guanosine | (1.59 ± 0.08) × 103 | Epinephrine | |
| Norepinephrine | (2.99 ± 0.08) × 104 | Cytidine | (8.71 ± 0.06) × 102 | Norepinephrine | |
| Dopamine | (1.82 ± 0.10) × 104 | Uridine | (1.01 ± 0.12) × 103 | Dopamine | |
| Catechol | (7.20 ± 0.05) × 103 | L-Tyr | (3.28 ± 0.05) × 102 | Catechol | |
The tight binding of CuL1 toward catecholamines over nucleosides can be assigned to the higher affinity of boronic acids to the aromatic catechol fragments over that to the aliphatic 1,2-diol groups of ribose.43
L-Tyr showed the lowest affinity among all the diols studied because of the lack of a catechol ring.
Analysis of the values in Table 2 shows that the affinity of CuL1 for levodopa is 3–4 orders of magnitude greater than that of nucleosides/L-Tyr and at least 2 orders of magnitude greater than those of the rest of the NTs including epinephrine (Fig. 8C), which is a common interfering species.
Such levodopa affinity/selectivity for a metal-based chemosensor in water is still rare. To the best of our knowledge, the affinity constant of CuL1 toward levodopa is the largest among the known synthetic receptors for this neurotransmitter in water (Table S6†). For example, this affinity is two orders of magnitude larger than that of organic receptors with a three-point recognition39 or receptors based on boronic acid appended Zn(II)-complexes that include two-point recognition.38,43
Complex CuL1 has a tighter affinity for levodopa compared to the related ZnL1 complex (Table S6†), previously reported by us.43 In principle, the higher affinity of levodopa for the CuL1 complex can be attributed to the fact that the Cu(II) atom is more acidic in terms of Lewis acidity compared to the Zn(II) atom, which should induce stronger coordination with the carboxylate and amine groups from levodopa.45 Furthermore, the Cu(II) atom has a higher versatility in its coordination geometry compared to Zn(II) due to the Jahn–Teller effect, which stabilizes multiple coordination modes, including the chelate mode.69
The molecular recognition of CuL1 for levodopa in pure water is also remarkable because some receptors require organic co-solvents to work.
The main structural difference of levodopa compared to the rest of the NTs is the –CO2− group. Therefore, the coordination of this anionic group to the Cu(II) atom can act as a second recognition point, which drives the high affinity. In terms of pertinent equilibrium constants, the stability of Cu(II)–receptor–analyte decreases according to the sequence: levodopa ≫ epinephrine ∼ norepinephrine > dopamine ≫ nucleosides and L-Tyr.
To verify that boronate–catechol condensation is present in the binding process between CuL1 and levodopa, we measured the affinity of levodopa toward the reference complex CuL2, which lacks phenylboronic acid, by a fluorimetric titration under the same conditions as for CuL1 (Fig. 8D).
The affinity of levodopa toward CuL2 is three orders of magnitude lower compared to that of CuL1 and, interestingly, the analytical response is a modest turn-on of the emission (Fig. S15†), indicating: (1) coordination of levodopa with the Cu(II) atom is evidenced by the EPR spectra; and (2) the quenching emission of the aqueous solution of CuL1 induced by the binding with levodopa must be due to a PET mechanism, which is originated by the formation of sp3 boronate that is not observed with the reference CuL2 complex.
The reversibility of the boronic acid–diol interaction is a key aspect of molecular recognition because it serves as a basis for understanding and improving the sensing response of the target analyte.
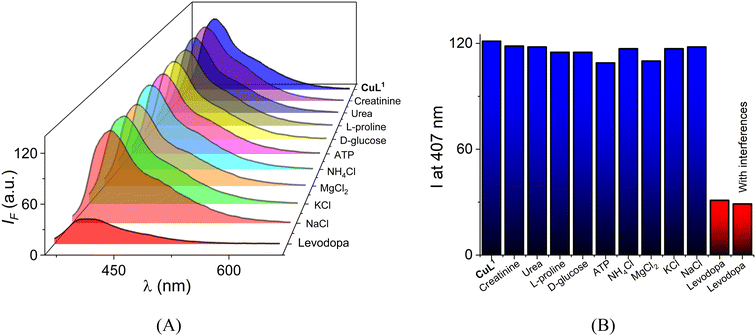
For practical applications, fluorescent levodopa receptors are required to work in the presence of coexistent interfering ions and molecules in biological and complex samples. Next, a selectivity experiment of CuL1 (10 μM) towards typical interfering species in urine and blood plasma ([interference] = 2.0 mM each: creatinine, urea, L-proline, D-glucose, ATP, NH4Cl, MgCl2, KCl and NaCl) was performed in water at physiological pH.
Overall, the addition of these interferences induced a negligible emission shift, which is <3% of the initial intensity (Fig. 9A). It should be noted that the interfering species are present in the millimolar concentration range, which is a higher concentration than that commonly found in real samples. Outstandingly, Fig. 9B shows that the quenching effect at 407 nm induced by levodopa is not affected by the background species of the blood plasma and urine supporting the sensing/selectivity performance in this system.
Sensing ensemble for optical detection of levodopa
A key part of the optical receptor design is the transduction of the molecular recognition into an efficient optical signal. Considering the high affinity of levodopa for CuL1, we developed a visual sensing ensemble for the selective detection of levodopa built with CuL1 and a commercial fluorescent indicator, eosin-Y (EY).It is well documented that the interaction of organic fluorescent dyes bearing a carboxylate group (e.g. EY) with transition dn metal complexes (n = 1–9) alters their emission properties; typically, the interaction quenches the excited state through an electron transfer or an energy transfer.69
As a result, fluorescent sensing of analytes with high affinity for the transition metal complex is achieved by restoring the dye's emission when it is released to the solution by the action of the analyte.
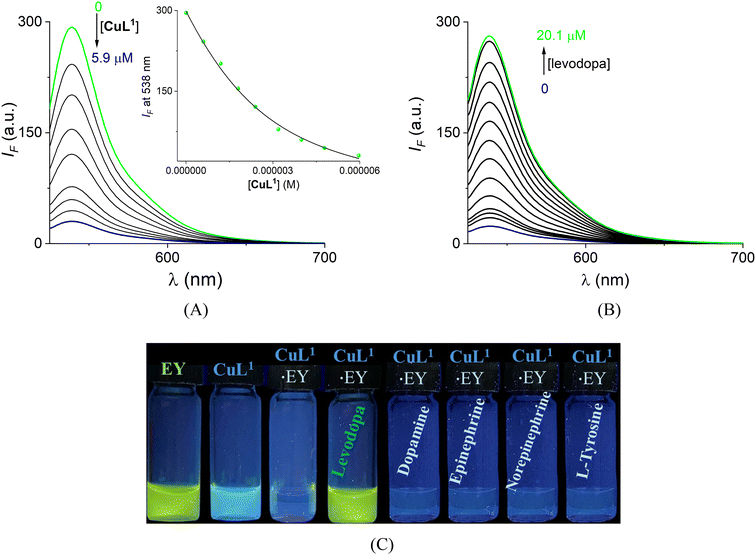
Next, we investigated the affinity of the anionic dye EY (2.0 μM) with CuL1 using a fluorimetric titration experiment (Fig. 10A) upon excitation at 515 nm in buffered water at pH = 7.4.
On CuL1 addition, the fluorescence of the dye is progressively quenched, which reflects the coordination with the Cu(II) atom of the complex. The titration profile at 538 nm showed that the almost total quenching of the EY occurs on the addition of ca. 3 equiv. of CuL1. These data were well fitted to the species of 1![[thin space (1/6-em)]](https://www.rsc.org/images/entities/char_2009.gif) :
:![[thin space (1/6-em)]](https://www.rsc.org/images/entities/char_2009.gif) 1 stoichiometry to give a binding constant of K(EY) = (6.71 ± 0.11) × 105 M−1.
1 stoichiometry to give a binding constant of K(EY) = (6.71 ± 0.11) × 105 M−1.
The affinity of CuL1 for EY is less than the affinity calculated for levodopa, making this an ideal ensemble for a visual sensing system by an indicator displacement assay (IDA).70 In principle, the selectivity of an IDA is suitable when the dye has a slightly lower affinity than the target analyte but a more considerable affinity than other competitive analytes.71
Upon the addition of levodopa to a buffered water solution of the ensemble EY·CuL1 (1/3.0 equiv.), the dye is rapidly displaced, hypothetically via the discoordination of the CO2− group (from EY) of the Cu(II) atom and its green emission is restored practically entirely, as shown in Fig. 10B. The strong visible fluorescence of EY allows the real-time and selective sensing of levodopa by the naked eye under UV light, as shown in Fig. 10C. The green emission of EY is totally quenched by the interaction with CuL1. The resulting solution presents a faint blue emission that can be reflected by the fluorescent unit (quinolinium ring) of the Cu(II)–boronate receptor, which is not altered. Subsequently, the addition of 10 equiv. (20.1 μM) of levodopa to the aqueous solution of the ensemble EY·CuL1 restores 97% of the original intensity emission of EY at 538 nm.
DFT theoretical section
Finally, to gain further insight into the cooperative binding mode of CuL1 with the catechol-based NTs, density functional theory calculations were carried out for the corresponding supramolecular complexes 1![[thin space (1/6-em)]](https://www.rsc.org/images/entities/char_2009.gif) :
:![[thin space (1/6-em)]](https://www.rsc.org/images/entities/char_2009.gif) 1.
1.
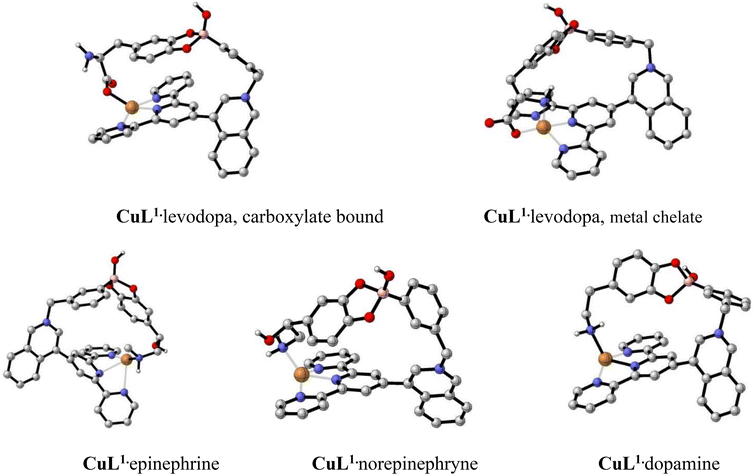
All calculations were carried out with the Gaussian 16 suite of programs at the ωB97XD/LANL2DZ level of theory.72 All compounds were optimized at the mentioned level of theory, and no imaginary frequencies were obtained, thus confirming the presence of minima on the potential energy surface. Their optimized geometries are shown in Fig. 11. Every complex shows a four-coordinate geometry around the Cu(II) atom, with an open site opposed to the ligand that could in principle be filled with a water molecule in solution.
In order to account for the observed selectivity of the analytes (NTs), binding energies to Cu complexes for every analyte were calculated as energy differences at the complex optimized geometry according to eqn (2).
| Ebind = (Elig + ECu(II)) − Ecplx | (2) |
| Neurotransmitter bound to CuL1 | E bind [kcal mol−1] |
|---|---|
| Dopamine | 0.000 |
| Epinephrine | 228.041 |
| Norepinephrine | 199.437 |
| Levodopa, carboxylate bound | 276.693 |
| Levodopa, metal chelate | 290.703 |
In general, calculated Ebind values correlate well with the observed experimental trend of a higher selectivity of CuL1 towards levodopa, involving a cooperative interaction between an ester boronate-catechol and a coordination bond of the –CO2− group with the Cu(II) atom.
For the case of levodopa, the chelate coordination was also considered theoretically, in which the –NH2 group is directly coordinated to Cu(II) together with the carboxylate group (Fig. 11B). The resulting structure is 14.01 kcal mol−1 more stable than the corresponding isomer shown in Fig. 11A. The binding energy as calculated by means of eqn (2) is 261.05 kcal mol−1.
Conclusions
We have developed the first example of a fluorescent Cu(II)–terpy complex bearing an intramolecular phenylboronic acid strongly acidified (CuL1) for optical recognition of levodopa with exceptionally strong affinity (K = 4.76 × 10⁶ M−1) and selectivity over structurally related neurotransmitters such as dopamine, epinephrine, norepinephrine and nucleosides in pure water at physiological pH. The affinity of levodopa for CuL1 is the highest compared to all boronic acid-based molecular receptors reported until now.The addition of levodopa to an aqueous solution of the cationic CuL1 receptor induces a remarkable turn-off signal in the micromolar concentration range. Spectroscopic outputs by 11B NMR, UV-vis, EPR, fluorescence titration experiments, HRMS-ESI measurements and X-ray crystal structure, and DFT calculations showed that levodopa is bound to the CuL1 receptor in a 1![[thin space (1/6-em)]](https://www.rsc.org/images/entities/char_2009.gif) :
:![[thin space (1/6-em)]](https://www.rsc.org/images/entities/char_2009.gif) 1 mode through two-point recognition that includes a boronate–catechol complexation and a coordination bond of the carboxylate anion (levodopa) to the Cu(II) atom.
1 mode through two-point recognition that includes a boronate–catechol complexation and a coordination bond of the carboxylate anion (levodopa) to the Cu(II) atom.
The combination of the receptor CuL1 with eosin-Y can be effectively used as an indicator displacement assay to detect levodopa with the naked eye through a turn-on green fluorescence signal that is not observed for the rest of the neurotransmitters.
Overall, these results highlight the use of novel fluorescent and water-soluble metal receptors based on two different Lewis acids with analytical applications for the selective sensing of catecholamines with medical and biochemical relevance.
Experimental section
The general experimental procedures, equipment and chemicals are described in the ESI.† Intermediate 1 and ligands L1–2 were prepared according to the established synthetic procedures in the literature.43General synthesis path for the Cu complexes
The corresponding ligand L1 or L2 and 1.10 equiv. of the CuBr2 salt were placed in a balloon flask with 5.0 mL of dry CH3CN and stirred for 24 h. at r.t. to give a green solid (in both cases). The solvent was removed under reduced pressure; the precipitate was washed with cold ethyl ether–acetone (10 mL, v/v, 8/2) and dried under vacuum for ∼2 h to give the bromide salt of the corresponding Cu(II) complex.Synthesis of compound CuL1
Following the general path, the ligand L1 (43.0 mg, 0.08 mmol) and CuBr2 (18.55 mg, 0.088 mmol) were reacted to obtain CuL1. Yield: 56.71 mg (95.0%). Green single crystals of CuL1 for X-ray diffraction analysis were obtained by the diffusion of CHCl3 vapor into a CH3OH concentrated solution at r.t. after 4 days.HRMS-ESI+ (m/z): calculated for [C31H24BBr2CuN4O2]+: 717.9613, found: 717.9822. ATR-IR ν (cm−1): 3420 (m, ν (B–O)), 3218(br), 3010(w), 1605(m), 1366(s, ν (B–O)), 1090 (m, ν (B–C)), 1020(m), 791(s), 413(m). Anal. calcd for crystalline sample: C33H27BBr2.54Cl3.46 CuN4O2; C, 43.48; H, 2.99; N, 6.15. Found: C, 43.20; H, 3.05; N, 6.18. EPR (CH3OH, 77 K): g⊥ = 2.075, g∥ = 2.236.
Synthesis of compound CuL2
Following the general path, the ligand L2 (50.0 mg, 0.09 mmol) and CuBr2 (23.34 mg, 0.10 mmol) were reacted to obtain CuL2 as a green solid. Yield: 63.91 mg (90.0%). Deep-blue single crystals of CuL2 for X-ray diffraction analysis were obtained by slow evaporation from CH3CN–H2O (v/v, 9/1) solution after 1 week.MS-ESI(+) (m/z): calculated for [C31H23Br2CuN4]+: 673.96, found: 673.80. ATR-IR ν (cm−1): 3426(br), 2953–2928(m), 1729(m), 1602(s), 1397(m), 793(s), 415(m). Anal. calcd for crystalline sample: [C31H23Br3CuN4]·3(H2O); C, 46.03; H, 3.61; N, 6.93. Found: C, 43.00; H, 3.67; N, 6.89. EPR (CH3OH, 77 K): g⊥ = 2.057, g∥ = 2.245.
The molecular graphics were prepared using POV-RAY76 and GIMP77 programs.
Data availability
Crystallographic data for compounds CuL1 and CuL2 have been deposited at the Cambridge Crystallographic Data Centre under CCDC 2340947 and 2340948.†Conflicts of interest
There are no conflicts to declare.Acknowledgements
The authors thank M.Sc. Eréndira García Rios, M.Sc. Lucero Mayra Ríos Ruiz, M.Sc. Lucía del Carmen Márquez Alonso, M.Sc. Lizbeth Triana Cruz, M.Sc. Hortensia Segura Silva, Dra. Beatriz Quiroz-García, Dra. Adriana Romo Pérez, Chem. María de la Paz Orta Pérez, M.Sc, Mayra León Santiago and M.Sc. Elizabeth Huerta Salazar for technical assistance. The authors also thank PAPIIT-UNAM-220023 and CONACYT PRONACES-160671 for financial support. M.K.S.-F. and A.O. V.-P. are grateful to CONAHCyT for scholarships 848759 and 868013. J.B.F. is grateful to DGTIC-UNAM for his use of the supercomputer Miztli.References
- T. Pradhan, H. S. Jung, J. H. Jang, T. W. Kim, C. Kang and J. S. Kim, Chemical sensing of neurotransmitters, Chem. Soc. Rev., 2014, 43, 4684–4713 RSC
.
- Z. Guo, I. Shin and J. Yoon, Recognition and sensing of various species using boronic acid derivatives, Chem. Commun., 2012, 48, 5956–5967 RSC
.
- H. Ge, Q. Ye, T. Zou, D. Zhang, H. Liu and R. Yang, Recent progress of molecular fluorescent probes with multi-recognition sites enable sensitive and selective analysis, TrAC, Trends Anal. Chem., 2024, 174, 117685 CrossRef CAS
.
- M. Chemchem, A. Chemchem, B. Aydıner and Z. Seferoğlu, Recent advances in colorimetric and fluorometric sensing of neurotransmitters by organic scaffolds, Eur. J. Med. Chem., 2022, 244, 114820 CrossRef CAS PubMed
.
- K. S. Hettie and T. E. Glass, Coumarin-3-aldehyde as a scaffold for the design of tunable PET-modulated fluorescent sensors for neurotransmitters, Chem. – Eur. J., 2014, 20, 17488–17499 CrossRef CAS PubMed
.
- P. Jana and S. Bandyopadhyay, Optical sensor arrays for the detection of neurotransmitters, Analysis Sensing, 2024, 4, e20230099 Search PubMed
.
- Y. Ou, A. M. Buchanan, C. E. Witt and P. Hashemi, Frontiers in electrochemical sensors for neurotransmitter detection: Towards measuring neurotransmitters as chemical diagnostics for brain disorders, Anal. Methods, 2019, 11, 2738–2755 RSC
.
- F. Ghasemi, M. R. Hormozi-Nezhad and M. Mahmoudi, Identification of catecholamine neurotransmitters using fluorescence sensor array, Anal. Chim. Acta, 2016, 917, 85–92 CrossRef CAS PubMed
.
- N. Chauhan, S. Soni, P. Agrawal, Y. P. S. Balhara and U. Jain, Recent advancement in nanosensors for neurotransmitters detection: Present and future perspective, Process Biochem., 2019, 91, 241–259 CrossRef
.
- Y. Misu, Y. Goshima and T. Miyamae, Is DOPA a neurotransmitter?, Trends Pharmacol. Sci., 2002, 23, 262–268 CrossRef CAS PubMed
.
- T. Nagatsu and H. Ichinose, Molecular biology of catecholamine-related enzymes in relation to Parkinson's disease, Cell. Mol. Neurobiol., 1999, 19, 57–66 CrossRef CAS PubMed
.
- Y. C. Chou, C. I. Shih, C. C. Chiang, C. H. Hsu and Y. C. Yeh, Reagent-free DOPA-dioxygenase colorimetric biosensor for selective detection of L-DOPA, Sens. Actuators, B, 2019, 297, 126717 CrossRef CAS
.
- S. D. Niyonambaza, P. Kumar, P. Xing, J. Mathault, P. De Koninck, E. Boisselier, M. Boukadoum and A. Miled, A review of neurotransmitters sensing methods for neuro-engineering research, Appl. Sci., 2019, 9, 1–31 Search PubMed
.
- K. J. Broadley, The vascular effects of trace amines and amphetamines, Pharmacol. Ther., 2010, 125, 363–375 CrossRef CAS PubMed
.
- J. Kim, B. Raman and K. H. Ahn, Artificial receptors that provides a preorganized hydrophobic environment: A biomimetic approach to dopamine recognition in water, J. Org. Chem., 2006, 71, 38–45 CrossRef PubMed
.
- Z. Wu, M. Li, H. Fang and B. Wang, A new boronic acid based fluorescent reporter for catechol, Bioorg. Med. Chem. Lett., 2012, 22, 7179–7182 CrossRef CAS PubMed
.
- D. Merims and N. Giladi, Dopamine dysregulation syndrome, addiction and behavioral changes in Parkinson's disease, Parkinsonism Relat. Disord., 2008, 14, 273–280 CrossRef PubMed
.
- J. E. Hardebo and C. Owman, Enzymatic barrier mechanisms for neurotransmitter monoamines and their precursors at the blood–brain interface, Ann. Neurol., 1980, 8, 1–11 CrossRef CAS PubMed
.
- J. Zhang, F. R. Qu, A. Nakatsuka, T. Nomura, M. Nagai and M. Nomoto, Pharmacokinetics of L-dopa in plasma and extracellular fluid of striatum in common marmosets, Brain Res., 2003, 993, 54–58 CrossRef CAS PubMed
.
- K. Hyland and P. T. Clayton, Aromatic L-amino
acid decarboxylase deficiency: diagnostic methodology, Clin. Chem., 1992, 38, 2405–2410 CrossRef CAS
.
- F. Del Bello, M. Giannella, G. Giorgioni, A. Piergentili and W. Quaglia, Receptor ligands as helping hands to L-DOPA in the treatment of parkinson's disease, Biomolecules, 2019, 9, 142 CrossRef PubMed
.
- L. Lin, H. T. Lian, X. Y. Sun, Y. M. Yu and B. Liu, An l-dopa electrochemical sensor based on a graphene doped molecularly imprinted chitosan film, Anal. Methods, 2015, 7, 1387–1394 RSC
.
- K. A. Kempadoo, E. V. Mosharov, S. J. Choi, D. Sulzer and E. R. Kandel, Dopamine release from the locus coeruleus to the dorsal hippocampus promotes spatial learning and memory, Proc. Natl. Acad. Sci. U. S. A., 2016, 113, 14835–14840 CrossRef CAS PubMed
.
- P. C. Rodriguez, D. B. Pereira, A. Borgkvist, M. Y. Wong, C. Barnard, M. S. Sonders, H. Zhang, D. Sames and D. Sulzer, Fluorescent dopamine tracer resolves individual dopaminergic synapses and their activity in the brain, Proc. Natl. Acad. Sci. U. S. A., 2013, 110, 870–875 CrossRef CAS PubMed
.
- X. Yan, D. Pan, H. Wang, X. Bo and L. Guo, Electrochemical determination of L-dopa at cobalt hexacyanoferrate/large- mesopore carbon composite modified electrode, J. Electroanal. Chem., 2011, 663, 36–42 CrossRef CAS
.
- F. Elbarbry, V. Nguyen, A. Mirka, H. Zwickey and R. Rosenbaum, A new validated HPLC method for the determination of levodopa: Application to study the impact of ketogenic diet on the pharmacokinetics of levodopa in Parkinson's participants, Biomed. Chromatogr., 2019, 33, 1–7 CrossRef PubMed
.
- S. W. Park, T. E. Kim and Y. K. Jung, Glutathione-decorated fluorescent carbon quantum dots for sensitive and selective detection of levodopa, Anal. Chim. Acta, 2021, 1165, 338513 CrossRef CAS PubMed
.
- K. J. Goswami, A. Boruah and N. S. Sarma, Smart-phone-assisted optical biosensors based on silk-fibroin-decorated reduced graphene oxide quantum dots for fluorescent turn-on recognition of L-dopa, ACS Appl. Nano Mater., 2023, 6, 10191–10201 CrossRef CAS
.
- F. Zhu, J. Wang, S. Xie, Y. Zhu, L. Wang, J. Xu, S. Liao, J. Ren, Q. Liu, H. Yang and X. Chen, l -Pyroglutamic acid-modified CdSe/ZnS quantum dots: A new fluorescence-responsive chiral sensing platform for stereospecific molecular recognition, Anal. Chem., 2020, 92, 12040–12048 CrossRef CAS PubMed
.
- H. P. Wu, T. L. Cheng and W. L. Tseng, Phosphate-modified TiO2 nanoparticles for selective detection of dopamine, levodopa, adrenaline, and catechol based on fluorescence quenching, Langmuir, 2007, 23, 7880–7885 CrossRef CAS PubMed
.
- J. Dong, X. Li, S. B. Peh, Y. Di Yuan, Y. Wang, D. Ji, S. Peng, G. Liu, S. Ying, D. Yuan, J. Jiang, S. Ramakrishna and D. Zhao, Restriction of molecular rotors in ultrathin two-dimensional covalent organic framework nanosheets for sensing signal amplification, Chem. Mater., 2019, 31, 146–160 CrossRef CAS
.
- B. Si and E. Song, Recent advances in the detection of neurotransmitters, Chemosensors, 2018, 6, 1–24 CrossRef
.
- R. Baron, M. Zayats and I. Willner, Dopamine-, L-DOPA-, adrenaline-, and noradrenaline-induced growth of Au nanoparticles: Assays for the detection of neurotransmitters and of tyrosinase activity, Anal. Chem., 2005, 77, 1566–1571 CrossRef CAS PubMed
.
- J. Soleymani, Advanced materials for optical sensing and biosensing of neurotransmitters, TrAC, Trends Anal. Chem., 2015, 72, 27–44 CrossRef CAS
.
- K. E. Secor and T. E. Glass, Selective amine recognition: Development of a chemosensor for dopamine and norepinephrine, Org. Lett., 2004, 6, 3727–3730 CrossRef CAS PubMed
.
- H. Yan, Y. Wang, F. Huo and C. Yin, Fast-specific fluorescent probes to visualize norepinephrine signaling pathways and its flux in the epileptic mice brain, J. Am. Chem. Soc., 2023, 145, 3229–3237 CrossRef CAS PubMed
.
- Y. Mei, Q. W. Zhang, Q. Gu, Z. Liu, X. He and Y. Tian, Pillar[5]arene-based fluorescent sensor array for biosensing of intracellular multi-neurotransmitters through host–guest recognitions, J. Am. Chem. Soc., 2022, 144, 2351–2359 CrossRef CAS PubMed
.
- T. Imada, H. Kijima, M. Takeuchi and S. Shinkai, Selective binding of glucose-6-phosphate, 3,4-dihydroxyphenylalanine (DOPA) and their analogs with a boronic-acid-appended metalloporphyrin, Tetrahedron, 1996, 52, 2817–2826 CrossRef CAS
.
- A. Coskun and E. U. Akkaya, Three-point recognition and selective fluorescence sensing of L-DOPA, Org. Lett., 2004, 6, 3107–3109 CrossRef CAS PubMed
.
- Z. Wu, X. Yang, W. Xu, B. Wang and F. Hao, A new boronic acid-based fluorescent sensor for L-dihydroxy-phenylalanine, Drug Discoveries Ther., 2011, 6, 238–241 Search PubMed
.
- G. F. Whyte, R. Vilar and R. Woscholski, Molecular recognition with boronic acids—applications in chemical biology, J. Chem. Biol., 2013, 6, 161–174 CrossRef PubMed
.
- E. J. Jun, H. Liub, J. Y. Choi, J. Y. Lee and J. Yoon, New fluorescent receptor composed of two imidazoliums, two pyrenes and a boronic acid for the recognition of DOPAC, Sens. Actuators, B, 2013, 176, 611–617 CrossRef CAS
.
- I. J. Bazany-Rodríguez, M. K. Salomón-Flores, A. O. Viviano-Posadas, M. A. García-Eleno, D. Martínez-Oteroc and A. Dorazco-González, Chemosensing of neurotransmitters with selectivity and naked eye detection of L-DOPA based on fluorescent Zn(II)-terpyridine bearing boronic acid complexes, Dalton Trans., 2021, 50, 4255–4269 RSC
.
- M. K. Salomón-Flores, J. Valdes-García, A. O. Viviano-Posadas, D. Martínez-Otero, J. Barroso-Flores, I. J. Bazany-Rodríguez and A. Dorazco-González, Molecular two-point recognition of fructosyl valine and fructosyl glycyl histidine in water by fluorescent Zn(II)-terpyridine complexes bearing boronic acids, Dalton Trans., 2024, 53, 8692–8708 RSC
.
- K. M. T. John and W. Bunting, Stability constants for some 1:1 metal-carboxylate complexes, Can. J. Chem., 1970, 48, 1650–1656 Search PubMed
.
- T. Hashemzadeh, M. A. Haghighatbin, J. Agugiaro, D. J. D. Wilson, C. F. Hogan and P. J. Barnard, Luminescent iridium(III)–boronic acid complexes for carbohydrate sensing, Dalton Trans., 2020, 49, 11361–11374 RSC
.
- A. O. Viviano-Posadas, U. Romero-Mendoza, I. J. Bazany-Rodríguez, R. V. Velázquez-Castillo, D. Martínez-Otero, J. M. Bautista-Renedo, N. González-Rivas, R. Galindo-Murillo, M. K. Salomón-Flores and A. Dorazco-González, Efficient fluorescent recognition of ATP/GTP by a water-soluble bisquinolinium pyridine-2,6-dicarboxamide compound. Crystal structures, spectroscopic studies and interaction mode with DNA, RSC Adv., 2022, 12, 27826–27838 RSC
.
- I. J. Bazany-Rodríguez, D. Martínez-Otero, J. Barroso-Flores, A. K. Yatsimirsky and A. Dorazco-González, Sensitive water-soluble fluorescent chemosensor for chloride based on a bisquinolinium pyridine–dicarboxamide compound, Sens. Actuators, B, 2015, 221, 1348–1355 CrossRef
.
- S. Martínez-Vargas, A. Dorazco-González, S. Hernández-Ortega, R. A. Toscano, J. E. Barquera-Lozada and J. Valdés-Martínez, Interaction between aromatic rings as organizing tools and semi-coordination in Cu(II) compounds, CrystEngComm, 2017, 19, 4595–4604 RSC
.
- R. Khattar and P. Mathur, 1-(Pyridin-2-ylmethyl)-2-(3-(1-(pyridin-2-ylmethyl)benzimidazol-2-yl) propyl) benzimidazole and its copper(II) complex as a new fluorescent sensor for dopamine (4-(2-aminoethyl)benzene-1,2-diol), Inorg. Chem. Commun., 2013, 31, 37–43 CrossRef CAS
.
- A. K. Purohit, S. K. Padhan, J. R. Mohanty and P. K. Kar, Chromo-luminescent selective detection of fluoride ions by a copper(II) bis(terpyridine) complex solution via a displacement approach, Photochem. Photobiol. Sci., 2018, 17, 815–821 CrossRef CAS PubMed
.
- R. Badugu, J. R. Lakowicz and C. D. Geddes, Fluorescence sensors for monosaccharides based on the 6-methylquinolinium nucleus and boronic acid moiety: Potential application to ophthalmic diagnostics, Talanta, 2005, 65, 762–768 CrossRef CAS PubMed
.
- J. A. Peters, Interactions between boric acid derivatives and saccharides in aqueous media: Structures and stabilities of resulting esters, Coord. Chem. Rev., 2014, 268, 1–22 CrossRef CAS
.
- G. Springsteen and B. Wang, A detailed examination of boronic acid-diol complexation, Tetrahedron, 2002, 58, 5291–5300 CrossRef CAS
.
- Y. Suzuki, D. Kusuyama, T. Sugaya, S. Iwatsuki, M. Inamo, H. D. Takagi and K. Ishihara, Reactivity of boronic acids toward catechols in aqueous solution, J. Org. Chem., 2020, 85, 5255–5264 CrossRef CAS PubMed
.
- W. L. A. Brooks, C. C. Deng and B. S. Sumerlin, Structure–reactivity relationships in boronic acid–diol complexation, ACS Omega, 2018, 3, 17863–17870 CrossRef CAS PubMed
.
- T. D. James, K. R. A. S. Sandanayake and S. Shinkai, A glucose-selective molecular fluorescence sensor, Angew. Chem., Int. Ed. Engl., 1994, 33, 2207–2209 CrossRef
.
- J. Valdes-García, J. Zamora-Moreno, M. K. Salomón-Flores, D. Martínez-Otero, J. Barroso-Flores, A. K. Yatsimirsky, I. J. Bazany-Rodríguez and A. Dorazco-González, Fluorescence sensing of monosaccharides by bis-boronic acids derived from quinolinium dicarboxamides: structural and spectroscopic studies, J. Org. Chem., 2023, 88, 2174–2189 CrossRef PubMed
.
- R. Badugu, J. R. Lakowicz and C. D. Geddes, Boronic acid fluorescent sensors for monosaccharide signaling based on the 6-methoxyquinolinium heterocyclic nucleus: Progress toward noninvasive and continuous glucose monitoring, Bioorg. Med. Chem., 2005, 13, 113–119 CrossRef CAS PubMed
.
- R. Badugu, J. R. Lakowicz and C. D. Geddes, A wavelength-ratiometric fluoride-sensitive probe based on the quinolinium nucleus and boronic acid moiety, Sens. Actuators, B, 2005, 104, 103–110 CrossRef CAS PubMed
.
- R. Badugu, J. R. Lakowicz and C. D. Geddes, Excitation and emission wavelength ratiometric cyanide-sensitive probes for physiological sensing, Anal. Biochem., 2004, 327, 82–90 CrossRef CAS PubMed
.
- M. Regueiro-Figueroa, K. Djanashvili, D. Esteban-Gómez, T. Chauvin, É. Tóth, A. De Blas, T. Rodríguez-Blas and C. Platas-Iglesias, Molecular recognition of sialic acid by lanthanide(III) complexes through cooperative two-site binding, Inorg. Chem., 2010, 49, 4212–4223 CrossRef CAS PubMed
.
- T. Tanaka, Y. Nishiura, R. Araki, T. Saido, R. Abe and S. Aoki,
11B NMR probes of copper(II): Finding and implications of the Cu2+-promoted decomposition of ortho-carborane derivatives, Eur. J. Inorg. Chem., 2016, 1819–1834 CrossRef CAS
.
- S. Gamsey, N. A. Baxter, Z. Sharrett, D. B. Cordes, M. M. Olmstead, R. A. Wessling and B. Singaram, The effect of boronic acid-positioning in an optical glucose-sensing ensemble, Tetrahedron, 2006, 62, 6321–6331 CrossRef CAS
.
- S. A. Valenzuela, J. R. Howard, H. M. Park, S. Darbha and E. V. Anslyn,
11B NMR spectroscopy: Structural analysis of the acidity and reactivity of phenyl boronic acid–diol condensations, J. Org. Chem., 2022, 87, 15071–15076 CrossRef CAS PubMed
.
- A. Dorazco-González and A. K. Yatsimirsky, Binding of ureas and amides to a Cu(II) terpyridine complex in methanol, Inorg. Chim. Acta, 2010, 363, 270–274 CrossRef
.
- G. Fang, H. Wang, Z. Bian, J. Sun, A. Liu, H. Fang, B. Liu, Q. Yao and Z. Wu, Recent development of boronic acid-based fluorescent sensors, RSC Adv., 2018, 8, 29400–29427 RSC
.
- S. D. Bull, M. G. Davidson, J. M. H. van den Elsen, J. S. Fossey, A. T. A. Jenkins, Y. Jiang, Y. Kubo, F. Marken, K. Sakurai, J. Zhao and T. D. James, Exploiting the reversible covalent bonding of boronic acids: Recognition, sensing, and assembly, Acc. Chem. Res., 2013, 46, 312–326 CrossRef CAS PubMed
.
- V. Amendola, G. Bergamaschi, A. Buttafava, L. Fabbrizzi and E. Monzani, Recognition and sensing of nucleoside monophosphates by a dicopper(II) cryptate, J. Am. Chem. Soc., 2010, 132, 147–156 CrossRef CAS PubMed
.
- R. V. Velázquez-Castillo, M. K. Salomón-Flores, A. O. Viviano-Posadas, I. J. Bazany-Rodríguez, C. Bustos-Brito, J. M. Bautista-Renedo, N. González-Rivas, L. D. Rosales-Vázquez and A. Dorazco-González, Recognition and visual detection of ADP and ATP based on a dinuclear Zn(II)-complex with pyrocatechol violet in water, Dyes Pigm., 2021, 196, 109827 CrossRef
.
- C. Schmuck and M. Schwegmann, A naked-eye sensing ensemble for the selective detection of citrate—but not tartrate or malate—in water based on a tris-cationic receptor., Org. Biomol. Chem., 2006, 4, 836–838 RSC
.
-
M. J. Frisch, G. W. Trucks, H. B. Schlegel, G. E. Scuseria, M. A. Robb, J. R. Cheeseman, G. Scalmani, V. Barone, G. A. Petersson, H. Nakatsuji, X. Li, M. Caricato, A. V. Marenich, J. loino, B. G. Janesko, R. Gomperts, B. Mennucci, H. P. Hratchian, J. V. Ortiz, A. F. Izmaylov, J. L. Sonnenberg, D. Williams-Young, F. Ding, F. Lipparini, F. Egidi, J. Goings, B. Peng, A. Petrone, T. Henderson, D. Ranasinghe, V. G. Zakrzewski, J. Gao, N. Rega, G. Zheng, W. Liang, M. Hada, M. Ehara, K. Toyota, R. Fukuda, J. Hasegawa, M. Ishida, T. Nakajima, Y. Honda, O. Kitao, H. Nakai, T. Vreven, K. Throssell, J. A. Montgomery Jr., J. E. Peralta, F. Ogliaro, M. J. Bearpark, J. J. Heyd, E. N. Brothers, K. N. Kudin, V. N. Staroverov, T. A. Keith, R. Kobayashi, J. Normand, K. Raghavachari, A. P. Rendell, J. C. Burant, S. S. Iyengar, J. Tomasi, M. Cossi, J. M. Millam, M. Klene, C. Adamo, R. Cammi, J. W. Ochterski, R. L. Martin, K. Morokuma, O. Farkas, J. B. Foresman and D. J. Fox, Gauss View 5.0, Gaussian, Inc., Wallingford, USA, 2016 Search PubMed
.
-
Bruker SAINT and SADABS, Bruker AXS Inc., Madison, Wisconsin, USA, 2007 Search PubMed
.
- G. M. Sheldrick, A short history of SHELX, Acta Crystallogr., Sect. A: Found. Crystallogr., 2007, 64, 112–122 CrossRef PubMed
.
- C. B. Hübschle, G. M. Sheldrick and B. Dittrich, ShelXle: A Qt graphical user interface for SHELXL, J. Appl. Crystallogr., 2011, 44, 1281–1284 CrossRef PubMed
.
- Persistence of Vision Raytracer (version 3.6), Persistence of Vision Raytracer (Version 3.6), https://www.povray.org.
- GIMP 2.8: The GNU Image Manipulation Program, https://www.gimp.org, GIMP 2.8 GNU Image Manip. Program, https://www.gimp.org.
Footnote |
| † Electronic supplementary information (ESI) available: General information, X-ray crystallographic data, 1H NMR and 13C NMR spectra for ligands L1–2, fluorimetric and UV-vis titration experiments and EPR measurements. CCDC 2340947 and 2340948. For ESI and crystallographic data in CIF or other electronic format see DOI: https://doi.org/10.1039/d4dt02108h |
| This journal is © The Royal Society of Chemistry 2024 |

