 Open Access Article
Creative Commons Attribution 3.0 Unported Licence
Preliminary observation of strong NOx release over Qiyi Glacier in the northeast of the Tibetan Plateau†
Weili
Lin
 a,
Feng
Wang
b,
Chunxiang
Ye
 c and
Tong
Zhu
 *c
*c
aKey Laboratory of Ecology and Environment in Minority Areas, Minzu University of China, National Ethnic Affairs Commission, Beijing 100081, China
bChina Everbright International Limited, Shenzhen 518040, China
cBIC-ESAT and SKL-ESPC, College of Environmental Sciences and Engineering, Peking University, Beijing 100871, China. E-mail: Tzhu@pku.edu.cn
First published on 16th January 2024
Abstract
NOx is released from sunlit snowpack surfaces, and this considerably influences the oxidizing capacity of the clean boundary layer atmosphere in Antarctic and Arctic regions and the potential interpretation of the historical atmospheric composition recorded in the ice core. The Tibetan Plateau is an important snow-covered region in the northern midlatitudes, with strong solar radiation and relatively high NO3− in snow/ice. Released NOx on the glacier surface of the Tibetan Plateau should be strong. To confirm this hypothesis, field observations were performed at 4600 m above the sea level in Qiyi Glacier in late August 2004. The surface ultraviolet-B (UVB) radiation level reached >4.5 W m−2 and was increased by the strong reflection of snow/ice and clouds against the Sun and strengthened by the topographical effect. The concentrations of NO3− and NH4+ in water from melting snow were hardly detected, but the average concentration (±1σ) of NO3− in snow samples was 8.7 ± 2.7 μmol L−1. Strong correlations were observed between NOx (NO2) mixing ratios and UVB radiation levels in the Tibetan glacier. Vertical experiments revealed a negative gradient of NOx (NO2) mixing ratios from the glacier snow surface to a height of 30 cm. As a result of the high levels of UV radiation and high NO3− concentrations in snow/ice, the mixing ratios of NOx released by fresh snow in Qiyi Glacier in late August reached several parts per billion (ppbv) and were approximately one order of magnitude higher than those observed in polar regions. This observation provides direct evidence to support the research hypothesis and confirms the release of high concentrations of NOx in the boundary layer of the highland glaciers and snow surfaces.
Environmental significanceNOx is released from sunlit snowpack surfaces, and this significantly influences the oxidizing capacity of the clean boundary layer atmosphere and the potential interpretation on the historical atmospheric composition recorded in the ice core. The Tibetan Plateau is an important snow-covered region in the northern midlatitudes, with strong solar radiation and relatively high NO3− in snow/ice. Released NOx on the glacier surface of the Tibetan Plateau should be strong. To verify this hypothesis, field observations were carried out at 4600 m asl in Qiyi Glacier, the Tibetan Plateau. This observation provides direct evidence to support the research hypothesis and confirms the release of high concentrations of NOx in the boundary layer of highland glaciers and snow surfaces. |
1 Introduction
NOx and other gases may be released from sunlit snowpacks in Antarctic and Arctic regions, thus considerably influencing the oxidizing capacity of the polar boundary layer atmosphere and the potential interpretation of the historical atmospheric composition recorded in the ice core.1–6 The ice core record of the nitrate was used for estimating the preindustrial NO emission levels.7 This promotes scientific awareness and research on the importance of photochemical processes on polar ice surfaces.8–11 NOx release in the photolysis experiments of natural snow was observed not only in polar regions but also in midlatitudes during winter.12 Therefore, solar radiation-induced release of NOx or other trace substances from snow/ice is a common phenomenon. A possible mechanism of snow nitrate (NO3−) photolysis to produce NO/NO2 was proposed13 and has been confirmed through laboratory research14 and many field observations.4,15 More complicated and further improved mechanisms can be found in previous studies16–18 and review paper.19The Tibetan Plateau, with an area of 2![[thin space (1/6-em)]](https://www.rsc.org/images/entities/char_2009.gif) 500
500![[thin space (1/6-em)]](https://www.rsc.org/images/entities/char_2009.gif) 000 km2, is an important snow-covered region in the northern midlatitudes. The characteristics of clean air, high altitude (>4000 m on average), and high surface albedo (including snow/ice reflection) subject this region to high levels of solar radiation.20 Its lower atmosphere has a strong photochemical oxidizing capacity with strong photolysis of surface O3 and high production potential of OH radicals, as high as 4–5 × 10⁻⁵ and 1–4 × 10⁶ s−1, respectively.21 Under the influence of the westerlies and Asian monsoons, the chemical compositions of snow in the northern and southern regions of the Plateau are different, and the NO3− concentration in the Tibetan Plateau (1.7–4.2 μmol L−1) are higher than that in Arctic and Antarctic regions (0.23–2.0 μmol L−1).22,23 Therefore, photochemical reactions in the snow surface must be stronger and the NOx concentration must be higher in the Tibetan Plateau than in the Arctic and Antarctic regions. To confirm this hypothesis, we report preliminary observations of NOx concentration and ultraviolet-B (UVB) radiation levels in late August 2004 on the surface of Qiyi Glacier (July 1 Glacier), Tibetan Plateau.
000 km2, is an important snow-covered region in the northern midlatitudes. The characteristics of clean air, high altitude (>4000 m on average), and high surface albedo (including snow/ice reflection) subject this region to high levels of solar radiation.20 Its lower atmosphere has a strong photochemical oxidizing capacity with strong photolysis of surface O3 and high production potential of OH radicals, as high as 4–5 × 10⁻⁵ and 1–4 × 10⁶ s−1, respectively.21 Under the influence of the westerlies and Asian monsoons, the chemical compositions of snow in the northern and southern regions of the Plateau are different, and the NO3− concentration in the Tibetan Plateau (1.7–4.2 μmol L−1) are higher than that in Arctic and Antarctic regions (0.23–2.0 μmol L−1).22,23 Therefore, photochemical reactions in the snow surface must be stronger and the NOx concentration must be higher in the Tibetan Plateau than in the Arctic and Antarctic regions. To confirm this hypothesis, we report preliminary observations of NOx concentration and ultraviolet-B (UVB) radiation levels in late August 2004 on the surface of Qiyi Glacier (July 1 Glacier), Tibetan Plateau.
2 Site, observations, and methods
The observation of NOx on the surface of Qiyi Glacier (39.241° N, 97.756° E, 4600 m asl) was conducted from 26 to 31 August 2004. Qiyi Glacier is located in the hinterland of the Qilian Mountains and is approximately 116 km away from the southwestern border of Jiayuguan City, Gansu Province. The glacier is situated on the slopes with a gradient of <45°, and its terminus is facing north (Fig. S1†). The altitude of the glacier summit is 5150 m, and that of the frontier glacier tongue is approximately 4300 m. At 4600 m asl, it has an ablation zone of the glacier with occasional summer snowfall.NO2 was measured through chemiluminescence using the LMA-3D Luminox monitor (Unisearch Associates Inc., Ontario, Canada). Air was drawn through the LMA-3D vacuum pump and allowed to flow across a fabric wick saturated with a specially formulated luminol solution. When NO2 encounters the wick, the luminol oxidizes and produces chemiluminescence (in the region of 425 nm). A photomultiplier tube measures the light produced and converts it into a signal that is proportional to the NO2 concentration. The air is passed through a converter, where NO in the air is oxidized to NO2. The detection limit is <10 ppt NO2 and the response time is 0.2 s. The sample inlet was close to the snow surface (∼3.0 cm). Solar UVB radiation levels (280–320 nm) were measured using a UVB pyranometer (Model UVB-1, Yankee Environmental Systems Inc., MA, USA). The measurement technique involves the use of coloured glass filters and a highly stable UV-sensitive fluorescent phosphor to stop all of the Sun's visible light and convert UV photons into visible light, which is then measured using a solid-state photodetector. The response time of the UVB-1 pyranometer is approximately 0.1 s. The winds were measured using a Model 05103 Wind Monitor (R. M. Young Company, Michigan, USA). The relative humidity was measured using an Assmann ventilation dry and wet meter. The snow samples were collected from nonmelted snow on the glacier surface, and the water samples were collected from melting snow from high altitudes flowing in an ice ditch. A DIONEX2100 ion chromatograph (An AS14 column for anion separation and a CS12 column for cation separation) was used for ion analysis on the samples. Power was supplied by a HONDA SHX2000 gasoline generator, which was 100 m away from the analyzer. The line between the observation and generator positions was perpendicular to the dominant wind direction (katabatic and anabatic winds).
The Tropospheric Ultraviolet-Visible Radiation Model (TUV4.1 version, https://www2.acom.ucar.edu/modeling/tropospheric-ultraviolet-and-visible-tuv-radiation-model) was used to simulate the ground UVB radiation on clear sunny days. The changed input parameters are summarized as follows. The total ozone amounts overhead were obtained from Total Ozone Mapping Spectrometer data, and the values from 26 to 30 August were 297, 291, 282, 275, and 273 DU, respectively. The aerosol optical thickness at 340 nm was set at 0.19. The vertical profiles of ozone, air density, and air temperature in the northern region of the Tibetan Plateau (32–40° N, 70–110° E) were obtained from SAGE-II satellite remote sensing data (the NASA Langley Research Center, USA, https://www.sage2.larc.nasa.gov/data/v6_data/Version6.2). The surface albedo was set at 0.9. Treatments similar to the TUV model were applied in the UVB simulation for the north valley of Qomolangma.21
3 Results
It snowed heavily during 22–23 August 2004, and it was cloudy; the wind speed was strong on 24–25 August. Measurements were obtained from this fresh snow surface from 26 August, through its melting and spoilage processes, and no new snowfall was noted in the following observation days. After heavy snowfall, 26 August was the first sunny day. The wind was strong around noon and in the afternoon, and relatively low in the morning and evening. The clouds drifted one after the other, and the UVB radiation level exhibited large variations during the daytime. Signs of loess dust falling into glaciers were clearly identified around this time (Fig. S2†).3.1 Measurement and simulation of UVB radiation
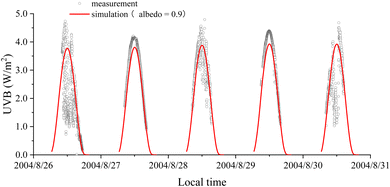
Fig. 1 shows the variations in the measured UVB radiation levels and the simulated values. UVB radiation levels could exceed 4.5 W m−2, which was much higher than the radiation level measured at noon in June (3.8 W m−2, with a lower solar zenith at noon) at an altitude of 5050 m in the north valley of Mt. Qomolangma21 and at Zhongshan Station (69°22′S, 76°22′E), Antarctica.24 The highest UVB value on clear days (27 and 29 August) was lower than that on cloudy days (26, 28, and 30 August). The measured UVB values were higher than the simulated values even when the surface albedo value was set at 0.9. In the daytime of 28 and 29 August, the relative humidity was 61–94%, with a water vapor density of 2.1–4.6 g m−3. During 12:00–15:00 on 31 August 2004, six surface albedos in different places on the glacier were obtained using a UVB pyranometer (UVB-1). The measured albedo values on 31 August 2004 varied from 0.24 to 0.58, with an average of 0.42 ± 0.11 (Table 1). The values were lower than those of ultraviolet albedos (0.70–0.90) over the fresh snow surface.25–27| Place no. | Average albedo (%) | Standard deviation (%) | Measurement time on 31 August |
|---|---|---|---|
| 1 | 37.7 | 8.0 | 11:40–12:00 |
| 2 | 57.8 | 3.0 | 12:00–12:30 |
| 3 | 44.3 | 2.6 | 12:30–12:55 |
| 4 | 42.4 | 5.0 | 12:55–13:06 |
| 5 | 23.4 | 0.5 | 13:06–13:20 |
| 6 | 45.4 | 4.1 | 13:20–13:45 |
3.2 Inorganic ion concentrations in snow and water samples
Table 2 lists the inorganic ion concentrations in snow and water samples. Samples were collected during the daytime. SO42− was the most abundant anion, followed by Cl− and NO3−, and Ca2+ was the most abundant cation, followed by Na+ and Mg2+ (Table 2). The concentrations of NO3− and NH4+ in the snow samples were much higher than those in the water samples, in which NO3− and NH4+ in the water samples was difficult to detect. The average concentration (±1σ) of NO3− in the ten snow samples was 8.7 ± 2.7 μmol L−1 (0.44 ± 0.13 ppm (w/w)), which was much higher than that in Antarctic (0.4–2.0 μmol L−1) and Arctic (1.9–2.6 μmol L−1) snow/ice regions.22,23| Sample no. | Sample time | [Cl−] | [NO3−] | [SO42−] | [Na+] | [NH4+] | [K+] | [Mg2+] | [Ca2+] |
|---|---|---|---|---|---|---|---|---|---|
| a In sample no., S: snow; W: water. | |||||||||
| W#1 | 8–31 14:00 | 0.55 | <0.01 | 0.63 | 0.47 | <0.01 | 0.05 | 0.56 | 2.89 |
| W#2 | 8–31 12:00 | 0.28 | <0.01 | 1.00 | 0.73 | 0.03 | 0.05 | 0.54 | 4.11 |
| W#3 | 8–30 15:00 | 0.65 | <0.01 | 0.80 | 0.73 | 0.01 | 0.10 | 0.48 | 3.00 |
| S#1 | 8–27 13:18 | 0.65 | 0.34 | 1.17 | 0.57 | 0.10 | 0.09 | 0.14 | 5.43 |
| S#2 | 8–27 13:18 | 0.49 | 0.26 | 0.76 | 0.22 | 0.06 | 0.05 | 0.10 | 3.69 |
| S#3 | 8–27 14:18 | 0.76 | 0.45 | 1.51 | 0.46 | 0.08 | 0.09 | 0.21 | 9.24 |
| S#4 | 8–27 15:18 | 0.71 | 0.48 | 1.42 | 0.46 | 0.08 | 0.08 | 0.12 | 6.07 |
| S#5 | 8–27 16:33 | 0.54 | 0.37 | 1.05 | 0.27 | 0.06 | 0.04 | 0.47 | 6.58 |
| S#6 | 8–27 17:33 | 0.55 | 0.34 | 0.99 | 0.25 | 0.03 | 0.05 | 0.34 | 5.44 |
| S#7 | 8–29 13:00 | 1.86 | 0.56 | 0.66 | 1.25 | 0.56 | 1.18 | 0.38 | 2.11 |
| S#8 | 8–29 14:00 | 0.82 | 0.53 | 0.63 | 0.31 | 0.37 | 0.43 | 0.43 | 2.23 |
| S#9 | 8–29 15:15 | 0.41 | 0.68 | 0.82 | 0.07 | 0.14 | 0.04 | 0.19 | 3.47 |
| S#10 | 8–29 16:00 | 0.31 | 0.39 | 0.26 | 0.02 | 0.19 | 0.08 | 0.19 | 1.74 |
3.3 Relationships between NOx and UVB
Fig. 2 shows variations in the mixing ratios of NO2 and NOx and UVB radiation levels on 26 August 2004. Before 16:00, the LMA-3D was used for continuous measurement for 1 or 2 h in a fixed NO2 or NOx mode. At 16:00, the instrument was switched to the automatic switching mode, and NO2 and NOx were measured in turn for 1 min. The change in NOx (NO2) concentration corresponded well with the increase and decrease in UVB radiation, and a clear correlation was observed between them (Fig. 2 and S3†). When the UVB radiation level was high, the concentration of NOx (NO2) could reach magnitudes of several parts per billion, approximately 1 order of magnitude higher than that observed in polar regions.3,28,29 After sunset, the concentration of NOx (NO2) gradually decreased to the background level at night. Hence, a sunlit condition was a key factor influencing NOx (NO2) concentrations on the surface of ice and snow. According to the slopes shown in Fig. S3,† with a 1 unit change in the UVB radiation level, NO2 and NOx changed 0.47 and 1.17 ppb, respectively. NO2 accounted for 40.2% of the total NOx.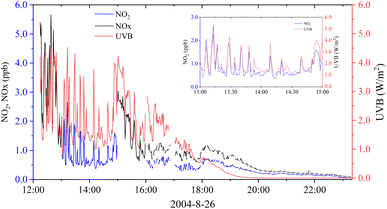 | ||
| Fig. 2 Variations in the mixing ratios of NO2 and NOx and UVB radiation levels on 26 August 2004. The data were averaged in 1 min. | ||
In the following days, the snow melted further. Strong correlations were observed between NOx (NO2) and UVB (Fig. S4–S7†), similar to the observations on 26 August, but with considerably lower mixing ratios of NOx and NO2. On 30 August, we cleared the remaining surface snow near the observation region, and the sample inlet was deployed near the glacier ice surface. Fig. 3 shows variations in NO2, NOx, and UVB on 30 August 2004, and Fig. S7† shows correlations between NOx (NO2) and UVB. On the glacier ice surface, a strong relationship was observed between NOx (NO2) and UVB radiation levels. However, unlike on the snow surface, the ratio of NO2 to NOx on the glacier ice surface was approximately 90%, which indicates that NO2 rather than NO was directly released from the ice surface. In addition, the levels of NOx (NO2) released on the glacier ice surface were much lower and more fluctuating than those on the fresh snow surface.
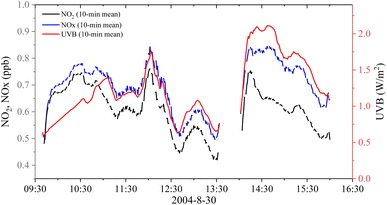 | ||
| Fig. 3 Variations in the mixing ratios of NO2 and NOx and UVB radiation on 30 August 2004. The data were averaged in 10 min. | ||
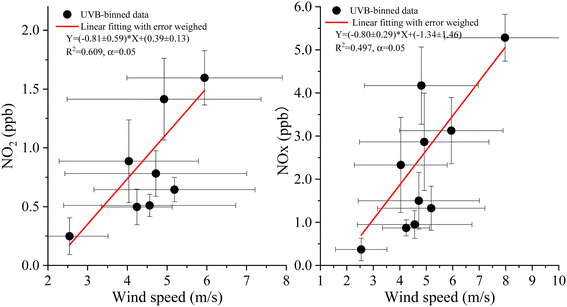
Wind speed can be an important factor influencing the processes of snowpack release and air dilution. To weaken the influence of these processes on the relationship between NOx and UVB, the corresponding data of NOx, NO2, and UVB radiation at different binned wind speeds (0.5 m s−1 as an interval) were calculated, and the relationships between the binned NOx (NO2) mixing ratios and UVB radiation levels are shown in Fig. 4. Similar results were obtained from no binned data (Fig. S3†), but with a lower ratio (30.8%) of NO2 to NOx. Gaseous NO2 was the main product of NO3− photolysis in snow or ice,4,14,15 and only those NO2 on the snow surface can be directly released into the air; the remaining NO2 is then photo-dissociated into NO.30,31 Our observations confirmed these conclusions.
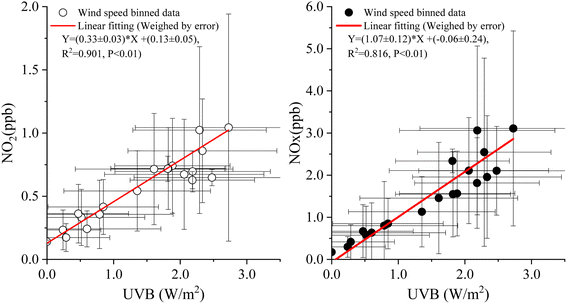 | ||
| Fig. 4 Correlations between NOx (NO2) and UVB radiation levels under different wind speed bins (0.5 m s−1 as an interval) on 26 August 2004. | ||
Similarly, to determine the influence of the wind speed on NOx (NO2) release by weakening the influence of UVB on the relationship between NOx and wind speed, data on wind speed, NOx level, and NO2 level were reclassified according to the UVB binned data (0.5 W m−2 as an interval), and the relationships between the binned wind speed and NOx (NO2) were obtained (Fig. 5). Significant correlations were observed between NOx (NO2) and wind speed, indicating that the wind speed could promote NOx (NO2) release from the snowpack, and the close values of slopes indicated the same effect of wind on NO and NO2 release rates.
3.4 Variations in vertical NOx distribution at different sample heights
On 27 August 2004, experiments were conducted with three sampling inlet heights (1.5, 3.0, and 30 cm above the surface level every 5 min) to obtain vertical changes in NOx/NO2 concentrations, and the results are shown in Fig. 6. NOx (NO2) mixing ratios at a height of 30 cm were always lower than those at heights of 3.0 and 1.5 cm (except around 13:00). During 12:00–14:00, when the UVB radiation levels were high but wind speeds were low, the differences in the NOx (NO2) level at heights of 1.5 and 3.0 cm were greater than those at other times. On an average, the mixing ratios of NOx (NO2) at heights of 1.5, 3.0, and 30 cm were 0.38 (2.28), 0.44 (0.28), and 0.33 (0.25) ppbv, respectively. These results indicated a decreasing trend of NOx (NO2) concentration with height; that is, the concentrations near the ground were higher than those at a height of 30 cm, which further indicated that the source of NOx (NO2) was sunlit snow or ice. The gradients were significantly higher than those observed in Antarctica,32 where a difference of only several parts per trillion (pptv) was observed at a height difference of 2.5 m.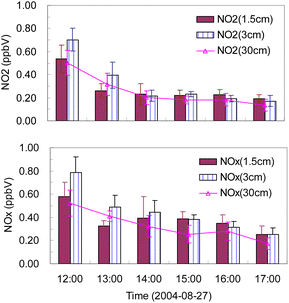 | ||
| Fig. 6 Variations in NOx and NO2 mixing ratios at different heights (the error bar is 1 standard deviation). | ||
4 Discussion
Surface albedo can considerably contribute to UV radiation over the snow/ice surface. The measured values of albedo were lower than those of ultraviolet albedos (0.70–0.90) over the fresh snow surface.25–27 Furthermore, the particle size and moisture content of the snow affected the glacier albedo. Glaciers melt during the summer. The melting of the snow crystals under higher temperatures during the daytime increases the water content. During the night, when the temperature drops, the recrystallization effect causes increases in the particle size of snow, thereby reducing the albedo. Another important factor was the deposition of sand and dust (Fig. S2†), which blow from surrounding barren mountains as a result of strong winds, making the snow dirty and leading to easy absorption of solar radiation, causing the snow particles to melt and the water content to increase, thus reducing the UV albedo.As stated above, the measured UVB values were higher than the simulated values even when the surface albedo value was set at 0.9, which can be only found in fresh snow. Albedo is not the only factor to enhance the surface UV radiations. In the Tibetan Plateau, studies have shown high surface solar radiation in summer at values frequently higher than the solar constant owing to the overhead cloud reflection.33–35 Although multiple reflections on the cloud overhead might lead to an increase in the ground UVB radiation level, the measurement values on clear and cloudless days (27 and 29 August) were considerably higher than the simulated values. A complex terrain might be one of the biggest influencing factors. Qiyi Glacier is a valley-shaped glacier, and UVB radiation was observed at a gently sloping mountainside. This might collect strong solar radiation as a result of reflection by the snow covering mountain peaks, resulting in high radiation levels recorded by the instrument. Therefore, model challenges will be faced in simulating the solar radiations over a mountain-valley-shaped glacier surface.
O3 data were not available during observation because of the instrument malfunction. However, other observations36–38 have confirmed that the background O3 mixing ratio in the Tibetan Plateau is high (the hourly mean can be as high as 100 ppbv and the monthly mean can be as high as >60 ppbv) due to its high altitude. During the daytime of 28 and 29 August, the relative humidity measured using an Assmann ventilation dry and wet meter was 61–94%, with a water vapor density of 2.1–4.6 g m−3. Additionally, strong UV radiation and abundant water vapor promoted the OH radical generation through O3 photolysis, which might indicate that glacier surface air has a high oxidizing capacity.
| O3 + hv (λ ≤ 330 nm) → O (1D) + O2 | (1) |
| O (1D) + H2O → 2OH | (2) |
The concentrations of NO3− and NH4+ in the snow samples were much higher than those in the water samples, in which NO3− and NH4+ in the water samples were difficult to detect. This phenomenon might indicate a quick loss of NO3− during the melting process under sunlight. However, we only collected a limited number of water samples, and therefore it was difficult to determine whether this phenomenon was universal.
Strong correlations were observed between the NOx (NO2) mixing ratios and UVB radiation levels obtained from Qiyi Glacier, Tibetan Plateau. The correlations were much more important than the findings in the North and South Pole regions, where no such direct and strong correlations were reported. Moreover, the mixing ratios of NOx released by fresh snow in Qiyi Glacier in late August reached up to several parts per billion (ppbv), approximately 1 order of magnitude higher than those observed in the polar region. This observation provides direct evidence to support the hypothesis that the concentrations of NOx released on the glacier surface of the Tibetan Plateau are higher than those in the Antarctic and Arctic regions. Due to the limited covering areas of mountain-valley glaciers, which are less than the huge covering areas in Antarctic and Arctic regions, the photochemical generation NOx left from the snowpack in the Tibetan Plateau might be easier to be transported to somewhere else by advection and hardly return to the snow by deposition through the reaction between NOx and HOx to form HNO3 and HO2NO2,2,39–41 resulting in the loss of nitrogen in the snow. High levels of NOx release certainly affect atmospheric chemical processes in the boundary layer of highland glaciers and snow surfaces as well as the conversion equation of snow/ice records to real atmospheric concentrations.
5 Conclusions
In late August, the surface UVB radiation level at 4600 m asl in Qiyi Glacier reached >4.5 W m−2 and was enhanced by the strong reflection of snow/ice and clouds against the Sun, which was strengthened by the topographical effect. At Qiyi Glacier, a clear phenomenon of dust/sand deposition exists, which helps to absorb sunlight, promotes the melting of ice and snow, increases air humidity, and reduces the surface albedo. The average concentration (±1σ) of NO3− in 10 snow samples was 8.7 ± 2.7 μmol L−1, but NO3− was barely detected in three melting snow (water) samples.Very strong correlations were observed between the NOx (NO2) mixing ratios and UVB radiation levels obtained from Qiyi Glacier, Tibetan Plateau. Vertical experiments showed a negative gradient of NOx (NO2) mixing ratios from the glacier snow surface to a height of 30 cm. Moreover, the mixing ratios of NOx released by fresh snow in Qiyi Glacier in late August reached up to several parts per billion (ppbv). This might be due to strong UV radiation and much higher NO3− concentrations in snow/ice in the Tibetan Plateau compared to that in Antarctic and Arctic regions. Further in-depth studies are needed to assess the effect of such high levels of NOx release on the atmospheric chemical processes in the boundary layer of highland glaciers and snow surfaces.
Author contributions
WL and TZ designed the research plan. WL, FW, and TZ carried out the observation. CY contributed to the idea of data analysis. WL wrote the manuscript with scientific input from all co-authors.Conflicts of interest
The authors declare that they have no conflicting interests.Acknowledgements
This study was funded by the National Natural Science Foundation of China (49925513, 21876214, 91744206, 42375088).References
- R. E. Honrath, M. C. Peterson, S. Guo, J. E. Dibb, P. B. Shepson and B. Campbell, Geophys. Res. Lett., 1999, 26, 695–698 CrossRef.
- R. E. Honrath, Y. Lu, M. C. Peterson, J. E. Dibb, M. A. Arsenault, N. J. Cullen and K. Steffen, Atmos. Environ., 2002, 36, 2629–2640 CrossRef.
- D. Davis, J. B. Nowak, G. Chen, M. Buhr, R. Arimoto, A. Hogan, F. Eisele, L. Mauldin, D. Tanner, R. Shetter, B. Lefer and P. McMurry, Geophys. Res. Lett., 2001, 28, 3625–3628 CrossRef.
- A. E. Jones, R. Weller, E. W. Wolff and H. W. Jacobi, Geophys. Res. Lett., 2000, 27(3), 345–348 CrossRef.
- F. Dominé and P. B. Shepson, Science, 2002, 297, 1506–1510 CrossRef.
- F. Wang, W. Lin, J. Wang and T. Zhu, Adv. Clim. Change Res., 2011, 2(3), 141–148 CrossRef.
- S. Preunkert, D. Wagenbach and M. Legrand, J. Geophys. Res.: Atmos., 2003, 108(D21), 4681, DOI:10.1029/2003JD003475.
- J. W. Bottenheim, J. E. Dibb, R. E. Honrath and P. B. Shepson, Atmos. Environ., 2002, 36, 2467–2469 CrossRef.
- B. V. Dam, D. Helmig, C. Toro, P. Doskey, L. Kramer, K. Murray, L. Ganzeveld and B. Seok, Atmos. Environ., 2015, 123, 268–284 CrossRef.
- J. Bock, J. Savarino and G. Picard, Atmos. Chem. Phys., 2016, 16, 12531–12550 CrossRef.
- H. G. Chan, M. M. Frey and M. D. King, Atmos. Chem. Phys., 2018, 18(3), 1–40 CrossRef.
- R. E. Honrath, M. C. Peterson, M. P. Dziobak, J. E. Dibb, M. A. Arsenault and S. A. Green, Geophys. Res. Lett., 2000, 27, 2237–2240 CrossRef.
- C. S. Boxe, A. J. Colussi, M. R. Hoffmann, D. Tan, J. Mastromarino, A. T. Case, S. T. Sandholm and D. D. Davis, J. Phys. Chem. A, 2003, 107, 11409–11413 CrossRef.
- H. W. Jacobi and B. Hilker, J. Photochem. Photobiol., A, 2007, 185(2–3), 371–382 CrossRef CAS.
- J. E. Dibb, M. Arsenault, M. C. Peterson and R. E. Honrath, Atmos. Environ., 2002, 26, 2501–2511 CrossRef.
- F. Domine, J. Bock, D. Voisin and D. J. Donaldson, J. Phys. Chem. A, 2013, 117(23), 4733–4749 CrossRef.
- K. J. Morenz and D. J. Donaldson, J. Phys. Chem. A, 2017, 121(10), 2166–2171 CrossRef.
- S. N. Wren and D. J. Donaldson, J. Phys. Chem. Lett., 2011, 2, 1967–1971 CrossRef.
- T. Bartels-Rausch, H. W. Jacobi, T. F. Kahan, J. L. Thomas, E. S. Thomson, J. P. D. Abbatt, M. Ammann, J. R. Blackford, H. Bluhm, C. Boxe, F. Domine, M. M. Frey, I. Gladich, M. I. Guzmán, D. Heger, T. Huthwelker, P. Klán, W. F. Kuhs, M. H. Kuo, S. Maus, S. G. Moussa, V. F. McNeill, J. T. Newberg, J. B. C. Pettersson, M. Roeselová and J. R. Sodeau, Atmos. Chem. Phys., 2014, 14, 1587–1633 CrossRef.
- S. Chen, X. Zheng, W. Lin, Y. Zhang, D. Zaxi and D. Qi, J. Appl. Meteorol. Sci., 2015, 26(4), 482–491 Search PubMed.
- W. Lin, T. Zhu, Y. Song, H. Zou, M. Tang, X. Tang and J. Hu, J. Geophys. Res.: Atmos., 2008, 113, D02309, DOI:10.1029/2007JD008831.
- Z. Li, J. Sun, S. Hou, L. Tian and B. Liu, Glaciochemistry and its environmental significance, Glaciers and Their Environments in China - the Present, Past and Future, ed. Y. Shi, Science Press, Beijing, China, 2000, vol. 132–160 Search PubMed.
- C. Xiao, D. Qin, J. Ren, Z. Li and X. Wang, J. Glaciol. Geocryol., 2002, 14(5), 492–499 Search PubMed.
- X. Zheng and H. Chen, J. Appl. Meteorol. Sci., 2020, 31(4), 482–493 Search PubMed.
- M. Blumthaler and W. Ambach, Photochem. Photobiol., 1988, 48(1), 85–88 CrossRef PubMed.
- W. L. Chen, Plateau Meteorol., 1995, 14(1), 102–106 Search PubMed.
- U. Feister and R. Grewe, Photochem. Photobiol., 1995, 62(4), 736–744 CrossRef.
- B. Ridley, J. Walega, D. Montzka, F. Grahek, E. Atlas, F. Flocke, V. Stroud, J. Deary, A. Gallant, H. Boudries, J. Bottenheim, K. Anlauf, D. Worthy, A. L. Sumner, B. Splawn and P. Shepson, J. Atmos. Chem., 2000, 36, 1–22 CrossRef.
- D. Davis, G. Chen, M. Buhr, J. Crawford, D. Lenschow, B. Lefer, R. Shetter, F. Eisele, L. Mauldin and A. Hogan, Atmos. Environ., 2004, 38, 5375–5388 CrossRef.
- C. S. Boxe, A. J. Colussi, M. R. Hoffmann, J. G. Murphy and R. C. Cohen, J. Phys. Chem. A, 2005, 109(38), 8520–8525 CrossRef CAS.
- Y. Dubowski, A. J. Cloussi and M. R. Hoffman, J. Phys. Chem. A, 2001, 105, 4928–4932 CrossRef CAS.
- A. E. Jones, R. Weller, P. S. Anderson, H. W. Jacobi, E. W. Wolff, O. Schrems and H. Miller, Geophys. Res. Lett., 2001, 28, 1499–1502 CrossRef CAS.
- Y. Kou, Q. Zeng, W. Xie and Y. Xie, Solar radiation over Mt. Qomolangma Region, in Report of Scientific Research over Mt. Everest Region 1966-1968 (Weather and Solar Radiation), edited by Tibetan Scientific Research Team of Chinese Academy of Science, Science Press, Beijing, China, 1975, vol. 118–132 Search PubMed.
- P. B. C. Ren, Y. Gjessing and F. Sigernes, J. Atmos. Sol.-Terr. Phys., 1999, 61, 425–446 CrossRef CAS.
- C. Li, Y. Gong, T. Duan, Y. Zhu, L. Chen and W. Li, J. Chengdu Institute Meteorol., 2000, 15(2), 107–112 Search PubMed.
- T. Zhu, W. Lin, Y. Song, X. Cai, H. Zou, L. Kang, L. Zhou and H. Akimoto, Geophys. Res. Lett., 2006, 33, L23809, DOI:10.1029/2006GL027726.
- W. Lin, X. Xu, X. Zheng, J. Dawa, C. Baima and J. Ma, J. Environ. Sci., 2015, 31, 133–145 CrossRef CAS PubMed.
- W. Xu, W. Lin, X. Xu, J. Tang, J. Huang, H. Wu and X. Zhang, Atmos. Chem. Phys., 2016, 16, 6191–6205 CrossRef.
- S. P. Oncley, M. Buhr, D. H. Lenschow, D. Davis and S. R. Semmer, Atmos. Environ., 2004, 38, 5389–5398 CrossRef.
- L. Cohen, D. Helmig, W. Neff, A. A. Grachev and C. W. Fairall, Atmos. Environ., 2007, 41(24), 5044–5060 CrossRef.
- J. W. Munger, D. J. Jacob, S. M. Fan, A. S. Colman and J. E. Dibb, J. Geophys. Res., 1999, 104, 13721–13734 CrossRef.
Footnote |
| † Electronic supplementary information (ESI) available. See DOI: https://doi.org/10.1039/d3ea00161j |
| This journal is © The Royal Society of Chemistry 2024 |

