 Open Access Article
The formation and transport of HNO3 over the Yellow Sea and its impact on the January 2018 PM2.5 episode in Seoul†
Hyeon-Yeong
Park
 ad,
Joon-Young
Ahn
b,
Sung-Chul
Hong
c,
Jae-Bum
Lee
c and
Seog-Yeon
Cho
 *ad
*ad
aDepartment of Environmental Engineering, Inha University, Incheon, 22212, Republic of Korea. E-mail: hypark96@inha.ac.kr; sycho@inha.ac.kr
bClimate and Air Quality Research Department, National Institute of Environmental Research (NIER), Incheon, 22689, Republic of Korea. E-mail: nierair@korea.kr
cAir Quality Forecasting Center, National Institute of Environmental Research (NIER), Incheon, 22689, Republic of Korea. E-mail: schong@korea.kr; gercljb@korea.kr
dParticle Pollution Research and Management Center, Inha University, Incheon, 21999, Republic of Korea
First published on 10th May 2024
Abstract
The formation of HNO3 gas over the Yellow Sea and its impact on particulate nitrate concentrations in Seoul during the PM2.5 episode in Seoul in January 2018 were studied by analyzing monitoring data and running WRF-CMAQ model simulations. Monitoring data showed that particulate nitrate made up 41% of the PM2.5 during the episode, 2.7 times more than in other periods, and its level was strongly correlated with PM2.5 mass, indicating that the particulate nitrate is the primary cause of the episode. During the episode, eastern China was in slight to moderate ammonia-rich conditions and Seoul had slight ammonia-rich conditions. In contrast, severe ammonia-lean conditions prevailed in the Yellow Sea. Despite the decline of solar radiation at night, the production rate of HNO3 in the Yellow Sea still increased slightly due to the higher nocturnal ozone levels compared to the daytime. On the other hand, it decreased in eastern China and western Korea during the night as O3 dissipated by NO titration, resulting in the conversion rates of NO2 to HNO3 in the Yellow Sea being several times higher than those in eastern China and western Korea. The HNO3 gas formed in the Yellow Sea was transported to Seoul under westerly winds, contributing to particulate nitrate formation. Furthermore, the rate of formation of HNO3 gas in the Yellow Sea was 65% higher than that in Seoul during the night, which indicated that the regional influence dominated the local influence in determining the particulate nitrate concentrations in Seoul.
Environmental significanceParticulate nitrate is a significant contributor to severe PM2.5 pollution in Seoul. This paper focuses on forming HNO3 and nitrate during the wintertime PM2.5 pollution in Seoul. During the PM2.5 episode, abundant HNO3 was produced in the Yellow Sea, and the westerlies moved the HNO3 to the land of Korea, forming the particulate nitrate by reacting with NH3 in Korea. The CMAQ model was used to examine the formation of HNO3 in the Yellow Sea and compare it to that in the land of China and Korea. The results of the study emphasize the impact of the Yellow Sea on PM2.5 events in western Korea and the need for monitoring of gaseous precursors of PM2.5 over the Yellow Sea. |
1. Introduction
In recent years, Korea has experienced serious PM2.5 (particulate matter with an aerodynamic diameter of 2.5 μm or less) pollution episodes from winter until the onset of spring. These pollution events are attributed to the secondary inorganic aerosol (SIA), comprising particulate sulfate, particulate nitrate, and particulate ammonium.1 Until the mid-1990s, sulfur dioxide (SO2) was the most abundant acid precursor in Korea, making sulfate the predominant acidic species.2 Since then, the SO2 emissions have been greatly reduced by stringent governmental measures. In contrast, nitrogen oxide (NOx) emissions have steadily increased until recently due to the increase of mobile sources, making nitrate the predominant SIA species in Korea.1,3–5 During the winter to early spring period in Seoul, when the ambient temperatures are cool and westerly winds prevail, nitrate levels significantly rise, resulting in severe PM2.5 pollution.1,6 At cool temperatures, the equilibrium reaction of “NO2 + NO3 → N2O5” is shifted toward N2O5 (dinitrogen pentoxide), leading to the formation of nitrate via hydrolysis during the night.7 Under westerly winds, PM2.5 and its gaseous precursors from high-emission areas in China are transported to western cities in Korea including Seoul. Being transported, NO2, one of the PM2.5 precursors, is oxidized to form HNO3 to raise particulate nitrate concentrations in Seoul.Lee et al. (2019) conducted a WRF-CMAQ model simulation with sensitivity analysis and showed that transboundary transport accounted for nearly 80% of the PM2.5 concentrations during the early spring PM2.5 episode that occurred in 2019.6 The CMAQ-WRF model was also applied to study the impact of transboundary HNO3 gas on ground-level nitrate concentrations and nocturnal nitrate formation processes.1,8 These previous works focused on the formation and transport of nitrate in land areas, where a large amount of NH3 and NO2 are emitted. However, very few studies have been performed concerning the role of the Yellow Sea in the formation and transport of nitrate. The Yellow Sea, with a width of 400–700 km, lies between eastern China and Seoul, thus air masses traveling from eastern China to Korea usually traverse it. The NH3 gas is barely present in the Yellow Sea due to near-zero emissions as well as high dry deposition velocities, and therefore the HNO3 formed in the Yellow Sea stays as HNO3 without being converted to nitrate. When this HNO3 gas is transported to the western coastal cities of Korea, it quickly reacts with NH3 gas emitted from the land and is transformed into particulate nitrate.
Unlikely to lands, HNO3 gas and particulate nitrate coexist over the Yellow Sea, necessitating the inclusion of HNO3 gas to adequately address the secondary formation and transport of PM2.5. In the Yellow Sea, the HNO3 is mostly locally produced, whereas the particulate nitrate is mostly transported from the nearby lands. However, HNO3 measurement and analysis were rarely conducted in previous studies of the Yellow Sea.9–11 The goal of the present work is to evaluate the contribution of HNO3 production over the Yellow Sea to the PM2.5 concentration in the western coastal cities of Korea during a multi-day PM2.5 episode. The WRF-CMAQ model was employed to model the transport/chemistry/dry deposition with a focus on HNO3 formation over the Yellow Sea. Previous modeling works often over-predicted the PM2.5 nitrate concentrations in Seoul,1 North East Asia,12,13 and the United States.14 Anttila et al. (2006) proposed that an organic layer coats the aerosol core and inhibits nocturnal nitrate formation.15 We incorporated Anttila et al. (2006)'s organic coating theory15 into the CMAQ model to reduce the overprediction of nitrate concentrations. Cross-sectional plots of HNO3 gas, NH3 gas, and particulate nitrate across the Yellow Sea were made to compare the HNO3 gas-to-particulate nitrate ratios in the Yellow Sea with those in the neighboring lands and more importantly to estimate the contribution of HNO3 gas formed in the Yellow Sea to particulate nitrate levels in Seoul. We also calculated the rates of HNO3 formation in the study area by the CMAQ utility tool named IRR (Integrated Reaction Rate) and found that the rates of formation of HNO3 in the Yellow Sea were significantly higher than those in Korea in the nighttime of the episode, indicating the regional influence on nitrate dominated over the local production.
2. Methods
2.1. Study areas and periods
Seoul, the capital of South Korea, has a population of 10 million and is the biggest metropolis in Korea, located in the northwest of the country. Korea suffered severe PM2.5 pollution in 2018 and 2019, recording the most frequent PM2.5 advisory issued. Seoul Metropolitan Area (SMA) led the nation in the number of PM2.5 advisories in 2018 and 2019. Therefore, Seoul was selected as a study area for the present work.PM2.5 advisory is issued when an hourly PM2.5 concentration exceeds 75 μg m−3 in two consecutive hours. While most PM2.5 advisories were lifted in less than 24 hours, a few PM2.5 advisories lasted more than two days. The multi-day advisory has been seen to lead to more severe health impacts, causing more stringent PM2.5 regulations. The multi-day PM2.5 advisories were issued three times in Seoul in 2018 and 2019 as listed in Table 1. The meteorological variables of these episodes share common characteristics: cool temperatures, light air, and westerly winds. In this study, we chose the multi-day advisory event in January 2018 to represent a wintertime PM2.5 episode.
| Noon, Jan. 16 – 3 PM, Jan. 18, 2018 | Noon, Jan. 12 – 5 PM, Jan. 15, 2019 | 4 PM, Feb. 28 – 6 AM, Mar. 7, 2019 | |
|---|---|---|---|
| Temperature (°C) | 4.1 | 1.5 | 8.2 |
| Relative humidity (%) | 63.7 | 59.4 | 47.7 |
| Wind speed (m s−1) | 1.3 | 1.5 | 1.8 |
| Prevalent wind direction | WNW | WNW | WNW |
2.2. Model configuration
The Global to Mesoscale Air Quality Forecast and analysis system (GMAF) developed by Cho et al. (2021) was used in this study.16 The GMAF uses the Weather Research and Forecasting (WRF) model version 3.6 (ref. 17) as a numerical weather prediction model and Community Multiscale Air Quality (CMAQ) model version 5.3.1 (ref. 18) as an air quality forecasting model. The 3rd release of the carbon bond version 6 mechanism (CB6r3) was used as a gas-phase chemical mechanism, and the AERO7 module as an aerosol dynamic model in the CMAQ. The CMAQ was modified to incorporate Slinn (1983)'s semi-empirical formula19 for accurate estimation of the below-cloud scavenging coefficient and to optimize the parameters determining the formation of SOA from combustion emissions. Detailed descriptions of the CMAQ modification and the physical parameterization options selected for the WRF were presented in our previous works.16,20 Global analysis and forecast data were imported to generate initial and boundary conditions and a grid nudging-based Four-Dimensional Data Assimilation (FDDA) for the CMAQ as well as WRF was carried out; the National Centers for Environmental Prediction (NCEP) Final (FNL) operational global analysis data with 0.25° grid resolution was used for the WRF and the Copernicus Atmosphere Monitoring Service (CAMS) forecast and reanalysis system with 0.4° grid resolution from European Centre for Medium-range Weather Forecasts (ECMWF) for the CMAQ.As shown in Fig. 1(a), the model domain covers the Korean peninsula, China, parts of Russia, and Japan. And 391 × 288 horizontal grids with 12 km uniform spacing were used to adequately simulate the transport and chemical reaction of air pollutants over the Yellow Sea. In the previous works,1,16,21 a nested grid system was utilized to increase the grid resolution in the area of focus without significantly increasing the processing time. Since the nested grid system tends to have large errors at the borders of the enclosed area which is usually situated in the middle of the Yellow Sea, we opted for a uniform grid system for this study. To examine the characteristics of PM2.5 formation according to land uses as described in Section 3.5, we designated three study areas, the China sub-area, the Yellow Sea sub-area, and the Korea sub-area as illustrated in Fig. 1(a). The China sub-area and the Yellow Sea sub-area are located in the upwind direction from Korea during the chosen PM2.5 episode. The China sub-area represents an industrial area with a large NOx emission, while the Yellow Sea sub-area is a sea area. Korea sub-area is western Korea, having an elevated PM2.5 concentration in the chosen PM2.5 episode.
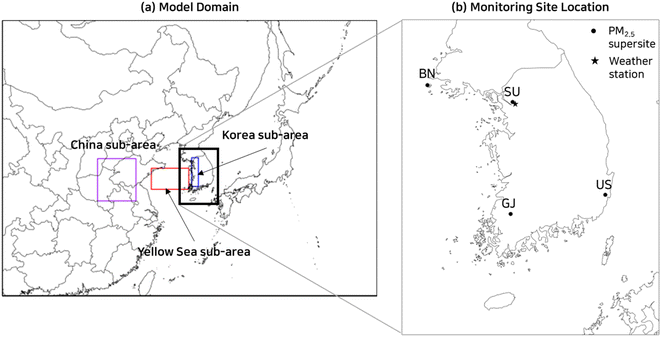 | ||
| Fig. 1 Model domain (a) and locations of weather stations in SU and PM2.5 supersites in BN, SU, GJ, and US (b). | ||
We used the inventories for anthropogenic emissions in our previous works,16,22 which were constructed from 2017 Multi-resolution Emission Inventory for China (MEIC)23,24 (http://www.meicmodel.org), 2018 Clean Air Policy Support System (CAPSS) emission inventory for South Korea, and Korea-United States Air Quality study (KORUS-AQ) anthropogenic emission inventory version 2.1 for the rest of region. Biogenic emissions were generated by using the Model of Emissions of Gases and Aerosols from Nature (MEGAN) version 2.1.25
2.3. Monitoring methods
PM2.5 mass and particulate species concentrations measured in the Korean PM2.5 supersites were used in this work. The selected PM2.5 supersites are Seoul (SU), Baengnyeong (BN), Gwangju (GJ), and Ulsan (US), marked by circle in Fig. 1(b). The SU site is located in northern Seoul. The BN site is a remote site located in the upwind region of Seoul, and the GJ site is an urban site located 120 km South of the SU site. The US site is also an urban site located in the downwind region of Seoul. In addition, meteorological data including wind speeds and directions monitored by the national weather station in Seoul as marked by an asterisk in Fig. 1(b) were also used.The PM2.5 mass concentration was measured by the beta-attenuation monitor (BAM1020, MetOne Instrument Inc., USA). The measured particulate species include carbonaceous materials, particulate ionic species, and trace elements. Among these particulate species, particulate ionic species including sulfate, nitrate, and ammonium are directly related to nitric acid gases, and therefore their monitoring method is briefly discussed below. The particulate ionic species were measured by an ambient ion monitor (AIM, URG9000D, URG Corporation). AIM is equipped with a PM2.5 sharp-cut cyclone inlet to separate fine PM and a liquid diffusion denuder to remove acid and alkaline gases. The gas stream exiting the denuder was fed to the super-saturated steam chamber to promote particle growth. Grown particles were collected by an inertial impactor and then fed to an ion chromatography instrument (http://www.urgcorp.com).
2.4. Chemistry of HNO3 gas and particulate nitrate
HNO3 gas reacts with NH3 gas via a thermodynamic equilibrium reaction to produce particulate ammonium nitrate (reaction (R0)), and this equilibrium reaction is influenced by the ambient temperature and humidity. The forward reaction of equilibrium reaction (R0) is favored at cool and moist conditions, thus forming ammonium nitrate. However, dry and warm conditions will cause the backward reaction to take place, breaking down the ammonium nitrate into its gaseous components.| NH3 (g) + HNO3 (g) ⇄ NH4NO3 (a) | (R0) |
| NO2 (g) + OH (g) + M (g) → HNO3 (g) + M (g) | (R1) |
During the night, photochemically-induced radicals including OH and HO2 concentrations decline rapidly, whereas nitrate radical (NO3) rises as the photolysis of NO2 and NO3 discontinues. This enriched NO3 reacts with VOC including aldehydes, alkene, glyoxal, peroxy-radical, cresol, aromatic, nitro-cresols, and methyl catechols to form HNO3 as outlined in reaction (R2).
| NO3 (g) + VOC (g) → HNO3 (g) + products | (R2) |
Moreover, NO3 undergoes a chemical equilibrium denoted as reaction (R3) to form N2O5, which is then hydrolyzed into HNO3 through reactions (R4) and (R5), thus terminating the NO3 radical. The equilibrium constant of reaction (R3) increases with decreasing ambient temperature to increase N2O5 concentration and to facilitate N2O5 hydrolysis (reactions (R4) and (R5)). The N2O5 hydrolysis reactions dominate over direct NO3 radical reaction (reaction (R2)) in cool temperatures.
| NO2 (g)+ NO3 (g) ⇄ N2O5 (g) | (R3) |
| N2O5 (g) + H2O (g) → 2HNO3 (g) | (R4) |
| N2O5 (g) +H2O (a) → 2HNO3 (g) | (R5) |
The heterogeneous hydrolysis rate (reaction (R5)) was reported to far exceed the homogeneous hydrolysis rate (reaction (R4)).26 IUPAC (International Union of Pure and Applied Chemistry) evaluated an upper limit for the homogeneous hydrolysis reaction rate coefficient as 1 × 10⁻²² cm3 per molecule per seconds. The computationally estimated rate coefficient of reaction (R4) by Alecu and Marshall (2014) is over a million times lower at the temperature of 273.15 K.27 Our numerical experiments demonstrated that the homogeneous hydrolysis is significantly slower than the heterogeneous hydrolysis (reaction (R5)) even with the upper limit estimated by IUPAC. Therefore, we used the upper limit (1 × 10⁻²² cm3 per molecule per seconds) by IUPAC for the rate coefficient of reaction (R4). The heterogeneous hydrolysis rate (reaction (R5)) was estimated by integrating Anttila et al. (2006)'s organic coating theory15 into the CMAQ model. This theory proposes that the presence of an organic coating around the aqueous aerosol core inhibits the N2O5 uptake and the subsequent formation of HNO3.15,28
HNO3 may also be formed by hydrolysis of organic nitrates NTR2, multi-functional organic nitrate.29
| NTR2 (a) + H2O (a) → HNO3 (a) | (R6) |
| ClO (g) + NO2 (g) → ClNO3 (g) | (R7) |
| ClNO3 (g) + H2O (a) → HNO3 (a) + HOCL (g) | (R8) |
2.5. Process analysis tool of CMAQ
The CMAQ implements process analysis tools, which provide rate information on individual atmospheric processes or individual chemical reactions. Among the analysis tools provided, we utilized IRR analysis, which estimates the contributions of individual chemical reactions including those leading to HNO3 production. IRR calculates the production rate for a given reaction on every grid cell during each time step, which may be integrated over space and time as needed: | (1) |
PRODj(HNO3) denotes the molar production rate of HNO3 by chemical reaction j. “A” at the lower part of the integration symbol is the area of interest and “p” is the time duration of interest. We selected three areas, the China sub-area, the Yellow Sea sub-area, and the Korea sub-area, as shown in Fig. 1(a). We used IRR to evaluate the pathways (reactions (R1), (R2), (R4), (R5), (R6), and (R8)) leading to HNO3 production and to estimate the HNO3 production rate at each sub-area. IRR was also used to estimate the rate of conversion of NO2 to HNO3 (CR), defined by
 | (2) |
In addition, we utilized IPR (Integrated Process Rate) analysis to estimate HNO3 production and loss rates by physical processes of dry deposition, chemical production, and aerosol process (nitrate formation) in the sub-areas of China, Yellow Sea, and Korea. The quantitative HNO3 production and loss rates by those physical processes were calculated by eqn (3).
 | (3) |
PROCi(HNO3) means the molar production or loss rate of HNO3 by physical process i. “A” and “p” are the area of interest and the time duration of interest, referred in above. “z” denotes a vertical height in the model.
3. Results and discussion
3.1. Monitoring results
Fig. 2 shows hourly concentrations of PM2.5 and its chemical compositions in January 2018 observed at the SU site. “KST” in the figure stands for the Korean Standard Time. The PM2.5 concentration increased slightly for the first eight days in January and decreased for the next five days. It increased to 60 μg m−3 at 3 PM on January 13 and stayed at that level for a day. After a brief intermission on January 15, it rose back up and exceeded 75 μg m−3 for 51 hours, which was marked as an “episode” in Fig. 2. And it spiked above 75 μg m−3 at 3 PM on January 20 to have another episode, which was short, named as an “episode-S”. We chose the period during which PM2.5 concentration was below 35 μg m−3 as a control period and marked it as “non-episode” in Fig. 2. The particulate nitrate had a strong correlation with PM2.5 (R2 > 0.92), suggesting that particulate nitrate is a probable cause of the episode. | ||
| Fig. 2 PM2.5 mass and particulate species concentrations measured at the SU supersite in January 2018. | ||
As shown in Fig. 3, particulate nitrate was the predominant aerosol species in the PM2.5, accounting for 41% during the episode, while organic matter (OM) accounted for 46% in the PM2.5 during the non-episode. During the episode, the percent of particulate nitrate and ammonium rose twofold compared with the non-episode, whereas the percent of particulate sulfate rose only by 30%. This twofold increase in the percent of particulate nitrate and ammonium during the episode led to a twofold decrease in the proportion of organic matter (OM).
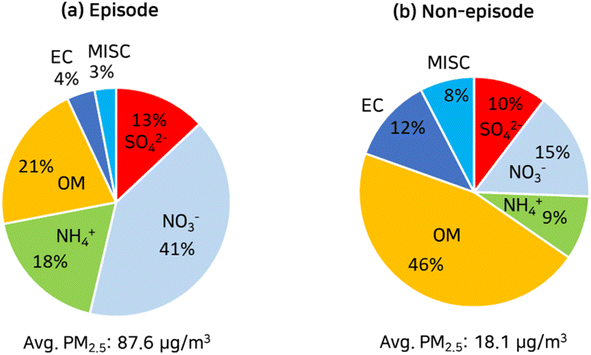 | ||
| Fig. 3 Mass fractions of PM2.5 chemical compositions measured at the SU supersite during the episode (a) and non-episode (b) in January 2018. | ||
Fig. 4 compares temporal variations of PM2.5 mass, particulate nitrate, and NO2 concentrations at the SU, the BN, the GJ, and the US sites in January 2018. As shown in Fig. 4(a), all two PM2.5 episodes (episode and episode-S in Fig. 2) were observed at SU, BN, GJ, and US sites with different time lags. Here, the time lag was defined as a difference between the time of PM2.5 concentration exceeding 75 μg m−3 in the SU site and that in another site associated with the PM2.5 episode in the SU site. The PM2.5 concentrations at the BN site, located 200 km away in an upwind direction from the SU site, exceeded 75 μg m−3 14 hours before the SU site in the episode. Similarly, there was an 18 hour time difference between the BN and the SU sites for the episode-S. The GJ and US sites, situated 250 km and 310 km away from the SU site in a downwind direction, had 69 hour and 67 hour delays of the episode, and they had 18 hour and 16 hour delays of the episode-S, respectively. The much longer time lag between the SU site and the GJ, US sites during the episode might be due to the slower wind speed in the SU site during the episode than that during the episode-S. The wind speed in the SU site was 0.3–1.4 m s−1 during the middle of the episode, making stagnant condition, and it kept PM2.5 concentration in the SU site for a longer time compared to the case of episode-S. While the wind speed in the SU site during the middle of the episode-S was 1.8–3.2 m s−1. The peak PM2.5 concentrations in the episode decreased as it moved from the upwind site (BN site) to the downwind site (GJ site and US site). It seemed that regional transport was a major factor in the episode because the time lags and peak concentrations of PM2.5 were dependent on the upwind or downwind distances and wind velocities rather than the local emission strengths.
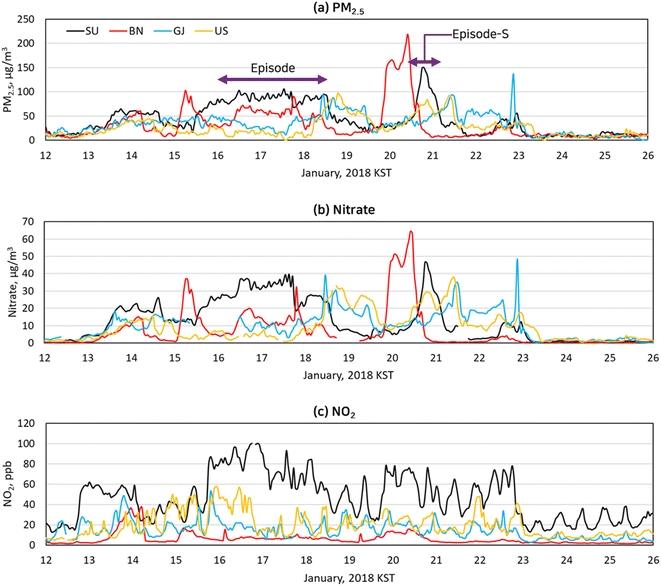 | ||
| Fig. 4 Hourly variations of PM2.5 (a), nitrate (b), and NO2 (c) concentrations monitored at the four selected PM supersites in January 2018. | ||
The particulate nitrate concentrations observed at the BN, the GJ, and the US sites, as shown in Fig. 4(b), were highly correlated with PM2.5 concentrations, similar to those at the SU site. The correlation coefficients R2 between nitrate concentrations and PM2.5 mass concentrations at the BN, GJ, and US sites were 0.95, 0.88, and 0.88, respectively, confirming the previous findings from Fig. 3: the particulate nitrate is the cause of the episode. Due to its high reactivity, NO2 is short-lived, making it a local air pollutant. As seen in Fig. 4(c), NO2 was the highest in the SU site due to large mobile emissions. Conversely, the BN site, located in a remote area, had the least amount of NO2. Although NO2 is one of the major nitrate precursors, the correlation between nitrate and NO2 was weak, with R2 values of 0.46 at the SU site, 0.32 at the BN site, 0.18 at the GJ site, and 0.06 at the US site, which indicates that locally emitted NO2 was not the primary contributor to the nitrate formation.
3.2. Comparison of the predicted concentrations with the observed concentrations
Our previous works examined the performances of the current implementation of the CMAQ and the WRF,16,20 and therefore in this work, we focused on performance review on meteorological and chemical parameters closely related to the PM2.5 episode, which included PM2.5, nitrate, NO2, and O3. Table 2 shows the model performance for predicting hourly wind speed, PM2.5, nitrate, NO2, and O3 concentrations with statistical metrics recommended by Emery et al. (2001; 2017): correlation coefficient (R), mean bias (MB), and root mean square error (RMSE) for wind speed, and R, normalized mean bias (NMB), and normalized mean error (NME) for PM2.5, nitrate, NO2, and O3.30,31 The formulae of these statistical metrics and their benchmarks for evaluation of model performance recommended by Emery et al. (2001; 2017) were shown in ESI.†30,31| R | MB | RMSE | |
|---|---|---|---|
| Wind speed | 0.74 | 0.5 m s−1 | 1.2 m s−1 |
| R | NMB | NME | |
|---|---|---|---|
| PM2.5 | 0.89 | −7.4% | 27% |
| Nitrate | 0.92 | 41% | 50% |
| NO2 | 0.82 | −17% | 29% |
| O3 | 0.77 | −22% | 35% |
The R of the wind speed was 0.74, meaning that the modeled wind speed was moderately correlated with the observation. The MB and RMSE of the wind speeds were 0.5 m s−1 and 1.2 m s−1, respectively. Both the MB and the RMSE were within the accuracy bounds set by Emery et al. (2001), which are 0.5 m s−1 for MB and 2 m s−1 for RMSE.31 The predicted hourly PM2.5 and nitrate concentrations were in close agreement with the observation, resulting in an R of 0.89 and 0.92. The performance statistics of daily averaged PM2.5 concentrations are better than those of hourly averages, the R, the NMB, and the NME being 0.95, −7%, and 19% respectively, thus meeting the QA goal set by Emery et al. (2017).30 Also, the R, the NMB, and the NME of daily averaged nitrate concentrations are 0.98, 40%, and 44%, respectively, satisfying QA goal and criteria from Emery et al. (2017).30 The R-value of the predicted hourly averaged concentrations of NO2 is 0.82, which is lower than PM2.5 but still deemed acceptable. The R of hourly O3 satisfied the goal set by Emery et al. (2017),30 although it was slightly lower than that of PM2.5, nitrate, and NO2. As a result, the model showed acceptable agreement with observations.
3.3. Calculated spatial distribution of selected chemical species concentrations
Monitoring data at the PM supersites indicated that nitrate was a major particulate species in Seoul in the episode. As described in Section 2.4, O3, OH, and NO3 oxidize NO2 to HNO3 (reactions (R1)–(R8)), and HNO3 is transformed into nitrate by equilibrium reactions with ammonia (reaction (R0)). Fig. 5 displays spatial distributions of ground-level NO2 and O3, the major precursor of nitrate and the major oxidant respectively, at the selected daytime and nighttime in the episode. Also presented are the wind velocity vectors. As seen in Fig. 5(a) and (b), a weak westerly or northwesterly wind of 1–4 m s−1 dominated the Yellow Sea and Korea. At 3 PM, Jan. 17 KST (daytime), a strong westerly wind of 10 m s−1 reigned in northern China, and a weak southwesterly wind prevailed in eastern China. By contrast, at 3 AM, Jan. 18 KST (nighttime) a weak wind blew in varying directions in northern and eastern China.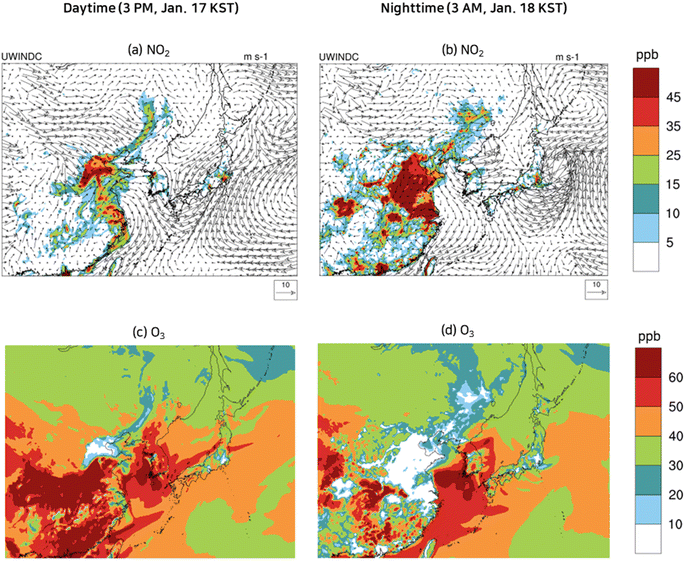 | ||
| Fig. 5 Wind velocity vectors and spatial variation of concentrations of NO2 (a and b) and O3 (c and d) at selected daytime and nighttime during the episode. | ||
Fig. 5(a) and (b) show that the NO2 concentrations were significantly high at 3 AM, Jan. 18 KST (nighttime), due to a low mixing height and a slow wind speed, when compared to the daytime (3 PM, Jan. 17 KST). NO2 is a local air pollutant due to its high reactivity; its concentrations were found to be significantly high in the industrial areas of northern China and eastern China, while near-zero concentrations were seen in the Yellow Sea. At 3 PM, Jan. 17 KST (daytime), a photochemical reaction between NO2 and VOCs caused the O3 concentrations to exceed 60 ppb in the industrial areas of China and Korea, as seen in Fig. 5(c). At 3 AM, Jan. 18 KST (nighttime), the O3 in the industrial areas was dissipated by strong NO emissions, whereas the O3 concentrations in the Yellow Sea remained virtually the same due to negligible NO emissions as depicted in Fig. 5(d). The O3 that remained high in the Yellow Sea during the night reacted with NO2 to produce NO3, which yielded HNO3via reactions (R3)–(R5).
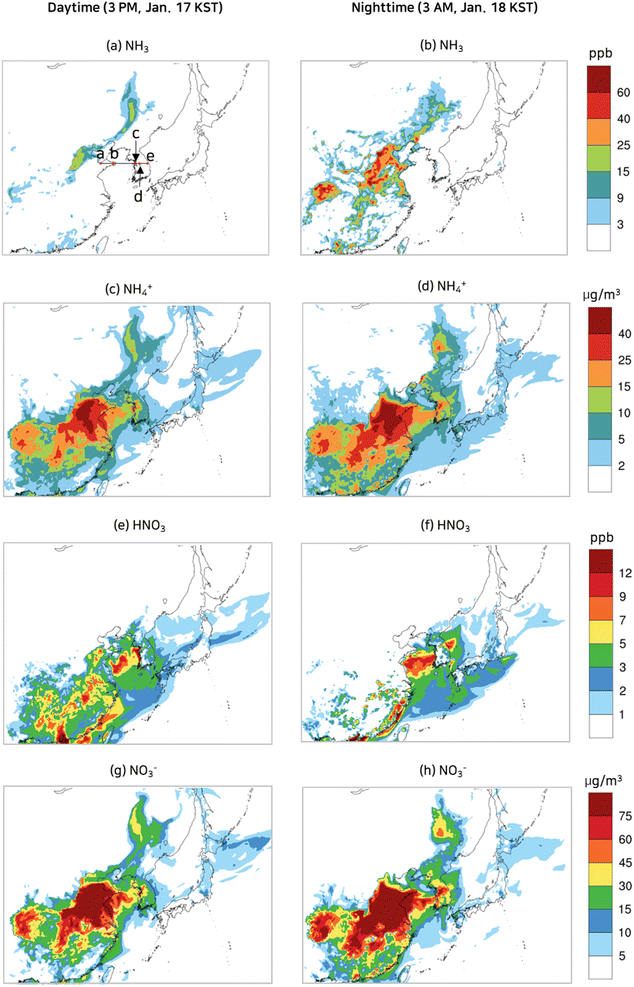
Fig. 6 displays spatial distributions of ground-level NH3 gas and HNO3 gas concentrations and their corresponding particulate species concentrations at the selected daytime and nighttime during the episode. In January, the temperatures in the model domain were cool enough to favor particulate nitrate or particulate ammonium over HNO3 gas or NH3 gas. Consequently, NH3 gas and HNO3 gas could not co-exist. In an NH3-rich atmosphere, NH3 continues to exist in the gas phase while HNO3 enters the particulate phase. Conversely, in an NH3-lean atmosphere, the reverse is true.
Being a primary pollutant, NH3 gas concentrations were higher at 3 AM, Jan. 18 KST (nighttime) than those at 3 PM, Jan. 17 KST (daytime) due to a lower mixing height at the nighttime as seen in Fig. 6(a) and (b). The elevated NH3 gas concentrations at 3 AM, Jan. 18 KST (nighttime) resulted in an NH3-rich condition in eastern, western, and northern China, leading to near zero HNO3 concentrations, as shown in Fig. 6(b). Conversely, at 3 PM, Jan. 17 KST (daytime), NH3 gas concentrations diminished due to rapid vertical mixing in eastern China, leading to an NH3 lean condition. In the Yellow Sea, NH3 emissions were near zero, inducing an NH3 lean condition. Fig. 6(c) and (d) highlighted an area of considerable particulate ammonium concentrations in eastern and central China. Owing to the insufficient NH3 gas in the Yellow Sea to form ammonium, it is evident that the particulate ammonium present in the Yellow Sea was being transported from China. Additionally, the particulate ammonium concentrations were slightly higher at 3 AM, Jan. 18 KST (nighttime) than those at 3 PM, Jan. 17 KST (daytime).
As shown in Fig. 6(e) and (f), HNO3 was significantly present at 3 PM, Jan. 17 KST (daytime), and then diminished at 3 AM, Jan. 18 KST (nighttime) on the following day in eastern and western China, thus confirming the findings of Fig. 6(a) and (b), which are NH3-lean at the daytime and NH3-rich at the nighttime. More importantly, the Yellow Sea, always in NH3 lean condition in the episode, has the highest HNO3 gas concentration at 3 AM, Jan. 18 KST (nighttime) as its abundant nocturnal O3 efficiently oxidized NO2 to form HNO3via reactions (R3)–(R5). The HNO3 formed in the Yellow Sea traversed across the Yellow Sea as HNO3 without being converted to nitrate because of the NH3-lean atmosphere in the Yellow Sea. Thus, it can be concluded that the majority of the HNO3 in the Yellow Sea was formed within the Yellow Sea itself, while the majority of the nitrate in the Yellow Sea was transported from nearby lands. The HNO3 gas which arrived at the coastal areas quickly reacted with NH3 emitted from nearby land and turned into particulate nitrate. As a result, the predicted nitrate concentrations in the coastal cities were higher than 40 μg m−3. A more detailed explanation of the contribution of HNO3 formed in the Yellow Sea to nitrate concentration in the coastal areas is presented in Sections 3.4 and 3.5.
To contrast the spatial distributions of the episode with those of the non-episode, the spatial distributions of NO2 and O3 at selected daytime and nighttime in the non-episode are presented in Fig. 7. The Yellow Sea and Korea were largely affected by a strong northerly wind with a speed of over 10 m s−1, while inland China was mainly exposed to a strong easterly wind as illustrated in Fig. 7(a) and (b). Due to a strong wind, the NO2 concentrations in the industrial area of China (Fig. 7(a) and (b)) were between 10 ppb and 20 ppb, significantly lower than those in the PM2.5 episode (Fig. 5(a) and (b)). As shown in Fig. 7(c), the O3 concentrations at 3 PM, Jan. 24 KST (daytime) in eastern China, central China, the Yellow Sea, and Korea were mostly below 30 ppb. Nocturnal O3 concentrations higher than 50 ppb, which were observed in the PM2.5 episode model simulation, were not seen on the non-episode days as evidenced in Fig. 7(d): the nocturnal O3 levels in the Yellow Sea on the non-episode days were mostly below 30 ppb.
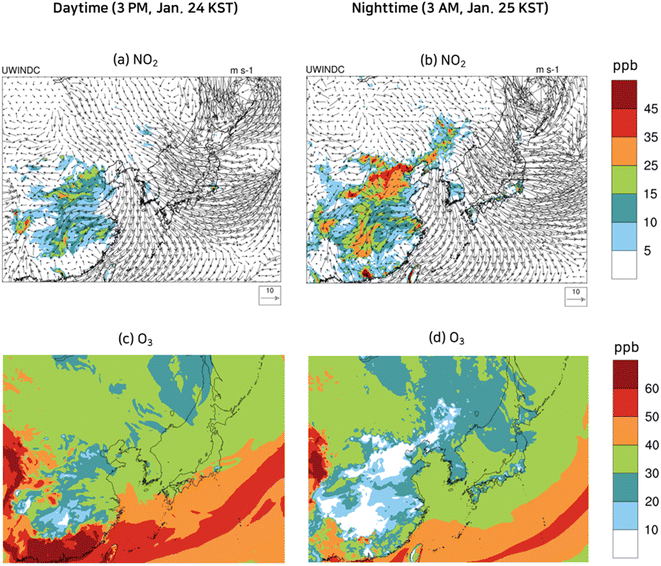 | ||
| Fig. 7 Wind velocity vectors and spatial variation of concentrations of NO2 (a and b) and O3 (c and d) at selected daytime and nighttime during the non-episode. | ||
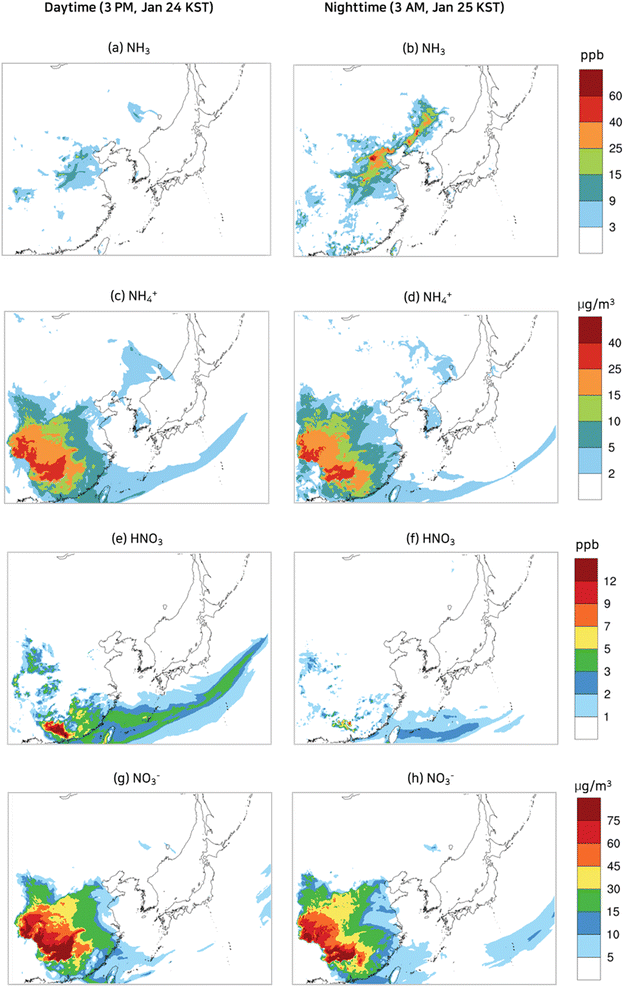
The low NO2 and O3 result in slow HNO3 formation, leading to low HNO3, nitrate, and ammonium levels in eastern and central China, the Yellow Sea, and Korea as shown in Fig. 8(a)–(h). Despite the strong wind decreasing NH3 concentration, low HNO3 concentration had a positive effect on the NH3 gas concentration, therefore the levels of NH3 in the non-episode were comparable to those in the episode.
3.4. NH3, HNO3, nitrate concentration distribution in the cross-section from China to Korea during the PM2.5 episode
Particulate nitrate and particulate ammonium are in equilibrium with NH3 and HNO3 gas. According to Section 3.3 (Fig. 6), the model domain was in an NH3-lean condition during the day, while it was in an NH3-rich condition during the night except in the Yellow Sea. Cross-sectional views of NH3 gas, HNO3 gas, and particulate nitrate concentrations are depicted in Fig. 9 for a better representation of the dynamic equilibrium between HNO3 gas and particulate nitrate. As shown in Fig. 6(a), the cross-section line that begins from Laizhou Bay, situated on the Shandong peninsula in China (labeled by “a”), traverses the Yellow Sea and ends 40 km away from the eastern coast of Korea (labeled with “e”), running in parallel with the wind velocity vector. And we designated points “b”, “c”, and “d” at the eastern coast of China, the western coast of Korea, and the eastern end of the Korea sub-area.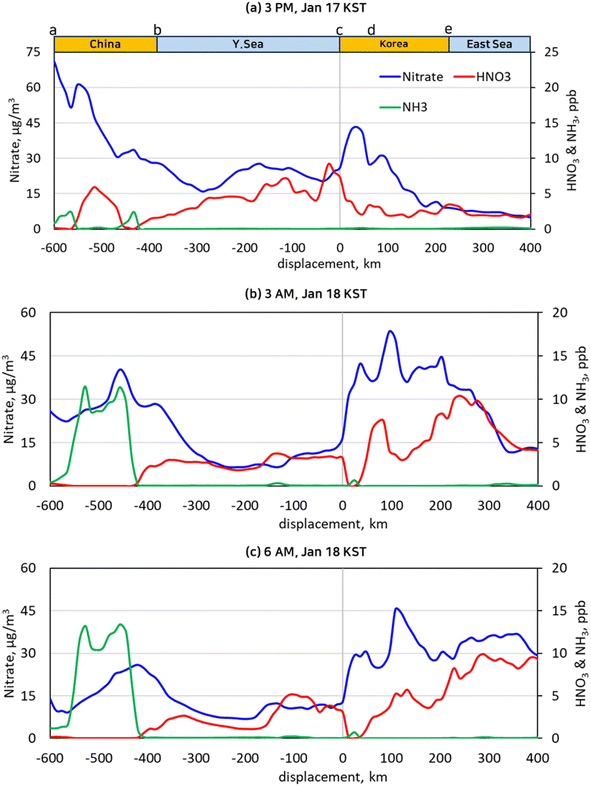 | ||
| Fig. 9 NH3, HNO3, and nitrate concentrations along the cross-section from “a” to “e” as depicted in Fig. 6(a) at the selected time of 3 PM, Jan. 17 KST (a), 3 AM, Jan. 18 KST (b), and 6 AM, Jan. 18 KST (c). | ||
As shown in Fig. 9, the NH3 gas concentrations were nearly zero over the Yellow Sea, whereas they ranged widely in China and Korea depending on the availability of HNO3 gas and the vertical mixing height over the lands. As the air mass was transported across the Yellow Sea, HNO3 was formed, thus raising its concentration. When it landed on the west coast of Korea labeled as “c”, the HNO3 gas was depleted as it reacted with NH3 gas, and the nitrate concentration rose proportionally. Fig. 9(a) shows that the NH3 concentrations were not high enough to exhaust the HNO3 completely in the daytime. In contrast, in the nighttime, the HNO3 completely reacted away near the coasts to produce particulate ammonium as seen in Fig. 9(b) and (c). Assuming that the chemical reaction rates greatly surpass the vertical diffusive flux, the decrease of HNO3 gas concentration near point “c” in Fig. 9(b) and (c) can be attributed to the nitrate produced by HNO3 gas from the Yellow Sea. According to Fig. 9(b), 3.2 ppb of HNO3 gas were converted to 14.2 μg m−3 of particulate nitrate at 3 AM in the local time. A similar conversion of HNO3 to nitrate took place at 6 AM as shown in Fig. 9(c).
3.5. HNO3 production during the episode
IRR (Integrated Reaction Rate), a CMAQ utility tool, was employed to calculate the hourly HNO3 production rate of reactions (R1)–(R8) on the ground level at the sub-areas chosen from China, the Yellow Sea, and Korea. Fig. 10 illustrates that during the day HNO3 was primarily formed by the oxidation of NO2 by OH radical (reaction (R1)), while during the night it was mainly generated by the heterogeneous hydrolysis of N2O5 (reaction (R5)). This figure also indicates that reactions (R2) (reaction between NO3 and VOC), (R6) (the hydrolysis of NTR2), and (R8) (the hydrolysis of CLNO3) had an insignificant part in producing nitrate, with all of them contributing less than 10%. Our model simulation indicates that the variations in NO2 concentrations across the three sub-areas were pronounced, leading to different HNO3 yields in each sub-area during the day. Due to its elevated ambient NO2 levels, the China sub-area had the highest daytime production rate of HNO3, 3.6 times higher than the Yellow Sea sub-area and 2.8 times higher than the Korea sub-area. | ||
| Fig. 10 HNO3 production rate in the sub-areas of China, Yellow Sea, and Korea during the daytime and nighttime of the episode. | ||
During the night, O3 also has a large spatial variability as NO titrated away O3 in urban areas. The O3 concentrations at 3 AM, Jan. 18 KST (nighttime) in the China sub-area were generally below 10 ppb whilst those in the Yellow Sea sub-area were above 40 ppb as depicted in Fig. 5(d). The China sub-area still had the highest HNO3 production rate during the night due to its elevated NO2 levels, but production of HNO3 decreased by more than half compared to the daytime because of the low O3 levels. Similarly, the HNO3 production rate in the Korea sub-area was reduced by 40 percent during the night. In contrast, the HNO3 production rate in the Yellow Sea sub-area was increased by 24% during the night as the near-zero NO emissions limited O3 destruction by NO titration. As a result, the nighttime HNO3 production rate in the Yellow Sea sub-area was higher than that in the Korea sub-area by 65%, supporting the findings in Fig. 9 on the role of the Yellow Sea.
HNO3 is a highly soluble gas-phase chemical species, making it vulnerable to dry deposition in the Yellow Sea. The significance of dry deposition was evaluated by comparing the HNO3 loss rates by dry deposition with other production and loss rates, as shown in Fig. 11. Here, a CMAQ utility tool, IPR (Integrated Process Rate) defined by eqn (3), was utilized to calculate each production and loss rate. The HNO3 dry deposition rate in the Yellow Sea sub-area was 2.5 times as high as that in the China sub-area, and the Korea sub-area as expected. However, the HNO3 chemical production rate was still four times as high as the dry deposition rate of HNO3 even in the Yellow Sea sub-area. This high chemical production rate contributed to the increase of HNO3 concentration in the Yellow Sea as shown in Fig. 9 despite rapid dry deposition processes.
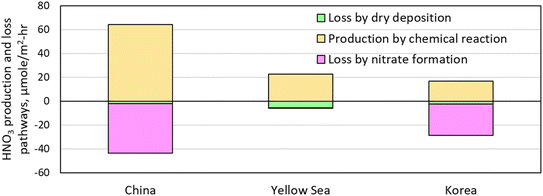 | ||
| Fig. 11 HNO3 chemical production rate, loss rates by dry deposition and nitrate formation in sub-areas of China, Yellow Sea, and Korea during the episode. | ||
The oxidation of NO2 to HNO3 requires both oxidants and NO2. As eqn (2) stated, we calculated the conversion rates of NO2 to HNO3 by dividing the HNO3 production rates by the NO2 concentrations. During the day, the conversion rate in the Yellow Sea was the largest, surpassing the China sub-area by 48% and the Korea sub-area by 64% as seen in Fig. 12. The varying conversion rates across the three sub-areas during the day were attributed to the variation in OH levels, which were affected by solar irradiances and VOC to NOx ratios. Upon entering the night, the O3 concentrations in the Yellow Sea remained relatively unchanged, while those in the urban areas were depleted by NO titration as stated in Section 3.3. In the Yellow Sea, the conversion rate of NO2 to HNO3 during the night was more than twice as much as during the day, yet in the China sub-area, it dropped nearly 80%. Consequently, the Yellow Sea had conversion rates of NO2 to HNO3, which were 18 and 7 times larger than the China sub-area and the Korea sub-area, respectively.
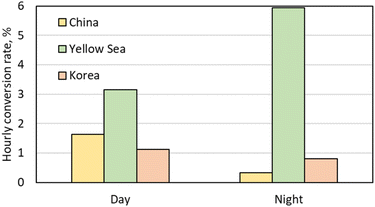 | ||
| Fig. 12 Conversion rate of NO2 to HNO3 in the sub-areas of China, Yellow Sea, and Korea during the daytime and nighttime of the episode. | ||
The sensitivity of particle nitrate to a change in NH3 gas or HNO3 concentrations can be evaluated by the adjusted Gas Ratio (adjGR = ([NH3] + [nitrate])/([HNO3] + [nitrate])).22,32 The adjGR is an indicator of the limited regime: in cases where the adjGR is greater than 1, it is NH3-rich; if not, it is NH3-lean. During the episode, the adjGR was 1.4 in the China sub-area, 0.75 in the Yellow Sea sub-area, and 1.18 in the Korea sub-area. Therefore, the HNO3 formed in the China sub-area is changed to nitrate before being transported out of China, whereas the HNO3 formed in the Yellow Sea sub-area was transported to the Korea sub-area without being converted to nitrate. The transported HNO3 to the Korea sub-area reacted with NH3 to decrease the adjGR, however, the adjGR in the Korea sub-area was still greater than 1 to ensure the conversion of the HNO3 to nitrate.
4. Conclusion
The present study used observational data and model results to reaffirm that elevated particulate nitrate concentration was the main cause of the severe PM2.5 pollution episode that occurred in January 2018 in Seoul. Particulate nitrate was formed as particulate ammonium nitrate via the NH3–HNO3–NH4NO3 equilibrium and it dominated over HNO3 gas in urban areas during the episodes. Also found was that when the NO2 emitted from the land was transported across the Yellow Sea, it was oxidized to HNO3 and landed on the western coast of Korea. Then, the landed HNO3 was quickly converted to nitrate through equilibrium with NH3, which is abundant in Korea. The nitrate formed in China was also transported to Seoul at the same time to further increase the contribution to the nitrate in Seoul. Despite VOC and NOx levels being low, the oxidant concentrations in the Yellow Sea were still considerable, making the conversion rates of NO2 to HNO3 in the Yellow Sea greater than those in China and Korea. Especially, during the night, the calculated O3 concentration in the Yellow Sea was much higher than those in China and Korea because of very little NO titration effect, which is consistent with observation by Seo et al. (2017).9 As a result, the conversion rates in the Yellow Sea were 18 times and 7 times larger than those in the China sub-area and Korea sub-area during the night, respectively.Significant advances in understanding toward long-range transport and formation of PM2.5 have been made in East Asia in the recent decade, but limited research has been conducted on the impact of the Yellow Sea on PM2.5 events in western Korea, with a significant lack of observational data. More recently, ship-based observations,10,11 satellite data analysis,11 and monitoring in islands off the west coast of Korea9 have been made to measure PM2.5 and criteria air pollutant concentrations over the Yellow Sea. However, monitoring of gaseous precursors of PM2.5 including NH3 gas HNO3 over the Yellow Sea is still lacking and recommended as a future study.
Data availability
The monitoring data were obtained from the National Institute of Environmental Research (NIER), and they are available from the authors with the permission of NIER.Author contributions
HyeonYeong Park: visualization, investigation, methodology, writing – original draft. Joon-Young Ahn: investigation, resources. Sung-Chul Hong: investigation, resources. Jae-Bum Lee: investigation, resources. SeogYeon Cho: conceptualization, investigation, methodology, writing – review & editing.Conflicts of interest
The authors declare no conflict of interest.Acknowledgements
This research was supported of the Air Quality Forecasting Center at the National Institute of Environmental Research under the Ministry of Environment (MOE) (grant number: NIER-2022-01-02-072), and supported by a grant from the National Institute of Environmental Research (NIER), funded by the Ministry of Environment (MOE) of the Republic of Korea (grant number: NIER-2021-03-03-007). The authors would like to thank the Korean National Institute of Environmental Research (NIER) for providing the PM supersite data.References
- H.-Y. Jo, H.-J. Lee, Y.-J. Jo, G. Heo, M. Lee, J.-A. Kim, M.-S. Park, T. Lee, S.-W. Kim and Y.-H. Lee, A case study of heavy PM2. 5 secondary formation by N2O5 nocturnal chemistry in Seoul, Korea in January 2018: Model performance and error analysis, Atmos. Res., 2022, 266, 105951 CrossRef CAS.
- J. Kim, B. Han and S. Cho, A numerical simulation of annual acid deposition amount in Korea, Atmos. Environ., 2003, 37, 1703–1713 CrossRef CAS.
- J. Kim and S. Cho, A numerical simulation of present and future acid deposition in North East Asia using a comprehensive acid deposition model, Atmos. Environ., 2003, 37, 3375–3383 CrossRef CAS.
- C.-M. Kang, B.-W. Kang and H. S. Lee, Source identification and trends in concentrations of gaseous and fine particulate principal species in Seoul, South Korea, J. Air Waste Manage. Assoc., 2006, 56, 911–921 CrossRef CAS PubMed.
- Y.-S. Koo, H.-Y. Yun, D.-R. Choi, J.-S. Han, J.-B. Lee and Y.-J. Lim, An analysis of chemical and meteorological characteristics of haze events in the Seoul metropolitan area during January 12–18, 2013, Atmos. Environ., 2018, 178, 87–100 CrossRef CAS.
- D. Lee, J.-Y. Choi, J. Myoung, O. Kim, J. Park, H.-J. Shin, S.-J. Ban, H.-J. Park and K.-P. Nam, Analysis of a severe PM2. 5 episode in the Seoul Metropolitan area in South Korea from 27 February to 7 March 2019: Focused on estimation of domestic and foreign contribution, Atmosphere, 2019, 10, 756 CrossRef CAS.
- W. L. Chang, P. V. Bhave, S. S. Brown, N. Riemer, J. Stutz and D. Dabdub, Heterogeneous atmospheric chemistry, ambient measurements, and model calculations of N2O5: a review, Aerosol Sci. Technol., 2011, 45, 665–695 CrossRef.
- E. Kim, B.-U. Kim, H. C. Kim and S. Kim, Sensitivity of fine particulate matter concentrations in South Korea to regional ammonia emissions in Northeast Asia, Environ. Pollut., 2021, 273, 116428 CrossRef CAS.
- J. Seo, J. Y. Kim, D. Youn, J. Y. Lee, H. Kim, Y. B. Lim, Y. Kim and H. C. Jin, On the multiday haze in the Asian continental outflow: the important role of synoptic conditions combined with regional and local sources, Atmos. Chem. Phys., 2017, 17, 9311–9332 CrossRef CAS.
- Y.-K. Lim, J. Kim, H. C. Lee, S.-S. Lee, J.-W. Cha and S. B. Ryoo, Aerosol physical characteristics over the yellow sea during the KORUS-AQ field campaign: observations and air quality model simulations, J. Atmos. Sci., 2019, 55, 629–640 Search PubMed.
- Y. Wang, G. Xu, L. Chen and K. Chen, Characteristics of Air Pollutant Distribution and Sources in the East China Sea and the Yellow Sea in Spring Based on Multiple Observation Methods, Remote Sens., 2023, 15, 3262 CrossRef.
- H. Shimadera, H. Hayami, S. Chatani, Y. Morino, Y. Mori, T. Morikawa, K. Yamaji and T. Ohara, Sensitivity analyses of factors influencing CMAQ performance for fine particulate nitrate, J. Air Waste Manage. Assoc., 2014, 64, 374–387 CrossRef CAS.
- X. Xie, J. Hu, M. Qin, S. Guo, M. Hu, H. Wang, S. Lou, J. Li, J. Sun and X. Li, Modeling particulate nitrate in China: Current findings and future directions, Environ. Int., 2022, 166, 107369 CrossRef CAS PubMed.
- J. Walker, S. Philip, R. Martin and J. Seinfeld, Simulation of nitrate, sulfate, and ammonium aerosols over the United States, Atmos. Chem. Phys., 2012, 12, 11213–11227 CrossRef CAS.
- T. Anttila, A. Kiendler-Scharr, R. Tillmann and T. F. Mentel, On the reactive uptake of gaseous compounds by organic-coated aqueous aerosols: theoretical analysis and application to the heterogeneous hydrolysis of N2O5, J. Phys. Chem. A, 2006, 110, 10435–10443 CrossRef CAS PubMed.
- S. Cho, H. Park, J. Son and L. Chang, Development of the global to mesoscale air quality forecast and analysis system (GMAF) and its application to PM2. 5 forecast in Korea, Atmosphere, 2021, 12, 411 CrossRef CAS.
- W. C. Skamarock, J. B. Klemp, J. Dudhia, D. O. Gill, D. M. Barker, M. G. Duda, X.-Y. Huang, W. Wang and J. G. Powers, A description of the advanced research WRF version 3, NCAR technical note, 2008, 475, 113 Search PubMed.
- K. W. Appel, J. O. Bash, K. M. Fahey, K. M. Foley, R. C. Gilliam, C. Hogrefe, W. T. Hutzell, D. Kang, R. Mathur and B. N. Murphy, The Community Multiscale Air Quality (CMAQ) model versions 5.3 and 5.3. 1: system updates and evaluation, Geosci. Model Dev., 2021, 14, 2867–2897 CrossRef CAS PubMed.
- W. Slinn, Atmospheric Sciences and Power Production 1979, Precipitation Scavenging, US Department of Energy, Washington, DC, 1983, 655 Search PubMed.
- H.-Y. Park, S.-C. Hong, J.-B. Lee and S.-Y. Cho, Modeling of Organic Aerosol in Seoul Using CMAQ with AERO7, Atmosphere, 2023, 14, 874 CrossRef CAS.
- S. Kim, C. Bae, B.-U. Kim and H. C. Kim, PM 2.5 simulations for the Seoul Metropolitan Area:(I) contributions of precursor emissions in the 2013 CAPSS emissions inventory, J. Korean Soc. Atmos., 2017, 33, 139–158 CrossRef.
- J. Lim, H. Park and S. Cho, Evaluation of the ammonia emission sensitivity of secondary inorganic aerosol concentrations measured by the national reference method, Atmos. Environ., 2022, 270, 118903 CrossRef CAS.
- M. Li, H. Liu, G. Geng, C. Hong, F. Liu, Y. Song, D. Tong, B. Zheng, H. Cui and H. Man, Anthropogenic emission inventories in China: a review, Natl. Sci. Rev., 2017, 4, 834–866 CrossRef CAS.
- B. Zheng, D. Tong, M. Li, F. Liu, C. Hong, G. Geng, H. Li, X. Li, L. Peng and J. Qi, Trends in China's anthropogenic emissions since 2010 as the consequence of clean air actions, Atmos. Chem. Phys., 2018, 18, 14095–14111 CrossRef CAS.
- A. Guenther, X. Jiang, C. L. Heald, T. Sakulyanontvittaya, T. a. Duhl, L. Emmons and X. Wang, The Model of Emissions of Gases and Aerosols from Nature version 2.1 (MEGAN2. 1): an extended and updated framework for modeling biogenic emissions, Geosci. Model Dev., 2012, 5, 1471–1492 CrossRef.
- F. J. Dentener and P. J. Crutzen, Reaction of N2O5 on tropospheric aerosols: Impact on the global distributions of NO x, O3, and OH, J. Geophys. Res., 1993, 98, 7149–7163 CrossRef CAS.
- I. Alecu and P. Marshall, Computational Study of the Thermochemistry of N2O5 and the Kinetics of the Reaction N2O5 + H2O → 2HNO3, J. Phys. Chem. A, 2014, 118, 11405–11416 CrossRef CAS.
- N. Riemer, H. Vogel, B. Vogel, T. Anttila, A. Kiendler-Scharr and T. Mentel, Relative importance of organic coatings for the heterogeneous hydrolysis of N2O5 during summer in Europe, J. Geophys. Res., 2009, 114, D17307 Search PubMed.
- L. Cao, S. Li and L. Sun, Study of different Carbon Bond 6 (CB6) mechanisms by using a concentration sensitivity analysis, Atmos. Chem. Phys., 2021, 21, 12687–12714 CrossRef CAS.
- C. Emery, Z. Liu, A. G. Russell, M. T. Odman, G. Yarwood and N. Kumar, Recommendations on statistics and benchmarks to assess photochemical model performance, J. Air Waste Manage. Assoc., 2017, 67, 582–598 CrossRef CAS.
- C. Emery, E. Tai and G. Yarwood, Enhanced Meteorological Modeling and Performance Evaluation for Two Texas Ozone Episodes, Prepared for the Texas Natural Resource Conservation Commission, by ENVIRON International Corporation, 2001, 161 Search PubMed.
- R. W. Pinder, R. L. Dennis and P. V. Bhave, Observable indicators of the sensitivity of PM2. 5 nitrate to emission reductions—Part I: Derivation of the adjusted gas ratio and applicability at regulatory-relevant time scales, Atmos. Environ., 2008, 42, 1275–1286 CrossRef CAS.
Footnote |
| † Electronic supplementary information (ESI) available. See DOI: https://doi.org/10.1039/d4ea00034j |
| This journal is © The Royal Society of Chemistry 2024 |

