 Open Access Article
Microplastics in Asia: overcoming sampling, analysis, and regulatory challenges to protect the ecosystem – a review
Sivamani
Sivalingam
 *a,
P. Gomathi
Priya
 b,
D. Shanthana
Lakshmi
 c and
Srinivas T. G.
Srimath
 c
c
aDepartment of Chemical Engineering, Rajalakshmi Engineering College, Thandalam, Chennai, Tamilnadu, India-602105. E-mail: sivamchem@gmail.com; sivamani.s@rajalakshmi.edu.in
bDepartment of Chemical Engineering, A.C.Technology, Anna University, Chennai, Tamilnadu, India-600025
cRSK Environment Ltd, 18, Frogmore Road, Hemel Hempstead, HP3 9RT, UK
First published on 17th October 2024
Abstract
Microplastics (MPs) are defined as emerging contaminants, named so for the potential danger they pose to public health and the economy. MPs, defined as plastic particles smaller than 5 mm in size, have become significant pollutants, leading to extensive research and regulatory action. Various characterization techniques are discussed, such as FTIR, SEM-EDS, Raman, BET, DSC, XRD, GC-MS, and particle size analysis. Sampling challenges include uneven distribution, lack of standardized methods, and contamination risks. Analytical limitations stem from the need for precise detection, with current methods needing help in differentiating between MPs and other particles. Regulatory frameworks in Asian nations vary; some have comprehensive policies, while others face economic and infrastructural barriers. Researchers face critical challenges in controlling MP contamination in outdoor (OD) and indoor (ID) air. This review examines the current knowledge of the obstacles in sampling and analyzing MPs and an outline of the regulations in different Asian countries with different characterization methods to analyze the MPs. Furthermore, this review emphasizes the importance of unified protocols and strong regulations to improve data comparability and encourage collaborative efforts. By shedding light on the complexities of MP research and regulation in Asia, this paper aims to promote a better understanding and advocate for collective action to address these challenges and safeguard ecosystems.
Environmental significanceMicroplastics (MPs) are plastic particles <5 mm in size and constitute a major class of environmental pollutants due to their relevance to human health and the economy. The challenges to sampling and analysing these compounds in Asia are exacerbated by uneven distribution, lack of standardised methods and contamination risks. Moreover, the regulatory landscape across Asian countries is diverse. This study is important because it shows the barriers in MP research and regulation throughout Asia, highlighting the need for standardized protocols and rigorous regulations to improve data comparison among different studies as well as between countries. By addressing these challenges, this review aims to safeguard ecosystems from MP pollution, highlighting the need for imminent action and improved pollution control management. This paper advocates for a collective approach to overcome the sampling, analytical, and regulatory challenges associated with MPs, ultimately contributing to the protection of both public health and the environment. |
1 Introduction
Particles and liquid droplets in the air are referred to as particulate matter (PM) or airborne MPs. PM is classified based on the Aerodynamic Equivalent Diameter (AED) of the particles,1 with PM10 (AED < 10 μm) and PM2.5 (AED < 2.5 μm). PM is gaining more momentum and attention due to its innumerable hazardous impacts on human health.1 The term ‘Plastic’ is intertwined with civil society in many aspects due to its social, economic, and environmental advantages, viz., shelf-life of medicines and foods, packaging and several industrial sectors. Fig. 1 demonstrates the existing classes of MPs based on their particle sizes.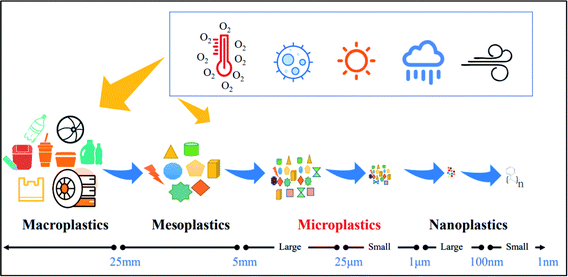 | ||
| Fig. 1 The four classifications of plastic size (License: Under Creative Commons Attribution 3.0).2 | ||
The global use of plastic materials has dramatically increased3 because of its durability, adaptability, and economic affordability. Plastics played a vital role during the COVID-19 pandemic,4 which further increased the alarming level of 1.6 MT of plastic garbage generated worldwide every day, with 3.4 billion facemasks being disposed on a daily basis.5 Plastic is not sustainable and impacts the environment, health, and economy in addition to societal inequalities.6Fig. 2 shows the sorting of several plastics in the environment, including those of Nano, Micro, Meso, Macro, and Mega sizes and their ranges.
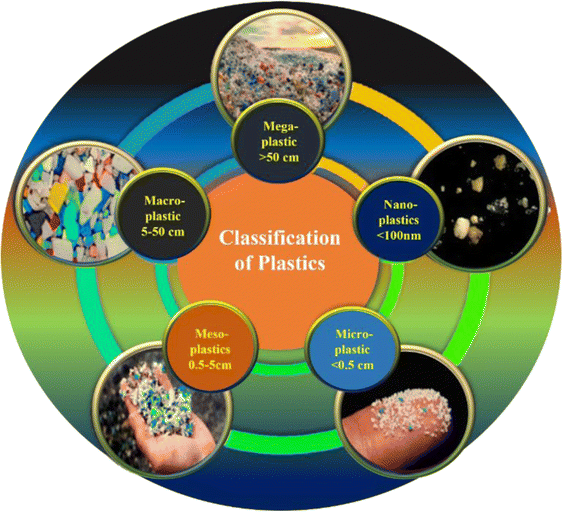 | ||
| Fig. 2 Classification of different types of plastics discovered in the surrounding environment (License: Under Creative Commons 3.0).7 | ||
Global plastic production in the year 2021 amounted to 390.7 million tons. Incineration accounted for around 12% of the total plastics generated, while recycling managed to handle 9%. Unfortunately, approximately 22% of plastic is not properly managed and ends up either in landfills or in the ecosystem. An alarming statistic reveals that 60–90% of marine debris consists of plastic, with over 9 million metric tons making their way into the oceans in 2015 alone. This highlights the significant portion of plastics that ultimately find their way into landfills or the ecosystem. It is estimated that on an annual basis, around 20 million metric tons of plastic residues are mismanaged.8 Sharma and Mallubhotla (2019)9 reported that India produced around 9.4 MMT of plastic waste in 2016. Of this amount, only 60% of the plastic waste was recycled, while the remaining 40% either went to landfills or continued to circulate in the environment. Fig. 3 illustrates the Global plastics treaty aiming to combat the plastic crisis.
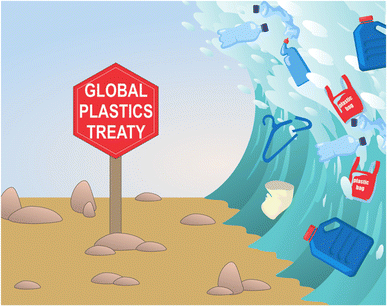 | ||
| Fig. 3 Global Plastics Treaty's potential to halt the plastic surge is being questioned (License: Under Creative Commons CC BY).10 | ||
Small plastic debris called MPs (MPs, 1–5000 μm) plays a critical role in human health in ID and ambient environments. The widespread occurrence of MPs in air and their probable effect on human health and the economy demands stringent regulations, standard sampling techniques, robust analytical tools, and reporting units.11 The quantity methods embraced for PM are largely gravimetric or real-time. PM is gathered on a surface or filter to be analyzed later using a gravimetric measurement. Gravimetric techniques can be carried out in either a passive or active manner, such as by utilizing a gravimetric collector12 or a vacuum pump. Fig. 4 displays the atmospheric processes on MPs that can be divided into three parts, (I) emission of pristine MPs which makes them airborne, (II) MP photodegradation, and (III) MP degradation.
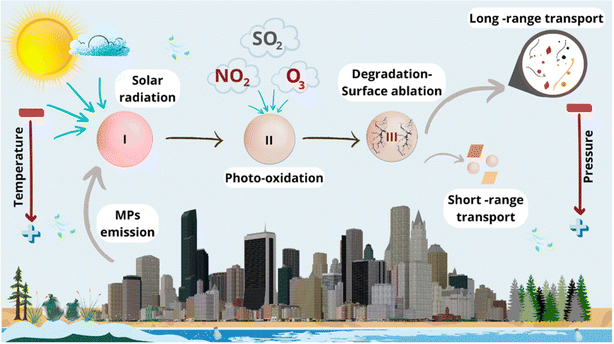 | ||
| Fig. 4 Atmospheric processes involving MPs encompass several aspects. Firstly, there is emission of pristine MP particles which makes them airborne. Secondly, the photodegradation of MPs occurs due to solar radiation and its interactions with atmospheric compounds. Lastly, MP degradation leads to lower weight particles that can be transported over long distances, while heavier ones have shorter transport distances (License: Under Creative Commons Attribution 3.0).13 | ||
During the fourth session of the UN Environment Assembly on World Environment Day 2018, India announced its pledge to eliminate single-use plastic items by 2022.14 Subsequently, the Indian Government incorporated two amendments to the Plastic Waste Management regulations on August 12 and September 22, 2021, announcing restrictions on 17 troublesome single-use plastic items effective from July 1, 2022.14,15 As per these rules, single-use plastics made of composite material are not included in the bans, but producers must first get approval from the Central Pollution Control Board to sell them.14 MPs have become a major environmental issue due to their impact on both ID and OD air quality. Characterizing these minute particles requires sophisticated techniques to identify and quantify MPs effectively. Recognizing MPs' national and international importance as an air pollutant is necessary to understand the existing regulations, as well as MP sampling and characterization techniques and reporting units. This knowledge is crucial because it helps in effectively implementing and evaluating these measures, ensuring a thorough assessment of their overall impact on the environment (Fig. 5).
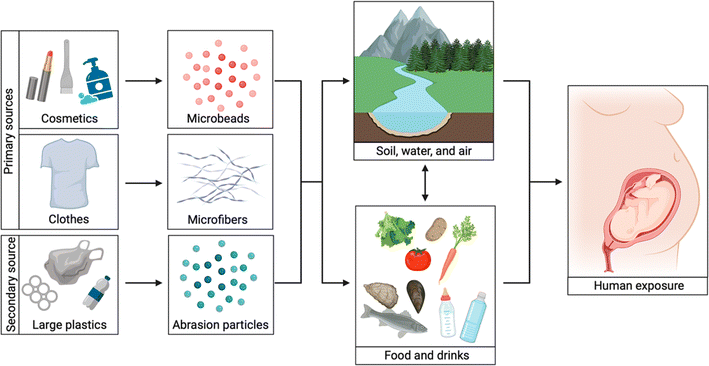 | ||
| Fig. 5 A summary of various pathways of microplastic exposure. Primary sources comprise of clothing and beauty products, while secondary sources consist of larger plastic items of greater importance. Microbeads found in cosmetics, microfibers present in clothing, and smaller plastic particles resulting from plastic breakdown can be consumed by humans through food beverages and refreshments or the surrounding nature. If pregnant women are exposed, the developing fetus can also be exposed (License: Under Creative Commons Attribution 3.0).16 | ||
The objective of this review is to bridge the current knowledge gap in the existing sampling techniques, characterization tools, and reporting units of airborne MPs in ambient and ID environments in the geographic regions of Asia. This review provides the following.
(i) An overview of the global regulations of MPs as an air pollutant (ambient and ID air) with insights from the literature.
(ii) A critical summary of the existing sampling techniques of MPs for ID and ambient air (a diverse range of techniques employed) in Asia.
(iii) A summary of the analytical tools for understanding MPs' quantitative/qualitative value.
(iv) Reporting units of MPs in the air.
This review provides a foundation to steer future endeavours aimed at addressing the complexity of MPs in air sampling and their reporting units.
2 Review methodologies
A thorough literature review was performed on MPs in Asian air space. Literature searches were further refined using specific keywords on ambient and ID air, such as “microplastics,” “ID air,” “ambient air,” “microplastic sampling,” “microplastic characterization,” and “regulations” (refer to Fig. 6). Based on the literature search on MPs, the total number of publications in Asia and Worldwide is shown below.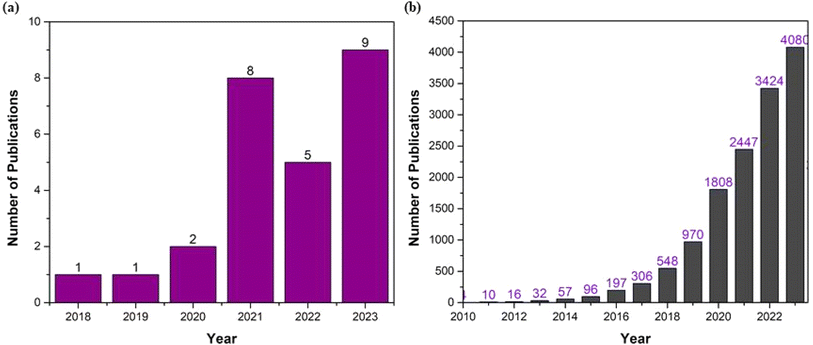 | ||
| Fig. 6 Recent research trends of MPs; (a) Asian countries, (b) Worldwide research documents, until 13th July 2024. | ||
2.1 Existing techniques of MP sampling in air
The distribution of airborne MPs can be investigated through two dissimilar air samplings: active and passive air sampling. The active sample uses a device to force air through a sample container, whereas passive air sampling relies on diffusion to gather air for sampling.172.2 Active air sampling techniques
The pump is necessary for AAS (Active air sampling). Using a pump, AAS can either be achieved by the air being drawn through a tube with a sorbent bed to collect gases and vapors or particulates being captured onto a filter loaded in a cassette or size-specific sampler. The gas and vapor measurements are given in milliliters per minute while the aerosol flow rate is shown in liters per minute. The calibrator that is designed specifically for the flow rate needs to be set and its accuracy checked. One of the benefits brought about by this type of sampling is that it can provide flexibility in terms of the flow-rate due to the capability of the pump which has variable speeds. However, for optimum performance of size-selective aerosol samplers, a fixed flow rate should be maintained. Various active sampling methods have been validated and published by different government agencies. Although this sample collection procedure underlies most techniques, some disadvantages of active air sampling for gases and vapors may cause certain researchers to turn towards passive alternatives instead. Active air sampling tends to be less user-friendly and more costly because one needs to buy a pump as well as a calibrator. Pump, container, and collection media are three essential components involved in active air sampling.18,192.3 Passive air sampling techniques
Diffusive sampling, also known as passive air sampling, is a technique mainly employed for sampling gases and vapors, as it relies on a natural diffusion process. This technique might be considered “passive” since it does not require pumping air like active sampling does. There are different types of diffusion samplers, but they all share a common basic design. The diffusive surface, located at one end of the container, is where gaseous and vapor molecules penetrate.20 The sorbent medium is located at the opposite end and is where the molecules are gathered. Diffusive sampling is highly effective for extended testing periods. Due to its affordability, passive air sampling could be a more practical option for continuous air monitoring. This testing method is convenient because minimal expertise is needed to set up the equipment correctly, and no supervision or monitoring is necessary. Studying the deposition area is crucial during the passive sampling of MPs.20 There are also drawbacks associated with diffusive air sampling. Sampling cannot be done because certain particles do not diffuse like gases and vapors. Diffusive samplers have a constant uptake rate determined by their design, unlike active sorbent tube samplers. A high uptake rate can cause overload at high concentrations, whereas a low uptake rate may not gather enough samples for analysis at low concentrations.21 This approach is centered on dry and wet deposition. Three primary types of diffusive equipment are categorized by the diffusion path – tube, badge, and radial.2.4 Air sampling techniques in Asian countries
A thorough and systematic approach to sampling atmospheric fallout, with strict measures taken to minimize contamination, confirms the reliability of the collected data. A glass bottle with specified dimensions and a fixed support is used for sampling. The sampling site's height is 15 m above the ground, and the absence of large buildings ensures minimal interference. Samples are collected at regular intervals, such as monthly once, and the volumes are observed and recorded. The samples are promptly transferred on rainy days to avoid loss.22 K. Liu et al. in 2019 (ref. 23) studied the suspended atmospheric microplastics (SAMPs) in the West Pacific Ocean during a cruise. This study provides valuable insights into the atmospheric abundance, composition, and distribution of MPs. SAMP abundance ranged from 0 to 1.37 n m−3, with a median of 0.01 n m−3. This indicates variability in MP concentrations within the sampled areas. Fiber, filament, and granule SAMPs collectively constituted most MPs, with fibers being the most abundant, followed by fragments and granules. Plastic microbeads were also observed, accounting for 5% of the total MPs. This suggests a diverse range of MP types present in the atmosphere. This study also witnessed the differences in SAMP abundance between daytime and nighttime sampling periods. On average, twice as many atmospheric MPs were collected during the daytime (0.45 ± 0.46 n m−3) compared to at night (0.22 ± 0.19 n m−3). Floating atmospheric MPs are a crucial contributor to MP pollution in the ocean, specifically from textile microfibers.Liao et al. in 2021 (ref. 24) studied the occurrence of MPs in the urban and rural regions in Wenzhou City in July and August 2019. Airborne MPs were obtained with an LB-120 F intelligent middle flow TSP sampler made by Lubo Co. in Qingdao. This sampler maintained a consistent collection across sampling sites with an intake of 100 ± 0.1 L min−1. Sampling took place in 15 urban and 6 rural locations in Wenzhou City, enabling a comparison of MP levels between urban and rural settings. Three samples were gathered from each location to guarantee the accuracy of the data. Around 1 cubic meter of air was filtered in each sample, creating a significant amount for analysis. Particles in the air, which included MPs, were gathered on Whatman GF/F glass microfiber filters that had a pore size of 0.7 μm and a diameter of 90 mm. This filter style is frequently utilized for collecting small particles and is effective in trapping MPs. The sampler was placed on a tripod made of aluminum alloy to reach a height of 1.6 m above the ground level. This height is the same as the average height at which humans breathe in, which helps in accurately evaluating possible human exposure to airborne MPs. The research emphasized the lack of studies on how MP exposure occurs through inhalation and proposed that inhalation intake could be important. Measuring MPs suspended in air directly is not done often, highlighting the newness and significance of the research.
Song et al. in 2021 (ref. 25) aimed to assess the effectiveness of quality control measures in eliminating airborne MP contamination. Song et al. introduced eight representative airborne MPs into new borosilicate glass beakers that have been thoroughly cleaned and dried, and repeated the process three times for each sample. This step ensures the samples contain a known quantity and variety of MPs for testing. The MP abundance is quantified as 496.64 n m−2, presumably indicating the concentration of MPs in the sampled air. This study employs rigorous methods to prepare and test airborne MP samples and evaluates two expected quality assurance protocols for eliminating contamination. The results of these studies contribute to improving the reliability and accuracy of airborne MP measurements in environmental research.
A sampling methodology was conducted in Shanghai, China between November 2020 and January 2021 by choosing eight environments including 3 living rooms, 2 office rooms, and 3 OD locations in Shanghai. The air samples were collected IDs and ODs by using an active air sampler from Gardner Denver Thomas located in Germany. For the intake 2.5 m3 h−1 flow rate, the sampling time was 4 hours which accounted for about 10 m3 of air that was then analyzed. In order to have minimal disturbances during the process of sampling, doors and windows remained closed for one hour before ID sampling and no human activities were carried out while sampling was being conducted. For air suction filter flasks were connected with long-neck funnels through rubber tubes. All atmospheric particles were caught into sampling bottles containing deionized (DI) water as the trapping solution. To ensure uniformity in the sampling process samples were taken on alternate days under similar conditions.26 Chen et al. in 202227 provided a comprehensive overview of the sampling methodology employed to collect MPs from ID and OD air during business hours. This study used 25 mm cassettes from SKC in Dorset, UK to accumulate MPs during working hours. These cassettes were equipped with Silver membrane filters, 25 mm in diameter and with a pore size of 0.2 μm, sourced from STERLITECH in Kent, WA, US. The airflow rate during sampling was maintained at 9 L min−1. This rate ensured the effective ID and OD total suspended particle (TSP) collection during business hours. A total of 38 samples were collected, with 19 samples each from ID and OD air. This indicates a balanced sampling approach to compare MP levels between ID and OD environments. All filters were stored in a room where the temperature was controlled at 23 ± 3 °C, and relative humidity (RH) was maintained at 40% ± 5%. This controlled environment, both before and after sampling, helps preserve the integrity of the samples.
Choi et al. in 2022 (ref. 28) provided valuable insights into the presence and distribution of MPs in ID and OD environments, as well as settled dust samples in schools. These findings contribute to our understanding of MP pollution and its potential implications for human health and the environment. Sampling was conducted at five ID and three OD points. Air samplers were used for ID and OD air sampling, operating for 48 hours at a suction rate of 7 L min−1, and each sampler collected approximately 20.16 m3 of air. Cellulose nitrate membrane filters with a nominal pore size of 5 micrometers and a diameter of 47 mm were used for air sampling. The samplers were positioned at a height of 0.6–1.2 m from the floor. The collected samples were analyzed to investigate various characteristics of MPs, including number, type, size, and shape.
Ouyang et al. in 2022 (ref. 29) discussed the MP contamination in study rooms across different educational levels. Five study rooms were selected across various educational levels, each with different areas and student populations: kindergarten, primary school, junior high school, senior high school, and a postgraduate study room at a university. Sterile steel containers were used to take samples. These cans had been filled with ultrapure water prior to their closure by aluminized paper leading up to sampling them on desks at certain elevations. Ultrapure water was utilized to rinse the residues from the containers, and subsequent to filtration onto cellulose filter membranes, samples were collected. The study discovered that the proportion of MPs varied from around 37% to 43%, with an average value of 41.3%. The abundance of MPs differed across different study rooms, with the highest occurrence observed in the senior high school classroom. The abundance of MPs was reported in units of particles per square meter per day (n (m−2 d−1)), and the senior high school classroom exhibited the highest abundance, approximately 1.7–4.1 times greater than other sampling sites. This implies that the number of students and the duration of human activity in the study rooms could impact the abundance of fibrous MPs. Higher human activity and longer durations of human activity were associated with increased fibrous MP contamination.
Similarly, Zhang et al. (2020)30 monitored MP fibers in a dormitory, office, and corridor over a period of three months, including both weekdays and weekends. The findings revealed similar proportions of MPs in fibrous form across all three locations, ranging from 35% to 37.5%. The study also identified seven categories of synthetic or semisynthetic polymers, namely polyester, rayon, acrylic, cellophane, PP, PS, and PA, with polyester and rayon being the dominant materials, making up over 90% of the total. Most of the MPs collected were in the form of fibers, with the exception of a single PS fragment found within the office. The primary form of MP fallout was found to be fibers, with polymer compositions comparable to commonly used textile products in ID settings. The study successfully identified the compositions of 131 textile products frequently found in dormitories, providing insights into potential sources of MP contamination. Another study conducted by Wang et al. in 2020 (ref. 31) investigated the distribution of atmospheric MPs over the ocean and utilized a backward trajectory model and a total suspended atmospheric particulate sampler manufactured by Jinshida in Qingdao. The sampler operated at a sampling flow rate of 100 ± 0.1 L min−1, and each sampling transect was conducted for a duration ranging from 10 to 48 hours. This extended sampling period and large volume of air filtered per sample, ranging from 53 to 259 cubic meters, ensured a comprehensive collection of atmospheric particles, including MPs.
Sharaf et al. in 2024 (ref. 32) reported that various factors, including location, usage, and design of ID spaces, influence the presence of MPs in ID environments. However, more needs to be done to ensure comprehensive research on MPs in ID settings; some air and dust samples taken from ID spaces sometimes contain higher amounts of MPs than those taken from the outside. There are also cleaning methods that can affect the levels of MPs as well as the presence of certain materials such as carpets. Interestingly, it is not uncommon for vacuum cleaners to make the ID MP level decline sharply. Synthetic or semisynthetic polymers like polyester, rayon, acrylic, cellophane, PP, PS, and polyamide are found typically IDs. Results of research indicate that fiber concentrations within buildings were as high as 1–60 fibers per m3 compared with the OD atmosphere which had just 0.3 to 1.5 fibers per m3 concentration rates while microfibers were measured at these levels. Such fibers tend toward larger diameter averaging between 50 and 3250 μm unlike those from the open air measuring 50 to 1650 μm. The high prevalence of such MPs is due to daily wearing of clothes made from any kind of fiber at all. The number of textiles used and the amount of synthetic material determines whether non-biodegradable plastic debris is found IDs or not. In environments dominated by synthetic fiber textile usage atmospheric deposition will comprise a significant percentage of MPs. It has been observed that their dimensions, pigmentation and composition depend on the properties of the textiles they come from.
Din et al. in 2024 (ref. 32) described an air sampling process that follows a meticulous protocol to ensure the collection of accurate data on airborne MPs. To select appropriate places where human activity, space, and environmental conditions are considered, a survey of the study area is done prior to sampling. Quartz filter papers used in sampling are weighed beforehand and packed in well labeled containers to ensure that their weights are maintained and minimize chances of contamination. Glassware used for sample storage and preparation should be carefully washed with ultrapure water and dried to avoid contamination. Active air sampling is selected based on its working efficiency for OD and ID particulate matter (PM2.5) samples. Quality assurance measures are put in place to prevent sample contamination during the experiment. The sampling was carried out on weekdays so as to evaluate the influence of human activities on the presence of airborne MPs. A gravimetric sampler is installed on the roof top with pre-weighed quartz filter paper inserted in it. It operates at a flow rate of 16 L min−1 for 24 hours per day continuously. After this, the filter paper is removed from the sampler and placed in a labelled Petri dish sealed with an aluminium foil cover to prevent pollution. Once again, inside air sampling was conducted using a flow rate of 6 L min−1 for 24 h as previously discussed; MPs will be analyzed by means of their size, shape and color.
Size categorization is split into five categories: less than 50 μm, 50 to 100 μm, 100 to 250 μm, 250 to 500 μm, and 500 to 1000 μm. Nandi and colleagues (2024)33 studied the post-monsoon period and found that there were 23 particles per day of OD MPs on PM10 and 28 particles on PM2.5. In the winter months, the particle count rose to 34 per day and 91 per day, respectively. Stereomicroscopy was employed to visually identify and quantify MPs in the air samples. During post-monsoon (2022) and winter (2023) spells at Ranchi, Jharkhand in India, ID MPs were notably more abundant than OD MPs, with 87 and 108 particles per day, respectively. Fine and coarse particulate matter samples were gathered at the same time. A respirable dust sampler collected 28 PM10 samples over a 24 hours period on glass fiber filter papers that were preconditioned. A speciation air sampler system collected PM2.5 samples by using 28 samples for 24 hours on 47 mm diameter PTFE and Quartz fiber filter papers with a 2 μm pore size, which were preconditioned. Air was sampled IDs using a personal sampler on glass fiber filters that were pre-conditioned and had a diameter of 37 mm. During the research period, a sum of 28 air samples from IDs were gathered. An APM 460 was supplied with a flow rate of 1 cubic meter per minute while SASS had a flow rate of 6.7 liters per minute. A personal sampler was used to collect ID air at a flow rate of 2.9 LPM. This method was used to determine the overall quantity of MPs present in the ID air. The Central Pollution Control Board (CPCB) guidelines were adhered to, with samples being collected every two weeks during the post-monsoon season (November and December 2022) and winter season (January and February 2023). Overall 28 samples were collected in the entire study period, each taken over a 24 hour sampling duration. To prevent contamination, filters were wrapped in aluminum foil before being transported and handled in the laboratory.34
Liu et al. 2019,18 a study conducted in China between November 2017 and January 2018, examined dust samples from 39 families in 39 major cities. The purpose of the study was to gain insight into the composition of dust in urban environments. The sampling sites were chosen as the homes of middle-income families in each city, which typically consisted of a couple and a child living in a two-bedroom apartment. Dust was collected from a total of 4 square meters in each bedroom and the living room using brushes made of hog bristles, and both ID and OD dust samples were gathered simultaneously. OD dust was obtained from windowsills and open-air balconies connected to the apartments through the same method. To ensure no contamination, the dust samples were placed in sealed paper bags lined with aluminum foil that had been pre-cleaned. Before utilization, the sampling bags and brushes were rinsed twice with ethanol that had been filtered through 0.22 μm PTFE filters and then dried on a clean surface. Prior to analysis, the samples were sieved through a 2 mm sieve to eliminate larger particles. The air samples were transported to the laboratory within 48 hours of collection and stored at −20 °C until analysis. Prior to analysis, any foreign matter, such as hair, sand, bristles from the brushes, and paper debris, was manually removed from each sample.
Li et al. in 2020 (ref. 35) did detailed research in which samples were gathered from various elevations and sites surrounding Beijing's China University of Mining and Technology. Sampling sites were on top of a building (RB) at a height of 18 meters and 1.5 meters from the ground, symbolizing the human breathing level (HRH) and ground level. Minivol samplers were utilized at RB and HRH locations to gather total suspended particles over a period of 6 to 8 hours with a flow rate of 5 L min−1. Samples of airborne particles were gathered using MCE filters with a pore size of 0.8 μm and a diameter of 47 mm. During the airborne sampling campaign at the HRH site, particles were gathered at the GS site. These examples were a collection of surface dust particles that had built up on the floor.
Construction materials were gathered at a construction site close to the CUMTB campus in the Dongwangzhuang (DWZ) community with the help of stainless steel pliers and stored in sealed sampling bags. Materials for thermal insulation, gypsum components, and precast cement panels were gathered.
In Hidayat et al. 2024 (ref. 36) the concentrations of antimicrobial peptides (AMPs) in TSPs were studied in both Bandung and Osaka. The levels ranged from 1.03 to 14.27 particles per m3 in Bandung and 0.63 to 3.29 particles per m3 in Osaka. Fragmented AMPs were observed in both locations, with dominant Feret diameters varying from 1 to 20 μm. This research focuses on analyzing air quality and aerosol composition in urban environments, specifically comparing Bandung, Indonesia, and Osaka (Sakai City), Japan. The sampling was conducted on the rooftops of buildings in both cities, providing specific coordinates for accuracy. The duration of the sampling varied between the two cities, with Osaka's samples collected earlier than those in Bandung. Each location underwent four week-long sampling periods, allowing for a comprehensive understanding of air quality over time. The researchers utilized a multi-nozzle cascade impactor sampler to collect three size fractions of ambient aerosols (PM2.5, PM2.5–10, and PM10) on Teflon-coated glass fiber filters. This meticulous approach, along with the specified equipment and flow rate, ensured accurate data collection on aerosol particles in the air. The weather conditions during the sampling period were also documented.
The Dehghani et al. 2017 (ref. 37) study focused on examining the presence, characteristics, and potential health risks associated with ingesting MP dust. Instead of using passive dust collectors to gather deposited street dust, Dehghani et al. took a different approach. They opted to collect each street dust sample by gently sweeping an area of approximately 30 m2 next to the curb on both sides of the road. To ensure cleanliness and prevent plastic contamination, they utilized a local anti-static wooden brush made from dry stems of Sorghum bicolor plant species and a metallic pan. The sub-samples were thoroughly mixed to obtain a representative bulk sample, with over 1 kg of composite bulk sample collected at each sampling station. Through the use of a binocular microscope, the researchers determined that the plastic load in 10 street dust samples ranged from 88 to 605 MPs per 30 g of dry dust. The predominant types of MPs observed were black and yellow granule MPs, with sizes ranging from 250 to 500 μm. In a separate study conducted by Huang et al. in 2021,38 a total of twelve atmospheric deposition samples, including both dry and wet deposition, were collected over a one-year period from August 2018 to July 2019 in an urban area of Guangzhou, China. The sampling periods varied from 22 to 40 days. To collect these samples, a passive sampler consisting of a 22 L stainless steel bucket (with a diameter of 25 cm and a height of 45 cm) was placed on a three-story high roof at South China Agricultural University, approximately 10 m above ground level. Analyzing the atmospheric wet and dry deposition of MPs revealed deposition fluxes ranging from 51 to 178 particles per m2 per d, with an average of 114 ± 40 particles per m2 per d. The deposition samples contained various types of MPs, such as fibers, fragments, films, and microbeads, with fibers being the most abundant, accounting for approximately 77.6 ± 19.1% of the total MPs observed. Fig. 7 and Table 1 provides a detailed comparison of sampling of airborne MPs in various sources in Asian countries. Table 2 provides the quantitative measurement of MPs that have been found in the existing literature.
| Sources/environment/place | Sampling (A/P) and colour | Mode of collector | Locations/regions | The dominant shape of MPs | Concentration | Polymer type | Ref. |
|---|---|---|---|---|---|---|---|
| a PET: polyethylene terephthalate, EP: epoxy resin, PE–PP: polyethylene–polypropylene, PS: polystyrene, PE: polyethylene, PVC: polyvinyl chloride, Phe: phenoxy resin, ALK: alkyd resin, RY: rayon, PMA: poly(N-methyl acrylamide), PA: polyamide, PVA: poly(vinyl acetate), PAN: polyacrylonitrile, PP: polypropylene, MMMF: man-made mineral fibers. | |||||||
| Suspended atmospheric MP/OD/China | Passive sampling | Particulate sampler | West Pacific Ocean | Fiber, fragments, granules, and microbead | 0 to 1.37 n m−3 | PET, EP, PE–PP, PS, PE, PVC, ALK, RY, PMA, PA, PVA, PAN, PP | 39 |
| Colour | |||||||
| Unreported | 60%, 31%, and 8% | ||||||
| Atmospheric fallout/IDs/China | Passive sampling | Stainless steel containers | Classrooms of kindergarten | Fiber, foam, fragment, and film | 1404 n (m−2 d−1) | PE, PP, PS | 29 |
| Primary school, junior high school, and senior high school | 3143 n (m−2 d−1) | ||||||
| Colour | 3398 n (m−2 d−1) | ||||||
| Postgraduate study room of the university | 5844 n (m−2 d−1) | ||||||
| Unreported | 3143 n (m−2 d−1) | ||||||
| Atmospheric fallout Dongguan city/OD/China | Passive sampling | Glass bottles in each site were almost 15 m above the ground | Dongguan environmental monitoring central station | Non-fibrous MPs and fibers | 175 to 313 particles per m2 per day | PE, PP, PS, cellulose | 40 |
| Colour | Laboratory middle school of Dongguan | ||||||
| Unreported | Dongguan gym in Nancheng District | ||||||
| Suspected synthetic particles/ID and OD/Pakistan | Passive sampling | Gravimetric sampler | (Classrooms and laboratory) and (hallway and rooftop) | Fiber-like fragments | 4.34 ± 1.93 items per m3 and 4 0.93 ± 0.32 items per m3 | PET, PE, PP, PS | 32 |
| Transparent and black-colored MP particles | |||||||
| Airborne MPs OD and ID air samples India | Passive sampling | Respirable dust sampler and personal sampler | OD and ID air post-monsoon and winter | Fibers and fragments | 465 ± 27 particles per m2 per day in PM10 and 12![[thin space (1/6-em)]](https://www.rsc.org/images/entities/char_2009.gif) 104 ± 665 and 13 104 ± 665 and 13![[thin space (1/6-em)]](https://www.rsc.org/images/entities/char_2009.gif) 833 ± 1152 particles per m2 per day in PM2.5 833 ± 1152 particles per m2 per day in PM2.5 |
PE, PP, PS, PVC | 33 |
| Colour | |||||||
| Unreported | 689 ± 52 particles per m2 per day and 19![[thin space (1/6-em)]](https://www.rsc.org/images/entities/char_2009.gif) 789 ± 2957 and 30 789 ± 2957 and 30![[thin space (1/6-em)]](https://www.rsc.org/images/entities/char_2009.gif) 087 ± 13 087 ± 13![[thin space (1/6-em)]](https://www.rsc.org/images/entities/char_2009.gif) 402 particles per m2 per day in PM2.5 402 particles per m2 per day in PM2.5 |
||||||
| Suspended atmospheric microplastics, China (ID and OD air samples) | Passive sampling | Total suspended particulate sampler | Apartment, office, classroom, hospital, and transit station waiting hall | Fiber and fragment | 1583 ± 1180 N m−3 and 188.7 ± 84.8 N m−3 | PL, PA, PP, PE, PS, PV | 41 |
| Colour | |||||||
| Unreported | |||||||
| Suspended atmospheric microplastics, China (ID air and OD air) | Active sampling | Filter flasks connected by a rubber tube along with a long-neck funnel | Living room and office room | Fiber, bead, and fragment | 16–93 N m−3 | PE, PL, RC, PVC, CO, PP, PUR, RB | 26 |
| Black | |||||||
| Blue, green, white, indigo | |||||||
| Taiwan, ID and OD air samples | Active sampling | Cassettes with the silver membrane filter | Nail salon | Fragment and fiber | 46 ± 55 MPs per m3 and 28 ± 24 MPs per m3 | PUR, PVC, PCL, PEI, PVA, AC, RB | 42 |
| Colour | |||||||
| Unreported | Size < 50 | ||||||
| South Korea (ID air) | Passive sampling | Air samplers | House | Fiber and non-fiber | 0.49–6.64 MPs per m3 | PP, PL, PS, PTFE, PVC, ALK AR, PA, PU, PE | 28 |
| Colour | |||||||
| Unreported | |||||||
| China's IDs and ODs | Passive sampling | Atmospheric deposition | Dining and drinking activities | Fiber and fragment | 105 items per m2 per day | PET, PE, PA, PS, PP | 43 |
| Colour | |||||||
| Unreported | |||||||
| Spiked airborne MPs IDs and ODs, China | Passive sampling | Glass beakers | Washing and ashing | Fiber and fragment | 496.64 N m−2 | PET PE PP PS, PVC | 25 |
| Colour | |||||||
| Unreported | |||||||
| Sunda Strait | Passive sampling | Total suspended atmospheric particulate sampler | N/A | N/A | N/A | N/A | 31 |
| Atmosphere, colour | |||||||
| Unreported | |||||||
| Karimata Strait | Passive atmosphere | Total suspended atmospheric particulate sampler | Fibers | 0–0.8 items per 100 m3 | PET | 31 | |
| Black | 382.15 μm | ||||||
| Pearl River Estuary | Passive sampling atmosphere | Total suspended atmospheric particulate sampler | Fibers | 3–7.7 items per 100 m3 | PET, PP, PA, PEP | 31 | |
| Black, white, red, yellow, brown | 288.2–1117.62 μm | ||||||
| East Indian Ocean | Passive sampling atmosphere | Total suspended atmospheric particulate sampler | Fibers (80%), fragments (20%) | 0–0.8 items per 100 m3 | PET, PP, PAN-AA, PR | 31 | |
| Yellow, black, blue | 58.591–988.37 μm | ||||||
| South China Sea | Passive sampling atmosphere | Total suspended atmospheric particulate sampler | Fibers (75%), fragments (25%) | 0–3.1 items per 100 m3 | PP, PET, PEVA | 31 | |
| Black, yellow, red | 286.10–1861.78 μm | ||||||
| Sri Lanka | Passive sampling atmosphere | Total suspended atmospheric particulate sampler | N/A | N/A | 0 | N/A | 31 |
| Thirty-nine major cities in China. IDs and ODs | Passive sampling two-bed-room apartment | Sampling bags and hog bristle brushes | 39 houses | Fiber | 1550–120,000 mg kg−1 (IDs) and 212–9020 mg kg−1 (ODs) | PET, PC | 39 |
| Colour | |||||||
| Unreported | |||||||
| Airborne fiber particles Beijing OD, China | Passive sampling surface deposited dust and building materials | Mixed cellulose ester mini vol samplers and stainless steel pliers | Building sites, fiber particles from 18 m, 1.5 m above the ground | Fiber | 34.6% and 40.3% | MP and MMMFs fibers (man-made mineral fibers) | 35 |
| 5.7 × 10⁻³ fiber per ml | |||||||
| 4.1 × 10⁻³ fiber per ml | |||||||
| AMPs in total suspended particulates OD | Passive sampling rooftops of buildings | Multi-nozzle cascade impactor sampler | Fiber flow rate of 20 L min−1 | 1 to 20 μm | 1.03 to 14.27 particles per m3 and from 0.63 to 3.29 particles per m3 | PE, PET | 36 |
| Colour | |||||||
| Unreported | |||||||
| Guangzhou, China OD | Passive sampling | Sampler equipped with a 22 L stainless steel bucket | Atmospheric deposition, wet and dry | Fibers, fragments, microbeads, and films | 51–178 m2 | PE, PET | 38 |
| Colour | |||||||
| Unreported | |||||||
| S. no | Concentration of MPs unit | References |
|---|---|---|
| 1 | n m−3 and % | 23 |
| 2 | n (m−2 d−1) | 28 |
| 3 | Particles per m2 per day | 22 |
| 4 | Items per m3 | 32 |
| 5 | Particles per m2 per day | 33 |
| 6 | n m−3 | 41 |
| 7 | n m−3 | 26 |
| 8 | MPs per m3 | 42 |
| 9 | MPs per m3 | 28 |
| 10 | Items per m2 per day | 43 |
| 11 | n m−3 | 25 |
| 12 | Items per 100 m3 | 31 |
| 13 | mg kg−1 | 18 |
| 14 | % and fiber per ml | 35 |
| 15 | Particles per m3 | 36 |
| 16 | Particles per m2 per d | 38 |
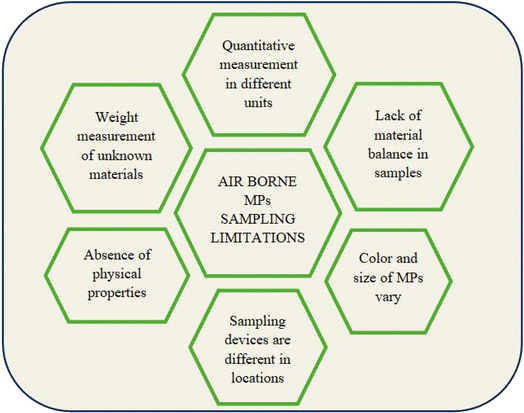
There were a few limitations found among the comprehensive sampling techniques applied in these studies.
(1) Quantitative measurements of MP polymers were reported in different units, N m−3, N m−2 d−1, MPs per g, particles per day, MP per g of dry dust, fibers per m3, particles per m3, and percentage.
(2) Absence of material balance in MPs measurements.
(3) Few polymers are analyzed qualitatively using their color, whereas several are colorless.
(4) Air sampling devices vary for the measurement of ID and ambient air.
(5) Several reports did not provide physical parameters like temperature, pressure, height of the sampling device, humidity, and wind velocities.
(6) Some materials could not be identified in any airborne collected sample, and such materials in the sample were not quantified.
3 Characterization and analysis
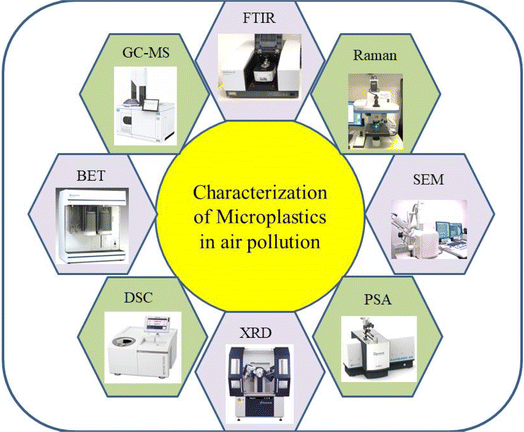
The characteristics of microplastics (MPs) varied widely in terms of polymer type, shape, colour and size based on the origin and geographical locations within the Asian region.44 An understanding of the nature and magnitude of MP pollution in air could be important to assess its potential environmental impacts, including those on human health and economy.45 The subsequent section discusses the various characterization techniques to analyze the MPs found in the air. This section discusses various characterization techniques and analyzes their suitability for assessing MPs in air pollution. Characterization and analysis of MPs in air pollution involve crucial methodologies to understand their sources and impacts. Techniques like Raman spectroscopy analysis (RSA), Fourier transform infrared analysis (FTIR), gas chromatography-mass spectrometry (GCMS), X-ray diffraction (XRD), differential scanning calorimetry (DSC), particle size analysis (PSA), N2-Brunauer–Emmett–Teller surface analysis (BET) and scanning electron microscopy-energy dispersive spectroscopy (SEM-EDS) are utilized for qualitative and quantitative analysis.46,47 MPs are formed through environmental weathering and degradation processes, with properties, aerodynamics, and sources influencing their dispersion in the atmosphere. The presence of MPs in wildlife species, identified through microscopy and spectrometry, highlights their widespread distribution and potential environmental impacts. Standardization of sampling and analysis methods is crucial to assess health risks and effectively monitor MP pollution in the air48,49 (Fig. 8).3.1 Fourier transform infrared spectroscopy (FTIR)
FTIR is a primary characterization technique for analyzing MPs in ID and OD air pollution.50 FTIR is a powerful tool that can identify the chemical composition of MPs by analyzing their molecular structure, aiding in distinguishing different types of plastics present in air samples. This technique has been utilized in studies to characterize airborne MPs in various size ranges, providing insights into the sources and distribution of MPs in different environments. By employing FTIR, researchers can gain a deeper understanding of the types and abundance of MPs present in the air, contributing significantly to the assessment of human exposure to MPs through inhalation.22 Optical microscopy, including stereomicroscopy and polarized light microscopy, enables the visual identification of MPs based on their morphological characteristics. However, it is limited by the size resolution and inability to differentiate between MPs and other particles.It has significant merits in non-destructive analysis; FTIR allows for identifying MPs without destroying the sample, thus preserving it for further analysis. Chemical characterization provides detailed chemical information identifying different types of polymers within MPs. With high sensitivity and specificity, FTIR can detect even minute quantities of MPs with high specificity to different polymer types. This technique offers relatively quick analysis compared to other methods, so it is an efficient technique with immediate spectral results. Advanced FTIR techniques can offer semi-quantitative to quantitative data on MP concentrations. FTIR is adaptable for ID and OD samples, providing consistent results across various environments. FTIR analysis also has some demerits. For instance, MPs may be contaminated with organic or inorganic substances which could interfere with the spectra and complicate identification. Furthermore, FTIR might need help distinguishing MPs of petite sizes, and this is especially true below a few micrometers due to resolution limits. The difference between ID and OD samples is the concentration variability; ID environments often contain higher concentrations of MPs. This is due to human activities and poor ventilation compared to OD settings. Different types of polymers might be prevalent in ID vs. OD environments. This is due to varied sources (e.g., textiles and household items vs. industrial and vehicular emissions). ID samples may contain more diverse and complex contaminants (dust, organic compounds). These can affect FTIR analysis differently than OD samples. Overall, FTIR for MPs in air pollution offers high specificity and sensitivity where it faces challenges with contaminant interference and cost, and notable differences include concentration.
Fig. 9 demonstrates the utility of FTIR in identifying polymer types based on their molecular vibrations and bonding characteristics. However, sample thickness and preparation might influence the technique's effectiveness. Each polymer exhibits distinct functional group absorbance peaks, facilitating their identification. The spectral features are observed consistently across different thicknesses, indicating reliable FTIR characterization. PP shows C–H stretching (aliphatic) characteristics at 2950–2838 cm−1 and C–H bending at 1453–1375 cm−1. PE exhibits C–H stretching (aliphatic) at 2914–2848 cm−1 and C–H bending at 1463 cm−1. PET displays C![[double bond, length as m-dash]](https://www.rsc.org/images/entities/char_e001.gif) O stretching at 1712 cm−1, C–O stretching at 1240–1092 cm−1, and C–H stretching (aliphatic) at 2964 cm−1. PA shows N–H stretching at 3292 cm−1, C–N + C
O stretching at 1712 cm−1, C–O stretching at 1240–1092 cm−1, and C–H stretching (aliphatic) at 2964 cm−1. PA shows N–H stretching at 3292 cm−1, C–N + C![[double bond, length as m-dash]](https://www.rsc.org/images/entities/char_e001.gif) O at 1635 cm−1, and N–H bending at 1542 cm−1. PS displays C–H stretching (phenyl) at 2918 cm−1, C–H bending at 1491–1450 cm−1, and aromatic stretching at 3024 cm−1 and 1600 cm−1. PVC shows C–Cl stretching at 684 cm−1 and aliphatic C–H stretching at around 2912 cm−1.
O at 1635 cm−1, and N–H bending at 1542 cm−1. PS displays C–H stretching (phenyl) at 2918 cm−1, C–H bending at 1491–1450 cm−1, and aromatic stretching at 3024 cm−1 and 1600 cm−1. PVC shows C–Cl stretching at 684 cm−1 and aliphatic C–H stretching at around 2912 cm−1.
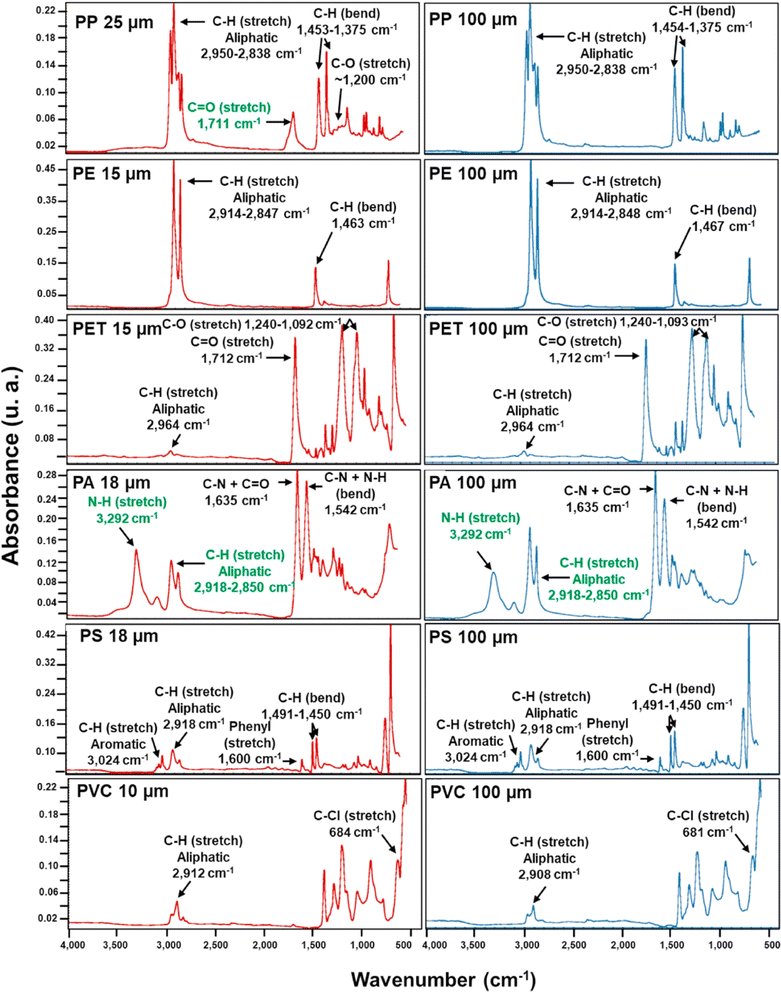 | ||
| Fig. 9 Attenuated total reflectance Fourier transform infrared (ATR FT-IR) spectra of polypropylene (PP), polyethylene (PE), polyethylene terephthalate (PET), polyamide (PA), polystyrene (PS), and polyvinyl chloride (PVC) (License: Under Creative Commons CC-BY).51 | ||
3.2 Raman spectroscopy analysis (RSA)
RSA has been utilized in various studies to characterize MPs in air pollution. RSA provides chemical information about MPs by measuring the vibrational modes of molecular bonds. It offers high spatial resolution and can identify MPs even in complex environmental matrices.52 Levermore et al. in 2020 (ref. 52) optimized Raman spectral imaging for identifying MPs in ambient particulate matter, recommending chemometric techniques for analysis.53 Additionally, Yoo et al. employed Raman microspectrometry (RMS) in combination with other techniques to analyze inhalable airborne microplastics (AMPs) in ambient PM10 aerosols, providing detailed morphological and spectroscopic characteristics of individual AMPs.53 Perera et al. characterized suspected AMPs, highlighting the dominance of fibers and fragments IDs and ODs, with polyethylene terephthalate being a prominent type, suggesting textile fibers as a significant source of AMPs in Sri Lanka.54 Furthermore, Wright et al.55 developed a filter-based sampling method compatible with Raman spectral imaging for detecting inhalable-sized MPs, facilitating the acquisition of inhalable MP concentrations in air pollution samples.There are significant advantages of performing RSA that can accurately identify and characterize various MPs. This includes those with complex polymer matrices. RSA does not require destroying samples, preserving them for further analysis, and providing detailed chemical Identification. This allows for the differentiation of polymers even when they are chemically similar. Raman microscopy can attain high spatial resolution, making it suitable for analyzing MPs at microscopic scales. The major limitation in RSA is that many samples cause fluorescence, so it can overshadow the Raman signal, which complicates analysis. RSA may only be suitable for oversized or opaque samples, limiting its use in some scenarios. Technological advances have sped up RSA, but it is still time-consuming for vast numbers of samples. ID air may have more varied MPs due to everyday human activities and materials like carpets and textiles. OD air MPs might include more environmental and industrial sources. Generally, MPs might be more concentrated IDs due to confined spaces and less air exchange than in OD environments. ID samples may have more volatile organic compounds (VOCs) that could interfere with analysis, whereas OD samples present more particulate matter from natural sources. Understanding these may help tailor RSA methods for specific environments, improving the accuracy and efficiency of MP analysis in air pollution. Fig. 10 demonstrates the Raman spectra for the fingerprint and C–H stretching regions of alkyls, alkenes, and aromatic protons for the various polymers, including PS, PC, PP, PE, and so on. These shifts, measured in cm−1, help identify and differentiate between polymers based on their unique molecular vibrations. The “fingerprint” region provides distinct spectral signatures, while the C–H stretching frequencies are common but still distinctive for each polymer. This information is crucial for applications like MP analysis in environmental studies, where accurate identification of polymer types is essential. The data assist researchers in using Raman spectroscopy effectively for polymer characterization.
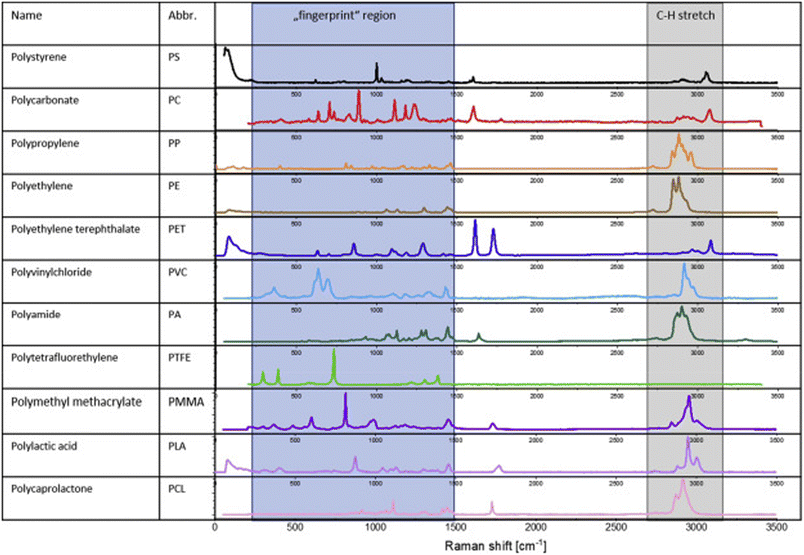 | ||
| Fig. 10 RSA of polymers' fingerprint region and region for C–H stretching modes of alkyls, alkenes, and aromatic protons (License: Under Creative Commons CC-BY).56 | ||
3.3 X-ray diffraction (XRD)
XRD is another significant technique that aids in analyzing MPs in air pollution. XRD is a crucial material characterization technique that can provide valuable insights into the crystal structure, size, orientation, phase identification, and quantification of materials.57 By applying XRD, the researchers can better understand the composition and characteristics of airborne MPs, aiding in identifying the sources, levels, and behavior of these pollutants in the atmosphere.58,59 Furthermore, the future integration of artificial intelligence and machine learning tools with XRD, as suggested in ref. 60, can enhance the accuracy and effectiveness of MP analysis, contributing to the development of comprehensive strategies for mitigating the impact of airborne MPs on human health and the environment. The advantage of XRD is identifying crystalline phases of MPs, which helps distinguish between different polymer types. The non-destructive technique allows the samples to be preserved for further analysis and provides quantitative insights. This information pertains to crystalline content within mixed samples. Its sensitivity is valuable when MPs are present in a variety of environments. XRD is ineffective for amorphous plastic materials; this constitutes a significant portion of MPs. The interpretation of diffraction patterns can be complex and requires skilled analysts. XRD may need help with very small MPs as particle size below a certain threshold may not produce distinct diffraction patterns. There are differences between ID and OD samples. ID MPs may come from textiles, furnishings and domestic products. OD MPs often originate from industrial emissions, vehicle wear, and degraded litter. UV exposure and interaction with other pollutants complicate XRD analysis compared to relatively controlled ID environments. OD samples may contain more complex matrices due to soil and biological contaminants. ID samples might require different pre-treatment steps to isolate MPs effectively. XRD's efficacy in identifying MPs in various environments depends significantly on these factors.Fig. 11 illustrates the intensity (counts) versus diffraction angle (2θ, in degrees) for various polymers. Peaks at specific angles correspond to the crystalline structures of these polymers, with higher intensities indicating more ordered regions. PP and PA show the best overall mechanical strength due to their high crystallinity. At the same time, PE and PET offer a good balance, and PS and PVC are chosen for specific properties such as thermal insulation and chemical resistance, respectively. These peaks' presence and position help identify and characterize the polymers, determine crystallinity, and analyze structural properties. This data is essential for understanding the material's properties and suitability for various applications, including environmental and industrial contexts.
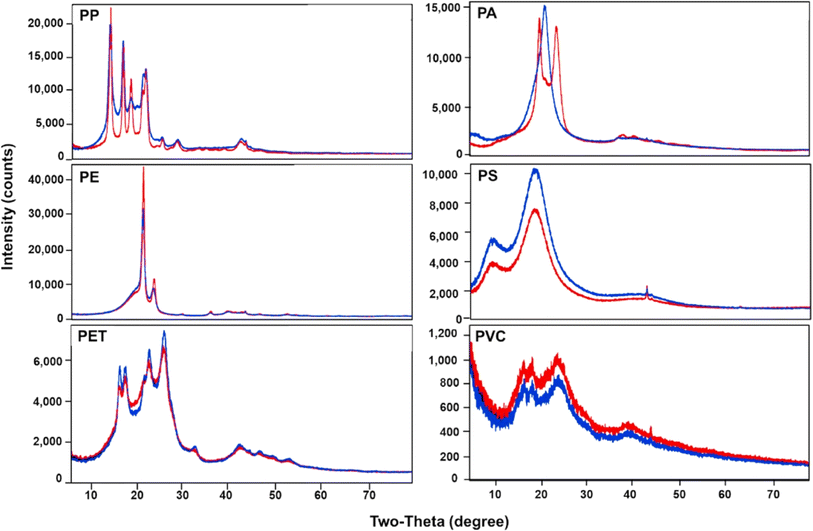 | ||
| Fig. 11 XRD pattern of PP, PE, PET, PA, PS, and PVC; red refers to small particles and blue refers to large particles (License: Under Creative Commons CC-BY).51 | ||
3.4 Scanning electron microscopy-energy dispersive spectroscopy (SEM-EDS)
The SEM-EDS techniques have been pivotal in analyzing MPs in both ID and OD air pollution. Yoo et al. (2023)53 demonstrated the efficient characterization of inhalable airborne microplastics (AMPs) in ambient PM10 aerosols using a combination of fluorescence microscopy, Raman microspectrometry (RMS), and SEM/EDX. Similarly, Gonzalez-Rocha et al. (2023)61 utilized SEM-EDS for elemental chemical characterization and morphology analysis of PM10 samples from air quality monitoring campaigns. Furthermore, Kim et al. (2022)62 highlighted the importance of SEM-EDS in speciation analysis of particulate matter generated by open burning activities. Tsai et al. (2019)63 applied SEM/EDS to study colloid diffusion in geological environments, estimating the diffusion coefficient for gold colloids. Additionally, SEM-EDS analysis emphasized the challenges of small particles. A methodology was proposed that combined multiple techniques for improved diagnostics on substrates with background elements, showcasing the versatility and significance of SEM-EDS techniques in various environmental studies.53,62SEM-EDS offers high-resolution imaging, which enables detailed morphological analysis of MPs down to nanometer scales. EDS provides elemental analysis and identifies the chemical composition of MPs, clearly distinguishing different types of plastics and quantifying the presence of various elements. This facilitates an understanding of pollutant sources and effects. Typically, SEM-EDS is non-destructive, which could preserve samples for additional analyses. Moreover, this technique is effective for various sample matrices (e.g., air filters) and integrates imaging with compositional analysis. This analysis required meticulous sample preparation to avoid contamination and ensure representative results. High initial investment and operational costs are involved for SEM-EDS instruments and skilled personnel are required to operate the equipment. This might lead to non-representative data if samples are heterogeneous and analysis is limited to small sample sizes due to instrument constraints. ID MPs typically originate from activities such as textile shedding and household dust, while OD MPs could include a mix of traffic, industry, and broader environmental sources. OD samples might be more complex due to higher particulate diversity influenced by wind and atmospheric conditions, potentially complicating SEM-EDS analysis. ID samples face a higher risk of contamination during sample collection and preparation due to enclosed environments. Efficient and accurate application of SEM-EDS for MPs in air pollution requires consideration of these factors for reliable data interpretation and subsequent impact assessment.
Fig. 12 displays SEM images of the MPs that have mostly irregular surface morphologies observed in these samples' large PET and small PA sizes. Furthermore, a rough surface was noted for small PVC and PP, as well as for both sizes of PE, in terms of surface morphology. The results demonstrated that smooth surfaces were a characteristic of PET, PS, and PA (all sizes) and large PP. The presence of a carbonyl functional group in the FT-IR spectra of small PP particles, along with the identified scent, suggested the existence of a grafting agent, which could explain the difference in surface morphologies between minor PP (rough) and large PP (smooth). Spherical in shape and appearing spongy on the surface, little PVC was described. The material has good potential for organic compound adsorption based on its tiny particle size and spongy surface shape.
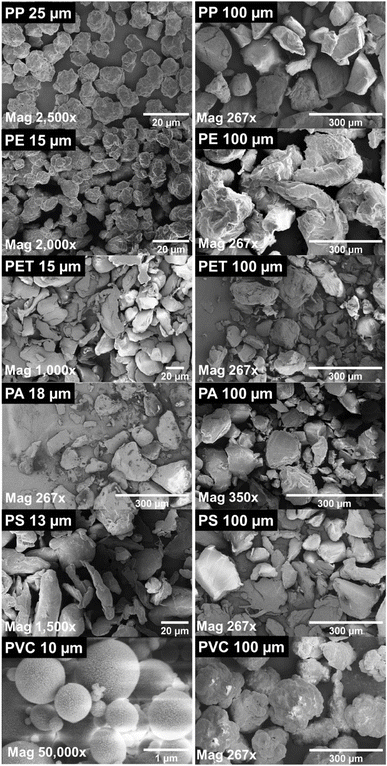 | ||
Fig. 12 SEM images of PP, PE, PET, PA, PS, and PVC with the magnification of the images ranging from 297× to 50![[thin space (1/6-em)]](https://www.rsc.org/images/entities/char_2009.gif) 000× (License: Under Creative Commons CC-BY).51 000× (License: Under Creative Commons CC-BY).51 | ||
3.5 Gas chromatography-mass spectrometry (GC-MS)
As reported in the literature, the GC-MS techniques have been extensively utilized in analyzing MPs in air pollution. Py-GC/MS thermally degrades MPs into volatile compounds, which are then analyzed using gas chromatography-mass spectrometry. This technique provides detailed information about polymer composition and is valuable for source apportionment studies.64 GC-MS and other mass spectrometric methods play a crucial role in identifying and quantifying MPs in different environmental matrices.65,66 These techniques enable the characterization of MPs based on their chemical composition, aiding in understanding the sources and levels of MPs in the atmosphere. The application of GC-MS in combination with pyrolysis has proven effective in verifying the composition of filter residues from washing effluents, demonstrating the presence of microfibers released during the washing process.64 Furthermore, GC-MS techniques have been instrumental in the multimodal analysis of MPs in food matrices, offering improved detection capabilities and aiding in assessing human exposure levels.67 The use of GC-MS in analyzing MPs in air pollution showcases its significance in advancing research on MP pollution and its potential impact on human health and the environment. GC-MS can accurately identify and quantify various chemical compounds within MP samples. It provides detailed chemical composition information, which includes identifying additives and contaminants in MPs. This requires extensive sample preparation to remove non-plastic materials, including extraction and purification. It has high operational costs and a time-consuming nature of analysis.3.6 Particle size analysis (PSA)
PSA techniques have been crucial in studying MPs in air pollution. Studies have utilized various methods, such as laser light diffraction, morphological imaging, and dynamic light scattering (DLS), to characterize the size distribution of MPs.53,55 For instance, fluorescence microscopy, RMS, and SEM/EDS have been combined to analyze inhalable airborne MPs in ambient PM10 aerosols, providing detailed insights into the characteristics of these particles.53 Additionally, Nile red staining has allowed for estimating plastic burdens in air samples, revealing the presence of fragmented, spherical, and fibrous plastic particles in the respirable fraction of ID environments.68 Furthermore, μFTIR analysis has been employed to detect and quantify MPs in routine air quality monitoring activities, highlighting the prevalence of nylon and polypropylene as the most abundant polymers in air samples. These diverse techniques have significantly contributed to understanding the presence and characteristics of MPs in air pollution, laying the groundwork for future research and risk assessment in this emerging field. PSA provides detailed information on the size distribution of MP particles. This is crucial for understanding their behavior and fate in the environment. It is capable of analyzing a large number of samples. PSA does not provide information on the chemical composition of particles like dynamic light scattering or microscopy. Therefore, these also have limitations in terms of size range and detection limit. Fig. 13 shows the various MPs and their sizes from the laser diffraction particle size analysis.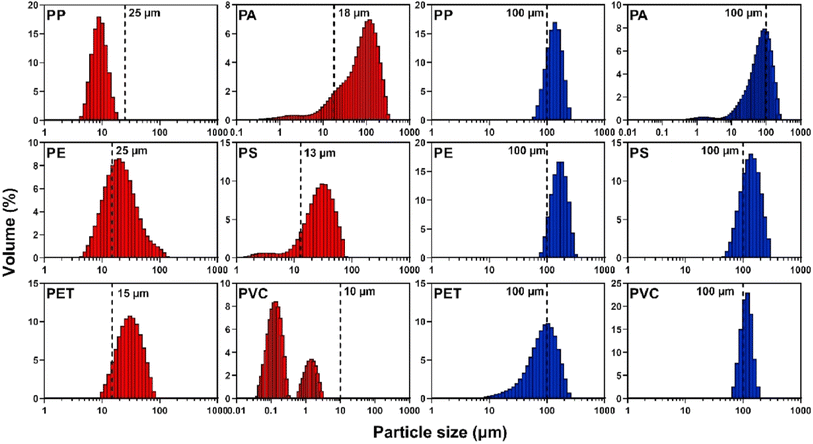 | ||
| Fig. 13 PSA from the laser diffraction: polymers are PP, PE, PET, PA, PS, and PVC. Red = ‘small’ particles; blue = ‘large’ particles. The vertical dashed line represents the particle size as described by the supplier (License: Under Creative Commons CC-BY).51 | ||
Larger particles generally have higher volume percentages across all polymers. PP has 25 μm and 100 μm particles and volume percentages are higher for larger particles, indicating a broad size distribution. PA has 18 μm and 100 μm particles, similar to those of PP, and larger particles have higher volume percentages. PE has 25 μm and 100 μm particles and shows a consistent size distribution with notable volume percentages across particle sizes. PS has 13 μm and 100 μm particles where volume percentages increase with larger particle sizes, showing a wide distribution. PET has 15 μm and 100 μm particles which exhibit a balanced size distribution. PVC has 10 μm and 100 μm particles which display a significant volume percentage at smaller particle sizes. PE and PET polymers show balanced distributions, making them easier to analyze using multiple characterization techniques. PP and PS show broad size distributions, which may require specific techniques like PSA for accurate characterization. PVC with smaller particle sizes shows significant volume percentages, making techniques like FTIR and Raman spectroscopy ideal for detailed analysis.
3.7 Differential scanning calorimetry (DSC)
DSC techniques have been instrumental in analyzing MPs in ID and OD air pollution. Studies have utilized DSC to characterize the thermal properties of MPs, aiding in their identification and understanding of their behavior in different environments. Perera et al. (2024)54 highlighted the dominance of polyethylene terephthalate and polyester MPs IDs, potentially originating from textile fibers. Jenner et al. (2015)68 emphasized the abundance of nylon and polypropylene MPs in OD air, with prevalent small fragment sizes. Wright and Borm (2018)55 discussed the importance of DSC in assessing the bio-persistence and toxicity of MPs, which is crucial for understanding health risks. Kacprzak and Tijing (2022)58 underscored the need for advanced testing methods, like DSC, to evaluate the impact of airborne MPs on human health and the environment. Overall, DSC techniques play a vital role in characterizing MPs in air pollution, offering valuable insights into their composition and potential risks.54,58,68DSC aids in determining the melting temperatures and crystallinity of polymers. This further identifies different types of plastics, which help characterize the thermal behavior of polymers. In addition, this includes the presence of additives and degradation products. Importantly, it is not challenging to analyze complex mixtures of different types of MPs without prior separation and also requires well-prepared homogeneous samples for accurate results. The provided image illustrates the heat flow (W g−1) versus temperature (°C) for various polymers (PP, PE, PET, PA, PS, PVC) at different particle sizes (15–100 μm), revealing critical insights into their thermal properties. For PP, the larger 100 μm particles exhibit a higher enthalpy change (ΔHm) and melting point (Tm), indicating superior thermal stability compared to the 25 μm particles. PE shows minimal differences in thermal properties between the 15 μm and 100 μm sizes. In contrast, PET displays lower ΔHm for 100 μm particles, suggesting decreased crystallinity relative to 15 μm particles. PA and PVC maintain consistent thermal properties across different sizes, while PS demonstrates complex thermal behavior with multiple glass transition temperatures (Tg) at 100 μm. Overall, larger particle sizes in PP and PE are advantageous for thermal stability, whereas PET shows reduced crystallinity at larger sizes, and PA and PVC are stable across sizes. PS's complexity at larger sizes warrants further investigation. Fig. 14 displays different plastics' DSC results from the literature.
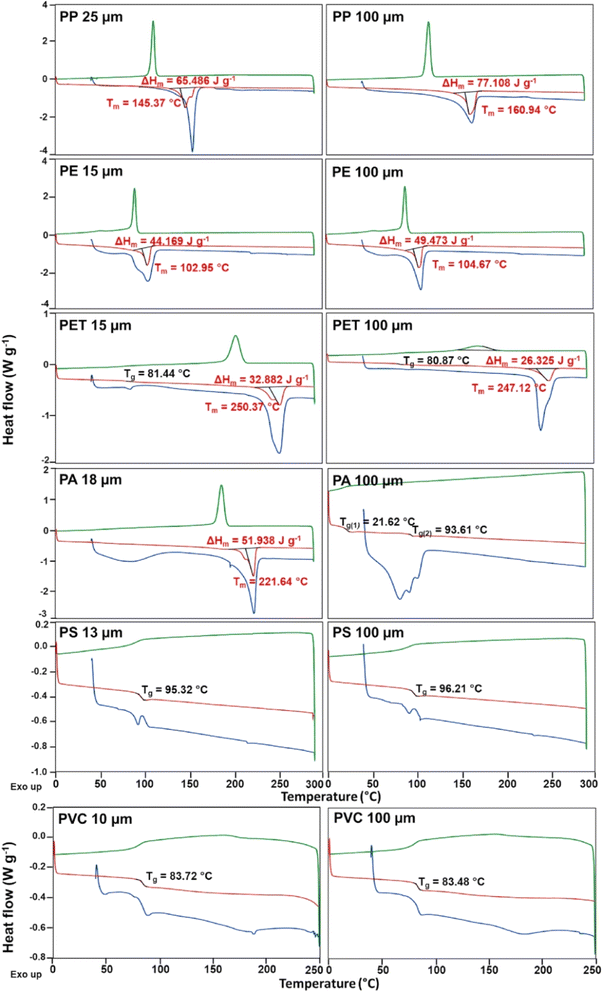 | ||
| Fig. 14 DSC results of PP, PE, PET, PA, PS, and PVC (License: Under Creative Commons CC-BY).51 | ||
3.8 N2-Brunauer–Emmett–Teller surface analysis (BET)
The BET technique has been used for analyzing MPs in air pollution. Studies have utilized this method to determine the surface area, concentration and characteristics of MPs, providing valuable insights into their presence and distribution.68 By combining BET analysis with other techniques like fluorescence microscopy, RMS, and SEM, researchers have efficiently characterized inhalable airborne microplastics (AMPs) in ambient PM10 aerosols, shedding light on their physicochemical properties and sources.53 Furthermore, the BET technique has enabled the measurement of total particles in the atmosphere, including MPs, highlighting the abundance of nylon and polypropylene as the most prevalent polymers in air samples. These findings underscore the importance of BET techniques in understanding atmospheric MPs' prevalence, distribution, and potential health implications, emphasizing the need for further research and policy interventions to mitigate plastic pollution risks.13As mentioned in the literature the surface area measurement provides accurate surface area and porosity information. This can be useful for understanding the adsorption properties of MPs by studying the surface roughness and specific surface area of MP particles.
BET analysis does not provide direct chemical or compositional information about MPs and requires dry and adequately prepared samples. These may not always effectively represent MPs found in environmental samples. The characterization of MPs choosing appropriate analytical techniques depends on the specific requirements of the study. This includes the type of MP, their sources, and their environmental context (ID vs. OD). Each technique offers valuable insights. However, it also has limitations that must be considered in the holistic analysis of MPs in air pollution. Table 3 demonstrates the comparative analysis of different characterization techniques for MPs.
| Technique | Major positives | Major negatives | References |
|---|---|---|---|
| FTIR | Identifies chemical bonds and functional groups in MPs | Limited to surface analysis | 69 |
| Non-destructive | Difficulty in detecting additives and minor components | ||
| Can analyze solid, liquid, and gaseous MP samples | Requires extensive sample preparation | ||
| Raman spectroscopy | Provides molecular fingerprint | Fluorescence interference | 70 |
| Minimal sample preparation | High cost of equipment | ||
| Non-destructive and effective for opaque samples | Lower sensitivity for specific polymers | ||
| XRD | Determines the crystalline structure of MPs | Limited to crystalline materials | 60 |
| Quantitative phase analysis | Requires a relatively large sample size | ||
| Non-destructive | Inability to analyze amorphous polymers effectively | ||
| SEM-EDS | Provides detailed morphology and topography of MPs | Sample preparation may alter MPs | 63 |
| Elemental analysis of the sample | Destructive | ||
| High resolution | Vacuum requirements may affect some samples | ||
| GC-MS | Identifies and quantifies organic compounds | Destructive | 64 |
| High sensitivity and specificity | Requires extensive sample preparation | ||
| Effective for additive analysis | Expensive and time-consuming | ||
| PSA | Determines particle size distribution | Limited information on particle composition | 55 |
| Fast and relatively simple | |||
| Non-destructive | It cannot differentiate between different types of MPs. Requires dispersing agents | ||
| DSC | Measures thermal properties and transitions of MPs | Destructive. Limited to thermal analysis | 42 and 67 |
| Identifies polymer types by melting points | Requires calibration and standard samples | ||
| BET | Measures surface area and porosity | Destructive. Requires outgassing of samples | 33 and 38 |
| Provides information on the adsorption properties of MPs | Limited to dry samples |
MPs in the <1 μm to 1 mm size range are small and complex in composition. Several advanced techniques, such as RSA, FTIR, SEM-EDS, and GC-MS, are recommended to characterize these tiny particles. 1 mm to 5 mm size MPs are easier to handle and analyze with XRD and PSA techniques that allow for detailed structural and compositional characterization. Combined, these methods offer a thorough understanding of MPs' distribution, composition, and structure, enabling improved comprehension and control of their environmental influence.
4 Conclusions
MP sampling in ID and ambient air has been summarized in this study. The emerging contaminant MPs were sampled through active and passive sampling methods in ID and ambient air environments. Qualitative and quantitative analytical tools were used to characterize the MPs sampled. Significant conventional analytical techniques such as XRD, FTIR, BET, DSC, GCMS, SEM-EDS, RSA, and PSA were discussed in the literature. A concise summary of sampling tools and analytical characterization techniques reported in Asian countries has been provided.Furthermore, national and international regulatory authorities actively strive to establish definitive permissible thresholds or crucial concentrations of MPs in ID and OD air. The increasing presence of research organizations and publications highlights the pressing nature of such guidelines. While MPs are technically classified under the particulate matter (PM) pollutant group, their distinct characteristics and potential implications necessitate heightened scrutiny within pollution management. The research underscores the immediate necessity for action, standardized procedures, and stringent regulations to effectively confront the challenges posed by MP pollution and safeguard public health and ecosystems.
Data availability
Comprehensive data for this review article are available from the author upon reasonable request.Author contributions
Sivamani Sivalingam, P. Gomathi Priya, Shanthana Lakshmi, Srinivas Srimath Tirumala Gudimella: all the authors equally contributed to conceptualization, methodology, data curation, original draft writing, and revision.Conflicts of interest
The authors declare there is no conflict of interest.Acknowledgements
The authors would like to thank Rajalakshmi Engineering College (Autonomous), Thandalam, Chennai, India, A.C.Technology and Anna University, Chennai, India for supporting the present work.References
- S. Wieland, A. Balmes, J. Bender, J. Kitzinger, F. Meyer, A. F. Ramsperger, F. Roeder, C. Tengelmann, B. H. Wimmer, C. Laforsch and H. Kress, J. Hazard. Mater., 2022, 428, 128151 CrossRef CAS PubMed.
- X. Yao and X. Luo, Environ. Sci.: Atmos., 2022, 2, 921–942 Search PubMed.
- A. L. Andrady and M. A. Neal, Philos. Trans. R. Soc. London, Ser. B, 2009, 364(1526), 1977–1984 CrossRef CAS PubMed.
- F. D. B. De Sousa, Recycling, 2020, 5, 1–17 CrossRef.
- N. U. Benson, D. E. Bassey and T. Palanisami, Heliyon, 2021, 7, e06343 CrossRef CAS PubMed.
- P. J. Landrigan, H. Raps, M. Cropper, C. Bald, M. Brunner, E. M. Canonizado, D. Charles, T. C. Chiles, M. J. Donohue, J. Enck, P. Fenichel, L. E. Fleming, C. Ferrier-Pages, R. Fordham, A. Gozt, C. Griffin, M. E. Hahn, B. Haryanto, R. Hixson, H. Ianelli, B. D. James, P. Kumar, A. Laborde, K. L. Law, K. Martin, J. Mu, Y. Mulders, A. Mustapha, J. Niu, S. Pahl, Y. Park, M.-L. Pedrotti, J. A. Pitt, M. Ruchirawat, B. J. Seewoo, M. Spring, J. J. Stegeman, W. Suk, C. Symeonides, H. Takada, R. C. Thompson, A. Vicini, Z. Wang, E. Whitman, D. Wirth, M. Wolff and A. K. Yousuf, Ann. Glob. Health, 2023, 89, 23 CrossRef PubMed.
- P. Murugan, P. Sivaperumal, S. Balu and S. Arya, RSC Adv., 2023, 13, 36223–36241 RSC.
- M. Bergmann, F. Collard, J. Fabres, G. W. Gabrielsen, J. F. Provencher, C. M. Rochman, E. van Sebille and M. B. Tekman, Nat. Rev. Earth Environ., 2022, 3, 323–337 CrossRef CAS.
- S. Sharma and S. Mallubhotla, in Zero Waste, 2019, p. 9 Search PubMed.
- F. D. B. de Sousa, Cambridge Prism.: Plast., 2024, 2, 1–12 Search PubMed.
- L. Maurizi, L. Simon-Sanchez, A. Vianello, A. H. Nielsen and J. Vollertsen, Chemosphere, 2024, 361, 142553 CrossRef CAS PubMed.
- A. Baldelli, Meas.: Sens., 2021, 17, 100059 Search PubMed.
- A. P. L. Abad, J. Trilleras, V. A. Arana, L. S. Garcia-alzate and C. D. Grande-tovar, RSC Adv., 2023, 13, 7468–7489 RSC.
- E. Noklebye, H. N. Adam, A. Roy-Basu, G. K. Bharat and E. H. Steindal, Environ. Sci. Policy, 2023, 139, 219–227 CrossRef.
- P. Chitra and M. Gobindgarh, Indian J. Waste Manage., 2022, 6, 61–70 Search PubMed.
- L. T. Hofstede, G. F. Vasse and B. N. Melgert, Cambridge Prism.: Plast., 2023, 1, 1–12 CrossRef.
- C. Napoli, V. Marcotrigiano and M. T. Montagna, BMC Public Health, 2012, 12, 1 CrossRef PubMed.
- C. Liu, J. Li, Y. Zhang, L. Wang, J. Deng, Y. Gao, L. Yu, J. Zhang and H. Sun, Environ. Int., 2019, 128, 116–124 CrossRef CAS PubMed.
- R. Dris, J. Gasperi, C. Mirande, C. Mandin, M. Guerrouache, V. Langlois and B. Tassin, Environ. Pollut., 2017, 221, 453–458 CrossRef CAS PubMed.
- R. Dris, J. Gasperi, M. Saad, C. Mirande and B. Tassin, Mar. Pollut. Bull., 2016, 106, 290–293 CrossRef PubMed.
- R. Dris, J. Gasperi, V. Rocher, M. Saad, N. Renault and B. Tassin, Environ. Chem., 2015, 12, 592–599 CrossRef CAS.
- L. Cai, J. Wang, J. Peng, Z. Tan, Z. Zhan, X. Tan and Q. Chen, Environ. Sci. Pollut. Res., 2017, 24, 24928–24935 Search PubMed.
- K. Liu, X. Wang, N. Wei, Z. Song and D. Li, Environ. Int., 2019, 132, 105127 Search PubMed.
- Z. Liao, X. Ji, Y. Ma, B. Lv, W. Huang, X. Zhu, M. Fang, Q. Wang, X. Wang, R. Dahlgren and X. Shang, J. Hazard. Mater., 2021, 417, 126007 CrossRef CAS PubMed.
- Z. Song, K. Liu, X. Wang, N. Wei, C. Zong, C. Li, C. Jiang, Y. He and D. Li, Sci. Total Environ., 2021, 754, 142118 CrossRef CAS PubMed.
- Y. Xie, Y. Li, Y. Feng, W. Cheng and Y. Wang, Environ. Int., 2022, 162, 107151 CrossRef CAS PubMed.
- H. Chen, X. Zou, Y. Ding, Y. Wang, G. Fu and F. Yuan, Anthr. Coasts, 2022, 5, 1–11 CrossRef.
- D. Choi, S. Jung, J. Lee and E. E. Kwon, Energy Environ., 2024, 0958305X241230616, DOI:10.1177/0958305X241230616.
- Z. Ouyang, R. Mao, E. Hu, C. Xiao, C. Yang and X. Guo, Gondwana Res., 2022, 108, 193–199 CrossRef CAS.
- Y. Zhang, S. Kang, S. Allen, D. Allen, T. Gao and M. Sillanpa, Earth-Sci. Rev., 2020, 203, 103118 CrossRef CAS.
- X. Wang, C. Li, K. Liu, L. Zhu, Z. Song and D. Li, J. Hazard. Mater., 2020, 389, 121846 Search PubMed.
- K. Sharaf Din, M. F. Khokhar, S. I. Butt, A. Qadir and F. Younas, Sci. Total Environ., 2024, 908, 168398 Search PubMed.
- S. Nandi, R. N. Kumar, A. Dhandapani and J. Iqbal, Environ. Pollut., 2024, 346, 123543 Search PubMed.
- S. Abbasi, A. Turner, R. Sharifi, M. J. Nematollahi, M. Keshavarzifard and T. Moghtaderi, Build. Environ., 2022, 207, 108562 CrossRef.
- Y. Li, L. Shao, W. Wang, M. Zhang, X. Feng, W. Li and D. Zhang, Sci. Total Environ., 2020, 705, 135967 Search PubMed.
- N. A. A. Hidayat, K. Kitano, Y. Tani, P. Lestari, W. Iriana, Y. Fujii, H. Okochi and Y. Niida, E3S Web Conf., 2024, 485, 1–12 Search PubMed.
- S. Dehghani, F. Moore and R. Akhbarizadeh, Environ. Sci. Pollut. Res., 2017, 24, 20360–20371 CrossRef CAS PubMed.
- Y. Huang, T. He, M. Yan, L. Yang, H. Gong, W. Wang, X. Qing and J. Wang, J. Hazard. Mater., 2021, 416, 126168 CrossRef CAS PubMed.
- K. Liu, T. Wu, X. Wang, Z. Song, C. Zong, N. Wei and D. Li, Environ. Sci. Technol., 2019, 53, 10612–10619 Search PubMed.
- L. Cai, J. Wang, J. Peng, Z. Tan, Z. Zhan, X. Tan and Q. Chen, Environ. Sci. Pollut. Res., 2017, 24, 24928–24935 CrossRef PubMed.
- Z. Liao, X. Ji, Y. Ma, B. Lv, W. Huang, X. Zhu, M. Fang, Q Wang, X. Wang, R. Dahlgren and X. Shang, J. Hazard. Mater., 2021, 417, 126007 CrossRef CAS PubMed.
- E. Y. Chen, K. T. Lin, C. C. Jung, C. L. Chang and C. Y. Chen, Sci. Total Environ., 2022, 806, 151472 CrossRef CAS PubMed.
- M. Fang, Z. Liao, X. Ji, X. Zhu, Z. Wang, C. Lu, C. Shi, Z. Chen, L. Ge, M. Zhang, R. A. Dahlgren and X. Shang, J. Hazard. Mater., 2022, 432, 128674 CrossRef CAS PubMed.
- P. Kumar, Y. Inamura, P. N Bao, A. Abeynayaka, R. Dasgupta and H. D. L. Abeynayaka, Water, 1737, 18AD(14), 18 Search PubMed.
- M. Ahmad, J. Chen, M. T. Khan, Q. Yu, W. Phairuang, M. Furuuchi, S. W. Ali, A. Nawab and S. Panyametheekul, Emerging Contam., 2023, 9, 100233 CrossRef CAS.
- Q. Wang, Y. Yamada, C. E. Enyoh, W. Wang and K. Sankoda, Nanomaterials, 2024, 14, 1030 Search PubMed.
- C. Fang, O. S. Awoyemi, G. Saianand, L. Xu, J. Niu and R. Naidu, J. Hazard. Mater., 2024, 464, 132969 Search PubMed.
- H.-F. Joaquin, P.-P. Esneyder and T. Jorge, Sustainability, 2022, 14(20), 13613 CrossRef.
- X. Zhai, H. Zheng, Y. Xu, R. Zhao, W. Wang and H. Guo, Heliyon, 2023, 9, e15901 CrossRef CAS PubMed.
- M. A. Porras-Rojas, C. Charry-Vargas, J. L. Munoz-Yustres, P. Martinez-Silva and L. D. Gómez-Mendez, Microplastics, 2023, 2, 255–267 CrossRef.
- D. S. Moura, C. J. Pestana, C. F. Moffat, J. Hui, J. T. S. Irvine and L. A. Lawton, Chemosphere, 2023, 331, 138691 CrossRef CAS PubMed.
- J. M. Levermore, T. E. L. Smith, F. J. Kelly and S. L. Wright, Anal. Chem., 2020, 92, 8732–8740 CrossRef CAS PubMed.
- H. Yoo, M. Kim, Y. Lee, J. Park, H. Lee, Y.-C. Song and C.-U. Ro, Anal. Chem., 2023, 95, 8552–8559 CrossRef CAS PubMed.
- K. Perera, S. Ziajahromi, S. B. Nash, P. M. Manage and F. D. L. Leusch, Environ. Sci. Technol., 2022, 56, 16676–16685 Search PubMed.
- S. Wright and P. J. A. Borm, Front. Public Health, 2022, 10, 1–8 Search PubMed.
- P. M. Anger, E. Von Der Esch, T. Baumann, M. Elsner, R. Niessner and N. P. Ivleva, Trends Anal. Chem., 2018, 109, 214–226 Search PubMed.
- N. H. Ly, M. K. Kim, H. Lee, C. Lee, S. J. Son, K. D. Zoh, Y. Vasseghian and S. W. Joo, J. Nanostruct. Chem., 2022, 12, 865–888 Search PubMed.
- S. Kacprzak and L. D. Tijing, J. Environ. Chem. Eng., 2022, 10, 107359 CrossRef CAS.
- X. Peng, J. Zhou, S. Guo, G. Chen and Z. Zhu, in Comprehensive Analytical Chemistry, Elsevier, Amsterdam, The Netherlands, 2023, pp. 17–31 Search PubMed.
- A. Ali, Y. W. Chiang and R. M. Santos, Minerals, 2022, 12(2), 205 Search PubMed.
- S. N. Gonzalez-Rocha, E. S. Perez, R. E. C. Bermudez, L. R. Velasco, I. P. Mendez, R. A. Baca, J. J. S. Quiroz and R. R. Cortes, Braz. Appl. Sci. Rev., 2023, 7, 2–20 CrossRef.
- T. H. Kim, B. H. Choi, C. S. Yoon, Y. K. Ko, M. S. Kang and J. Kook, Atmosphere, 2022, 13(2), 260 CrossRef CAS.
- T. L. Tsai, Y. H. Shih, L. C. Chen, S. C. Tsai, I. H. Lee, C. P. Lee and T. Y. Su, J. Radioanal. Nucl. Chem., 2019, 322, 1803–1808 CrossRef CAS.
- N. Dimitrov, M. Curlin, T. Pusic and B. Vojnovic, Separations, 2022, 9, 1–19 Search PubMed.
- M. Velimirovic, K. Tirez, S. Verstraelen, E. Frijns, S. Remy, G. Koppen, A. Rotander, E. B.-F. Vanhaecke and F. Vanhaecke, J. Anal. At. Spectrom., 2021, 36, 695–705 Search PubMed.
- S. Chun, M. Muthu and J. Gopal, Chemosensors, 2022, 10, 1–22 Search PubMed.
- C. Guanglong, F. Zhilu, F. Zhilu, Y. Huirong, W. Jun and W. Jun, TrAC, Trends Anal. Chem., 2020, 130, 115981 Search PubMed.
- L. C. Jenner, R. R. Kureshi, D. White, E. Chapman, L. R. Sadofsky and J. M. Rotchell, Atmosphere, 2022, 13, 1–13 Search PubMed.
- B. C. Smith, Infrared Spectral Interpretation A Systematic Approach, Taylor and Francis Inc., 1998 Search PubMed.
- D. Long, The Raman Effect: A Unified Treatment of the Theory of Raman Scattering, Wiley, 2002 Search PubMed.
| This journal is © The Royal Society of Chemistry 2024 |

