
 Open Access Article
 This Open Access Article is licensed under a
 Creative Commons Attribution 3.0 Unported Licence
Time-resolved operando insights into the tunable selectivity of Cu–Zn nanocubes during pulsed CO2 electroreduction†
Antonia
Herzog‡
 ,
Martina
Rüscher
,
Hyo Sang
Jeon
,
Janis
Timoshenko
,
Clara
Rettenmaier
,
Uta
Hejral
,
Earl M.
Davis
,
F. T.
Haase
,
David
Kordus
,
Stefanie
Kühl
,
Wiebke
Frandsen
,
Arno
Bergmann
* and
Beatriz
Roldan Cuenya
*
,
Martina
Rüscher
,
Hyo Sang
Jeon
,
Janis
Timoshenko
,
Clara
Rettenmaier
,
Uta
Hejral
,
Earl M.
Davis
,
F. T.
Haase
,
David
Kordus
,
Stefanie
Kühl
,
Wiebke
Frandsen
,
Arno
Bergmann
* and
Beatriz
Roldan Cuenya
*
Department of Interface Science, Fritz-Haber Institute of the Max-Planck Society, 14195 Berlin, Germany. E-mail: abergmann@fhi-berlin.mpg.de; roldan@fhi-berlin.mpg.de
First published on 26th August 2024
Abstract
Pulsed electrochemical CO2 reduction (CO2RR) has emerged as a facile way to alter the product selectivities toward desired multicarbon products, but so far, it has been mainly applied to monometallic Cu-based electrodes, which suffer from stability issues. Here, ZnO-decorated Cu2O nanocubes were exposed to various pulsed CO2RR treatments to uncover the effect of the redox transitions of both metals on the dynamic catalyst structure and composition and its link to their catalytic function. An increase in the ethanol selectivity was observed once pulsed into the oxidation regime of zinc, while the parasitic hydrogen evolution drastically increased once pulsed into the oxidation regime of Cu. By employing time-resolved operando X-ray absorption spectroscopy, X-ray diffraction, and surface-enhanced Raman spectroscopy, we could follow the dynamically induced interplay between Zn oxide, CuZn alloy, metallic Zn and metallic Cu formation, and the coverage of co-adsorbed hydroxide and *CO. Our study highlights the relevance of zinc oxide and an increased OH coverage for the enhancement of the catalyst selectivity toward ethanol.
Broader contextThe escalating consumption of fossil fuels has led to a significant rise in atmospheric CO2 levels, contributing to severe global environmental challenges. The CO2 electroreduction reaction (CO2RR) offers a promising solution by converting CO2 into valuable chemicals and fuels, thereby closing the carbon cycle and storing renewable energy. However, the CO2RR often suffers from selectivity and stability issues, limiting its industrial application. While prior research has focused on enhancing the CO2RR performance such as activity and selectivity using static CO2RR, our work introduces a novel approach by using pulsed electrochemical treatments on ZnO-decorated Cu2O nanocubes. This method allows precise control over the redox states of zinc and copper, significantly improving ethanol selectivity and reducing undesirable hydrogen evolution. By employing advanced time-resolved operando techniques to monitor real-time changes in the catalyst and its adsorbates, we provide deeper mechanistic insights into the dynamic interplay of bimetallic systems under CO2RR conditions. These findings have the potential to revolutionize catalyst design, paving the way for more efficient and stable CO2 conversion processes. This research not only advances the field of CO2RR but also aligns with global efforts to develop sustainable energy solutions, reduce carbon emissions, and mitigate climate change. |
Introduction
The electrocatalytic CO2 reduction reaction (CO2RR) provides an attractive way to mitigate the energy crisis by closing the carbon cycle and storing renewable energy in valuable multicarbon chemicals and fuels.1,2 In particular, the selective generation of C2+ products such as ethanol is highly desirable for economical usage due to their high energy densities and ease of transport and storage.3 Among the metals, Cu is the only catalyst that can yield significant amounts of hydrocarbons and oxygenates such as CH4, C2H4, and C2H5OH.4 However, the Cu-catalyzed CO2RR suffers from low selectivity toward C2–C3 liquid products and poor long-term stability.5,6 The incorporation of a CO-producing second metal (e.g., Ag, Au, and Zn) has been shown to be a promising strategy for the enhancement of liquid products either due to a CO spillover from the second metal to the Cu sites or due to the change in the electronic properties.7–11Especially Cu–Zn is an appealing system since it consists of relatively low-cost metals. Nevertheless, the reported CO2RR selectivities for Cu–Zn systems are often contradictory, and the reaction pathways are disputed. For example, a phase-separated Cu–Zn catalyst with 50 wt% of Zn exhibited a Faradaic efficiency of up to 94% for CO.12 Moreover, the selectivity of CuZn nanoparticles (NPs) changed from methane on Cu–ZnO NPs to CO upon CuZn alloy formation.13,14 It appears that under potentiostatic conditions the product selectivity of Cu–ZnO nanocrystals can be switched from methane to ethanol by changing the degree of surface alloying together with the concentration of metallic Zn.15 Additionally, Cu-rich CuZn alloys were found to increase the C2+ product selectivity, while Zn-rich alloy phases increased the formation of CO and H2.16 Thus, the structural, morphological, and chemical arrangements of Cu–Zn are crucial for the observed product selectivities. So far, the Cu–Zn surface composition has been mainly altered by employing different synthesis routes, where the resulting material experiences further transformations when exposed to static CO2RR conditions while forming the working catalyst state. However, a more elegant way to modify the Cu–Zn arrangement in a controlled manner in situ is by pulsed electrolysis, with the electrode potential periodically alternating from a cathodic to an anodic potential.17 Thereby, the working catalyst active surface sites can be regenerated or reactivated, resulting in the stabilization or even improvement of the catalytic function.
So far, studies of pulsed CO2RR mainly focused on the usage of bare Cu catalysts and revealed an enhancement toward C2+ products as well as a suppression of the hydrogen evolution reaction (HER).18–21 These trends were mainly attributed to the oxidation of Cu,22,23 irreversible morphological changes,20,22,23 an increase in the local pH,19,20 and/or adsorption of OH− species.24 We recently also unveiled that co-adsorbed hydroxide next to CO plays an important role in the observed increase in ethanol under certain pulsed conditions for pure Cu catalysts.25 Nonetheless, pure Cu catalysts experience instabilities during CO2RR due to Cu dissolution and the deactivation of the active sites, driven by the ongoing oxidation–reduction cycles.23,26 Bimetallic Cu–Ag catalysts have demonstrated enhanced selectivity and stability under pulsed CO2RR conditions.27 However, bimetallic catalyst architectures specifically designed for pulsed CO2RR remain underexplored. Moreover, there is a critical need for time-resolved operando characterization to understand the dynamic changes occurring and their role in the reaction mechanisms.
Here, ZnO-decorated Cu2O derived nanocubes (NCs) serve as a model system for bimetallic catalysts for the pulsed CO2RR. We tested different anodic potentials (Ea), while we fixed the cathodic CO2RR potential (Ec = −1.0 V versus RHE), as well as the anodic time ta (1 s) and the cathodic time tc (4 s), following previous findings on optimized conditions for ethanol formation.23 By employing time-resolved operando X-ray absorption spectroscopy (XAS), high energy X-ray diffraction (HE-XRD), and surface-enhanced Raman spectroscopy (SERS), we could unveil the evolution of the structure, chemical state, composition, and adsorbate coverage of the Cu–Zn catalyst under pulsed CO2RR conditions. In this way, the structure of the catalyst and the adsorbate coverage could be dynamically altered to tune the selectivity toward the desired C2+ products.
Results and discussion
Microscopy characterization of Cu–Zn nanocube catalysts
Bimetallic shape and size-selected Cu2O nanocubes (NCs) with around 20 nm edge length covered with a 2 nm layer of ZnO deposited preferentially at the NC corners were prepared via a wet-chemical approach (Fig. 1a, e, i and Fig. S1–S4, Tables S1–S5, ESI†). STEM-EDX, as well as ICP-MS analysis, revealed a Cu![[thin space (1/6-em)]](https://www.rsc.org/images/entities/char_2009.gif) :Zn composition of 94:6 at% in the as-prepared state (Tables S2 and S3, ESI†). Then, ZnO/Cu2O NCs were pre-reduced for 1 h under static CO2RR conditions (in CO2-saturated 0.1 M KHCO3 at −1.0 V), which served as the starting material for the cyclic voltammetry (CV) and pulsed CO2RR measurement. The structure of the pre-reduced Cu–Zn catalyst changed irreversibly, as shown by ex situ SEM and TEM-EDX images (Fig. 1b, f and j). In fact, the NCs increased by about 4 nm in size (Table S1, ESI†) and formed a porous structure, while Zn interacted with the Cu surface, intermixing with Cu and forming Zn/CuZn islands and particles. The microscopy characterization after pulsed CO2RR is shown in Fig. 1c, d, g, h, k and l. We note that the amount of oxygen after the reaction cannot be quantified by ex situ TEM-EDX maps due to the re-oxidation of the catalyst during transport in air (Fig. S1, ESI†).
:Zn composition of 94:6 at% in the as-prepared state (Tables S2 and S3, ESI†). Then, ZnO/Cu2O NCs were pre-reduced for 1 h under static CO2RR conditions (in CO2-saturated 0.1 M KHCO3 at −1.0 V), which served as the starting material for the cyclic voltammetry (CV) and pulsed CO2RR measurement. The structure of the pre-reduced Cu–Zn catalyst changed irreversibly, as shown by ex situ SEM and TEM-EDX images (Fig. 1b, f and j). In fact, the NCs increased by about 4 nm in size (Table S1, ESI†) and formed a porous structure, while Zn interacted with the Cu surface, intermixing with Cu and forming Zn/CuZn islands and particles. The microscopy characterization after pulsed CO2RR is shown in Fig. 1c, d, g, h, k and l. We note that the amount of oxygen after the reaction cannot be quantified by ex situ TEM-EDX maps due to the re-oxidation of the catalyst during transport in air (Fig. S1, ESI†).
 | ||
| Fig. 1 Microscopy characterization of the Cu–Zn catalyst after different electrochemical reaction conditions. (a)–(d) SEM, (e)–(h) STEM-HAADF and (i)–(l), STEM-EDX images of the Cu–Zn catalyst. (a), (e) and (i) show the as-prepared state, (b), (f) and (j) after 1 h of potentiostatic CO2RR at −1.0 VRHE, (c), (g) and (k), after 1 h of pulsed CO2RR with Ea = 0 V and (d), (h) and (l), after 1 h of pulsed CO2RR with Ea = 0.6 V (fixed Ec = −1.0 V, tc = 4 s and ta = 1 s) in CO2-saturated 0.1 M KHCO3. The scale bars of the SEM images correspond to 100 nm and of the STEM images to 20 nm. | ||
Characterization of as-prepared and pre-reduced catalyst
We employed spectroscopy methods to characterize the ZnO–Cu2O NC catalyst in the as-prepared state, at open circuit potential (OCP) and operando during the pre-reduction treatment (1 h under CO2RR conditions at −1.0 V), as shown in Fig. 2 with schematic structures in Fig. 2a. The position of the absorption edge in the Cu K-edge XANES spectrum (Fig. 2b) of the sample under OCP compared to the reference spectra indicates that the sample is mainly in the Cu(I) oxidation state. After 1 h of static CO2RR, the spectrum of the pre-reduced catalyst resembles that of the metallic Cu foil reference. Nevertheless, linear combination analysis (LCA) revealed that a significant fraction of Cu(I) of 12% was still preserved under static CO2RR conditions (Fig. S5 and S6, ESI†), in line with previous studies on Cu2O NCs.7,23 On the other hand, the Zn K-edge XANES spectrum (Fig. 2d) at OCP resembles the ZnO reference, while the spectrum of the pre-reduced catalyst resembles rather the one of metallic Zn or that of a CuZn brass alloy foil. In principle, Zn K-edge XANES data can also be quantitatively analyzed by LCA (Fig. S5 and S6, ESI†). However, since the actual Cu–Zn alloy structures and compositions in the catalyst can differ significantly from those of standard reference materials, the LCA can suffer from systematic errors, as discussed in more detail in Supplementary Note 2 (ESI†). Therefore, for the quantification of the concentrations of the different Zn species, we relied on the analysis of EXAFS spectra and on a supervised machine learning (ML) approach that was developed in our previous study.16 The ML-based approach allowed us to extract partial radial distribution functions (RDFs) for Zn species with the crystallographically non-equivalent environment (Fig. S7, ESI†).16 By integrating the latter, the relative concentrations of different species could be calculated. As demonstrated in Fig. S8 (ESI†), the ML-EXAFS-based approach provided more accurate values of the concentrations of oxidized, metallic alloyed, and metallic segregated Zn species. In particular, after 1 h of static CO2RR at −1.0 V, the contribution of oxide-like Zn(II) species was ca. 12%, while the majority of Zn species (78%) formed an fcc-like Cu-rich CuZn alloy. The remaining 10% of Zn formed non-fcc metallic species (metallic Zn or Zn-rich CuZn alloys).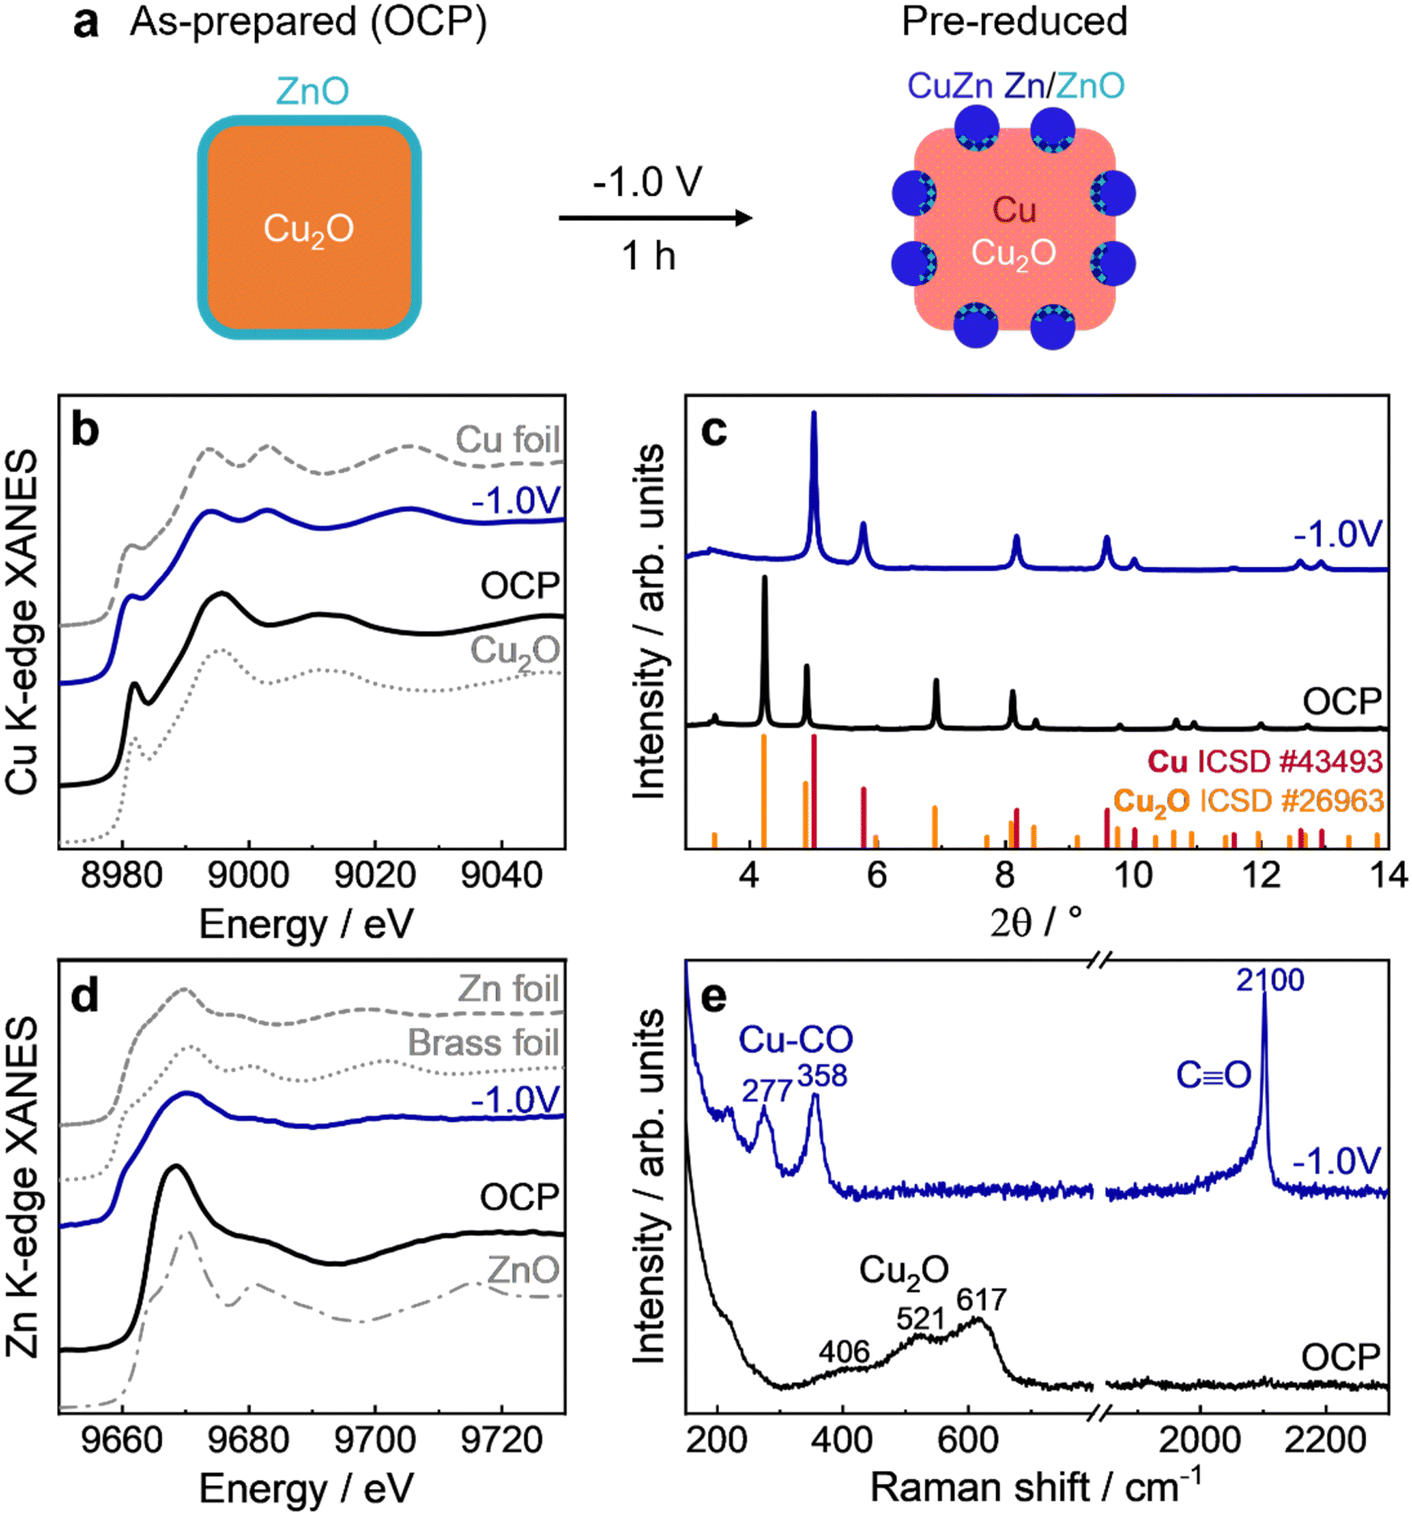 | ||
| Fig. 2 Operando characterization of the Cu–Zn catalyst before and during potentiostatic CO2RR at −1.0 V. (a) Schematic structures in the as-prepared (OCP) and pre-reduced (−1.0 V) states. (b) and (d) Operando XANES of Cu K-edge with corresponding reference spectra of Cu2O and Cu foil and Zn K-edge with corresponding reference spectra of ZnO, metallic Zn foil and Cu70Zn30 brass alloy foil, respectively. (d) Operando HE-XRD with reference positions of Cu2O and Cu. (e) Operando SERS with peak assignments. The reaction time during CO2RR was around 1 h. The CO2RR measurements were carried out in CO2-saturated 0.1 M KHCO3 under potentiostatic conditions at −1.0 VRHE for 1 h. We note that the precise locations of the cationic Zn and Cu species at −1.0 V are not exactly known due to the bulk-sensitivity of XAS and only given schematically. | ||
HE-XRD patterns (Fig. 2c) exhibit characteristic Cu2O peaks at OCP, while these peaks almost disappeared starting from −0.2 to −1.0 V during the initial linear sweep voltammogram (LSV) and the subsequent static CO2RR at −1.0 V (Fig. S9, ESI†). At the same time, peaks corresponding to metallic Cu appeared. No characteristic Zn or CuZn-related peaks could be detected, which indicates the amorphous character of Zn and/or the small crystallite sizes of the alloy. The temporal evolution of the crystal structure during the pre-reduction was analyzed by fitting the characteristic peaks of Cu2O(111), Cu2O(200), Cu(111), and Cu(311) (Fig. S10–S12, ESI†). This analysis confirms the almost complete reduction of the crystalline (bulk-like) Cu2O phase after t = 150 s and the formation of a metallic Cu phase. We highlight here the apparent disagreement between the reduction of Cu2O to Cu from XAS and XRD. XRD shows a nearly complete reduction after a few minutes, while XAS reveals the presence of oxides even after 1 h of CO2RR. This discrepancy is attributed to the different sensitivities of these methods, with XRD only being able to detect well-ordered crystalline regions of the sample, while XAS is sensitive to both, ordered and disordered structures. The slower reduction observed by XAS is thus a consequence of the disordered structure of the remaining oxide species.
The Raman data of the Cu–Zn catalyst (Fig. 2e and Fig. S13, ESI†) confirm the oxidized state of Cu at OCP, with the characteristic Cu2O peaks at 406, 521, 617 cm−1,28 while no ZnO related bands at 430 and 560 cm−1 could be observed. This may result from a strongly reduced surface enhancement of the Raman bands of Cu2O and ZnO at OCP, as well as the overlap of ZnO with the dominating Cu2O peaks.10 Potentiostatic conditions lead to the formation of plasmonic metallic Cu nanoparticles (Fig. S13, ESI†), enhancing the surface sensitivity of the Raman method via SERS, and allowing a comparison with the more bulk-sensitive XAS and XRD results. Consequently, the absence of Cu and Zn oxide peaks under static CO2RR at −1.0 V correlate with complete surface metal reduction. Additionally, SERS gives information about the adsorbate structure at −1.0 V, namely the Cu–CO vibrations at ∼280 cm−1 (rotation) and ∼360 cm−1 (stretching)28,29 as well as the C–O vibrations at ∼2100 cm−1.30
Moreover, the surface-sensitive quasi-in situ Auger spectra (Fig. S14, ESI†) show a mix of Cu(I) and Cu(II) species in the as-prepared state of the Cu LMM spectrum, which overlap with the Zn(II) Auger peaks.
After 1 h under potentiostatic conditions at −1.0 V, the Cu surface oxide was fully reduced to metallic Cu. The Zn LMM spectra present only the contribution of Zn(II) in the as-prepared state, while Zn(II) is only partially reduced after static CO2RR to metallic Zn, in contrast to the results from SERS. This discrepancy could be due to the different probing depths of the two methods, especially with missing SERS effect at OCP. It should also be considered that the XPS and Raman measurements were not carried out simultaneously, and that different portions of the same sample were studied. Thus, any differences observed might also reflect possible sample inhomogeneities. Another plausible explanation is that SERS is performed operando under realistic reaction conditions, whereas XPS is quasi in situ (in situ inert transfer but in the absence of the potential and the electrolyte). The latter can lead to rapid oxidation upon stopping the potential, despite careful handling (without air exposure), due to Zn's high propensity to oxidize. The Zn:Cu surface composition ratio in the as-prepared state, as extracted from the Zn and Cu 2p core level regions (Fig. S15, ESI†) shows a higher Zn:Cu ratio of 15:85 at% compared to the average composition ratio obtained from ICP-MS (6:94at%). As XPS is surface sensitive, this suggests that more Zn species should be present at the surface of the sample, which also fits to the partial overcoating of the Cu2O NCs with ZnO as observed by STEM-EDX (Fig. 1i). After static CO2RR at −1.0 V, the fraction of Cu on the surface increased, highlighting the intermixing of Cu and Zn species on the catalyst surface (Table S6, ESI†). We excluded Zn dissolution as the main reason for this behavior, since the amount of Zn found in the electrolyte after the reaction corresponds to only 1% of the total amount of Zn that is present on the electrode (ICP-MS measurements in Table S7, ESI†).
Overall, the pre-reduced Cu–Zn sample consists of metallic Cu and CuZn/Zn/Zn(II) islands and particles on the surface as illustrated in Fig. 2a with some small contribution of Cu(I) in the bulk. This pre-reduced structure was used in the following as the starting catalyst for the dynamic pulsed CO2RR measurements aimed to tune the CO2RR selectivity for C2 products.
Selectivity during static and pulsed CO2RR
To establish the relevant anodic potential values for optimal pulsed CO2RR conditions, Fig. 3 presents the cyclic voltammogram of the pre-reduced Cu–Zn catalyst in CO2-saturated 0.1 M KHCO3 electrolyte. In the CV, two distinct peaks at −0.25 and 0.6 V appeared, corresponding to the oxidation of Zn and Cu species, respectively. | ||
| Fig. 3 Choice of anodic potentials by cyclic voltammogram and selectivities of pulsed CO2RR. (a) Cyclic voltammogram of Cu–Zn (50 mV s−1) after 1 h of reduction at −1.0 V in CO2-saturated 0.1 M KHCO3 with marked regions. (b) Pulse profile of one pulse sequence (top) and Faradaic efficiencies (bottom) of Cu–Zn under potentiostatic conditions (−1.0 V) and under pulsed electrolysis conditions with a fixed Ec value at −1.0 V and different Ea values with tc = 4 s and ta = 1 s during 1 h of reaction. | ||
The role of the Cu and Zn oxidation state can now be linked to the catalyst functionality during pulsed CO2RR experiments by selecting the values of the upper (“anodic”) potential below, at and in between the oxidation peaks as indicated in Fig. 3a. By “anodic potential” we refer here to a more positive potential value than the cathodic potential and does not have to be a positive potential value. The cathodic potential in all cases was fixed to Ec = −1.0 V, as this was the best CO2RR potential to form C2+ products under potentiostatic conditions. The duration of the cathodic and anodic pulses was chosen to be 4 s and 1 s, respectively, based on our previous work of pulsed CO2RR with bare Cu2O NCs23 and on selectivity test measurements of the Cu–Zn catalyst that were performed with different pulse durations (Fig. S18, ESI†) to ensure high yield of multicarbon products. The Faradaic efficiencies (FEs) during static CO2RR at −1.0 V as well as under pulsed CO2RR for 1 h with different anodic potentials Ea in Fig. 3b indicate the tuneability of the selectivity. The corresponding current densities (Fig. S16 and S17, ESI†) highlight further the stability of the catalyst up to Ea = 0 V, while they start to decrease at higher Ea.
The selectivity trends under static CO2RR conditions at −1.0 V (Fig. 3b) were similar to those for the bare Cu2O NCs (Fig. S19, ESI†) with FEEtOH = 12%, but there was an increase of the FEs of H2 from the HER and CO, while the ethylene production decreased. Thus, we could not observe a strong beneficial CO spillover effect from Zn to the Cu sites under static CO2RR. However, we could significantly tune the C2+ selectivity values by pulsing the potential to different Ea values, as seen in the Ea-dependent FEEtOH. The best FE for ethanol production (FEEtOH = 19%) and C2+ products (FEC2+ = 56%) was obtained at Ea = 0 V during 1 h of pulsed CO2RR. There, the time-dependent evolution of the gaseous products (Fig. S20, ESI†) shows an activation time of the system for the C2+ product formation of ∼30 min after pulsed CO2RR was started, which indicates structural transformations of the catalyst. Interestingly, the HER production increased significantly at lower and higher Ea values, making hydrogen the main product at Ea = −0.4 V and 0.6 V. This trend might be linked to different catalyst transformation at different Ea values as e.g. the formation of a CuZn alloy structure has been shown to primary yield H2 and CO.31 This is in contrast to the behavior of bare Cu cubes, which showed a significant increase in the ethanol selectivity at Ea = 0.6 V.23 Thus, the Cu–Zn catalyst can boost the ethanol selectivity at lower Ea values (optimal Ea = 0 V) compared to bare Cu2O NCs (optimal Ea = 0.6 V).23 This has the advantage of a lower Cu dissolution (as shown by ICP-MS in Table S7, ESI†) and less restructuring of Cu (as shown by STEM in Fig. 1k) leading to a more stable current density and catalytic performance of Cu–Zn.
To distinguish if the changes in the catalyst selectivity are mainly attributed to dynamic reversible transformations in the catalyst structure and composition during pulsed CO2RR or if they originate from concomitant irreversible changes in the catalyst structure and morphology, we followed this procedure. First, we applied potentiostatic conditions at −1.0 V, then pulsed CO2RR with Ea = 0 V, followed by reapplied potentiostatic conditions at −1.0 V, and then reapplied pulsed conditions with Ea = 0 V, with each cycle for 2 h. Under reapplied potentiostatic conditions, the FEs of HER and CO increased noticeably, while the ethylene production was cut by half in comparison to the catalyst under the first potentiostatic test (Fig. S21 and S22, ESI†). Thus, the Cu–Zn catalyst must have been irreversibly changed associated with the pulse treatment, which can be attributed, in part, to the changes in the Cu/Zn interface arrangement and possible Cu–Zn alloy formation, since there were no major structural changes visible in the ex situ TEM-EDX image (Fig. 1k and Fig. S3g, ESI†). Nevertheless, when reapplying pulsed CO2RR for the second time, the HER and CO production was suppressed again, while the ethylene production and current density value were restored and liquid products significantly increased. In fact, even an improvement toward C2+ products was observed as compared to the values measured during the first pulse sequence. Therefore, the increase of the C2+ product formation, the suppression of the HER and CO selectivity, and the increase in current density under pulsed CO2RR for the Cu–Zn catalyst in the regime investigated stemmed mostly from the dynamic and reversible changes induced by the pulsed reaction conditions.
In order to reveal the role of Zn for the selectivity improvements during pulsed CO2RR, we confirmed that a comparable Cu catalyst under pulsed CO2RR showed no selectivity changes at Ea = 0 V compared to potentiostatic conditions (Fig. S19, ESI†). Furthermore, the selectivity trends of a commercial brass foil qualitatively resemble the behavior of the Cu–Zn catalyst during pulsed CO2RR conditions, where the selectivity toward C2+ products improved at Ea = 0 V and diminished at Ea = 0.6 V (Fig. S23, ESI†). Thus, the Zn and Cu interplay, as well as their redox transitions, play a key role in the selectivity changes during pulsed CO2RR of the Cu–Zn catalyst and demand operando methods for their further investigation and understanding.
Structural evolution during cyclic voltammetry
To reveal the evolution of the structure, composition, redox state, and adsorbate coverage of the pre-reduced Cu–Zn catalyst, we employed time-resolved operando methods (with a time resolution of 100–1000 ms per spectrum or image) during a CV scan starting from E of −1.0 V up to 0.7/0.9 V (Fig. 4) and back to −1.0 V (Fig. S24, ESI†). E stands here for the applied potential during the CV measurements. Changes in the catalyst structure were evidenced by the corresponding spectra and diffractograms of SERS, XAS and XRD. In particular, the white line of the Zn K-edge XANES spectra (Fig. 4a) significantly increased during the anodic CV scan starting from E > −0.4 V, while the white line of the Cu K-edge XANES spectra (Fig. 4b) only slightly increased at E > 0.4 V, attributed to the oxidation of Zn and slight oxidation of Cu. This is in line with the subtracted ΔXRD pattern (Fig. 4c, subtracted from the XRD pattern obtained under static CO2RR at −1.0 V), which shows the formation of the Cu2O(111) peak only starting from E > 0.4 V, while the peaks related to metallic Cu, such as Cu(311), even increased in intensity until E ∼ 0.4 V before they started to decrease. SERS spectra (Fig. 4d) show the characteristic Cu–CO rotation (COr) and stretching (COs) vibrations (∼280 and 360 cm−1)28,29 and OHad vibrations (450–490 cm−1)32–34 on Cu under CO2RR conditions, which redshifted at higher potential due to the Stark effect (which depends on the electric field),33,35 until they disappeared at −0.4 V. Then, a band at 1080 cm−1 corresponding to carbonate appeared until 0.6 V, followed by the formation of Cu(I) and Cu(II) oxides from 0.6 V to 0.9 V. To further correlate and understand these data, the key parameters need to be analyzed and compared with each other. | ||
| Fig. 4 Structural changes during the anodic scan of a cyclic voltammogram analyzed via operando characterization methods. (a) and (b) Normalized averaged XANES data of Zn and Cu K-edges, respectively, during the anodic scan from −0.9 to 0.9 V of the CV in CO2-saturated 0.1 M KHCO3. (c) Averaged ΔHE-XRD patterns acquired during the anodic scan from −0.9 to 0.7 V. The data are displayed after the subtraction of the XRD pattern obtained during static CO2RR at −1.0 V before the CV. (d) Averaged SERS spectra collected during the anodic scan from −1.0 to 0.9 V. The Cu–Zn sample was pre-reduced for 1 h at −1.0 V under CO2RR conditions before the CV. | ||
Fig. 5 illustrates the evolution of selected key parameters during the CV scan, namely the concentrations from LCA-XANES of the Zn and Cu K-edges (Fig. S25, ESI†), the crystalline parameters of Cu2O and Cu extracted from Rietveld analysis (Fig. S26 and S27, ESI†), as well as the evolution of the intensity fits of selected Raman bands such as Cu2O, Cu(OH)2, COs and carbonate bands.
 | ||
| Fig. 5 Changes of the oxidation state and adsorbates during a CV extracted from operando measurements. Potential-dependent concentrations of CuZn, Zn, ZnO (Zn K-edge), Cu2O, and CuO (Cu K-edge) from the LCA-XANES analysis of Zn K-edge and Cu K-edge XANES spectra (top), potential-dependent weight fraction of crystalline Cu2O and volume-averaged crystallite sizes of Cu and Cu2O obtained by Rietveld analysis of the HE-XRD patterns, and potential-dependent spectroscopic weight of adsorbates as COs and CO32− and Cu2O and Cu(OH)2 species obtained by fitting the normalized intensities (arb. units) of the bands from the SERS spectra. For XRD, the potential was already reversed at 0.7 V, while for XAS and SERS it was reversed at 0.9 V. | ||
During the anodic CV scan with E ranging from −1.0 to −0.3 V in the CO2RR regime, the bulk catalyst composition is characterized by the presence of CuZn, Zn(0), Cu(0), and Cu(I) species (LCA-XANES), while SERS suggests a metallic surface. These findings align with those observed for the pre-reduced catalyst at −1.0 V. SERS also reveals adsorbed CO on Cu during CO2RR, which begins to desorb at −0.5 V and is fully desorbed by −0.3 V, marking the end of the CO2RR regime. From −0.25 to 0 V, which aligns with regions II and III in the CV in Fig. 3a, the CuZn alloy partially oxidizes to Zn(II) while Cu(0) remains unoxidized (LCA-XANES). At 0.6 V, corresponding to region V (Fig. 3a), metallic Cu oxidizes, indicated by the formation of surface Cu2O (SERS) and crystalline Cu2O with a crystallite size of 4 nm (XRD).
Concurrently, a second oxidation step of the CuZn alloy to Zn(II) is observed (Zn LCA-XANES), and bulk Cu(I) forms at +0.7 V (Cu LCA-XANES). The delayed oxidation of Zn suggests the robust stability of the CuZn alloy. At even higher anodic potentials, surface Cu(OH)2 at 0.7 V (SERS), and bulk Cu(II) species begin to emerge at 0.9 V (Cu LCA-XANES).
The cathodic scan from 0.9 to −1.0 V in the CV demonstrates an almost reversible transformation in both the main structural characteristics and adsorption behaviors. However, the reduction of Zn(II) back to the CuZn alloy occurs in a single step, unlike its two-step oxidation process. In the final CV state, the concentration of Zn(II) is approximately 5% higher than initially measured (Zn LCA-XANES), and the crystalline size of metallic Cu has marginally increased to about 12 nm from an initial 11 nm (XRD), a change likely linked to structural transformations induced by the harsh oxidative conditions.
Structural evolution during pulsed CO2RR
To track the periodic and reversible changes in the catalyst and adsorbate structures during pulsed CO2RR, we employed time-resolved operando techniques. The data from XAS (Fig. S28 and S29, ESI†), XRD (Fig. S30 and S31, ESI†), and SERS (Fig. S32 and S33, ESI†) clearly illustrate the dynamic evolution of the catalyst structure, chemical state, adsorbate type and coverage throughout individual potential pulses. We specifically focused on experiments conducted at Ea values of 0 V (ethanol regime) and 0.6 V (HER and C1 regime), which demonstrate varying selectivity trends and are associated with different redox transitions of Zn and Cu, as previously discussed in Fig. 3b. For enhanced visibility of the changes, we measured pulsed CO2RR with longer pulse durations of tc = ta = 10 s and compared the results with the catalytic relevant durations at tc = 4 s, ta = 1 s.Fig. 6 represents the results of the quantitative analysis, which are averaged over the same time moments after the onset of each potential pulse under pulsed CO2RR with tc = ta = 10 s. The machine learning-based EXAFS analysis of the Zn K-edge (Fig. 6a and Fig. S36, ESI†) revealed that upon application of an anodic potential, the fcc CuZn alloy transforms into a Zn(II) oxide phase, while the non-fcc Zn-rich phase remains largely unchanged. Notably, the primary distinction between the two anodic potentials during the anodic pulse is observed in the quicker transition from the CuZn alloy to the Zn(II) oxide phase at the higher anodic potential (Ea = 0.6 V), where the increase in Zn(II) oxide concentration is up to 30%, as compared to 20% at the lower anodic potential (Ea = 0 V).
 | ||
| Fig. 6 Averaged changes in the structure and adsorbates of Cu–Zn nanocube catalysts during a pulse sequence with Ec = −1.0 V and Ea = 0 V (bottom, solid curves) or Ea = 0.6 V (top, dashed curves) for tc = ta = 10 s by operando measurements. (a) Machine-learning-based analysis of EXAFS analysis results for the Zn K-edge show the concentrations of different Zn species, and LCA-XANES analysis results for Cu K-edge show variations in Cu(I) concentration. The concentration profile of Cu(I) is multiplied by 10 for better visibility. (b) HE-XRD Cu(311) Bragg peak parameters such as the relative changes in the Bragg peak area, the Cu coherence length, and the lattice strain. (c) Raman band evolution of adsorbed CO (stretching band at 360 cm−1), OHad (adsorbed on Cu at 490 cm−1), Cu/ZnOx/(OH)y species (370 cm−1), and Cu2O species (average of 530 and 620 cm−1) obtained by fitting the intensities of the bands from the SERS spectra. The colored lines are exponential fits, and the solid lines represent the anodic pulse to 0 V, and the dashed lines above the anodic pulse to 0.6 V. The solid grey lines indicate the respective values for each parameter at the end of the cathodic pulse. (d) Schematic changes of Cu–Zn surfaces during pulsed CO2RR at different Ea values. | ||
The differences between the anodic protocols become more pronounced once the cathodic pulse is applied. Specifically, shifting from 0 V to −1.0 V results in the formation of a Zn-rich phase, with a decrease in oxidized Zn species, and only after a few seconds the Zn-rich phase converts back to the CuZn alloy phase. Conversely, when moving from the higher anodic potential 0.6 V to −1.0 V, the transition predominantly favors the formation of the CuZn alloy, with the Zn oxide contribution reducing in favor of the CuZn alloy phase, and the Zn-rich phase playing no role as illustrated schematically in Fig. 6d.
This dynamic is well-aligned with the observations in selectivity, where the Zn-rich structure is more conducive to form C2+ products, as observed at 0 V, whereas the CuZn alloy predominantly generates C1 products, as seen at 0.6 V and also observed in other studies for these structures.31 These insights underscore the strength of the machine learning approach in identifying distinct phases of the Zn K-edge that LCA could not reveal (Fig. S34, ESI†).
Intriguingly, the changes of the LCA analysis of the Cu K-edge (Fig. 6a and Fig. S34, ESI†) in the chemical state of Cu to Cu(I) in the Cu–Zn catalyst are small, with ∼1% even during pulsed CO2RR at 0.6 V. This corresponds to about one-third of the fraction of Cu(I) that was formed reversibly and periodically for bare Cu2O NCs at similar conditions.23 The lower Cu(I) concentration might result from the concurrent oxidation of CuZn to Zn(II) in the Cu–Zn catalyst.16
Additionally, the Cu lattice, as probed by XRD (Fig. 6b), increased rapidly upon the anodic pulse and shrank rapidly back upon applying the cathodic pulse under pulsed CO2RR with tc = ta = 10 s. The degree of this lattice expansion increased with a higher Ea value. This process might be linked to the charging of Cu and is independent of Cu oxidation.23 Moreover, the coherence length of Cu increased slightly during the anodic pulse at Ea = 0 V, which could reflect the oxidation of Zn from the CuZn alloy and the rearrangement of the Cu phase. At Ea = 0.6 V, the coherence length increased only in the first second of the anodic pulse before it decreased due to the oxidation to Cu2O. Upon the cathodic pulse, this process was reversed.
Catalytically, the evolution of the adsorbate structure during pulsed CO2RR is of the highest importance for selective product formation and was followed by SERS under pulsed CO2RR with tc = ta = 10 s (Fig. 6c and Fig. S40, S41, ESI†). In particular, the CO stretching band at 360 cm−1, which was related in a previous study to the formation of C2+ products,35 evolved upon the cathodic pulse (product formation) and was completely removed during the anodic pulse (no product formation). Additional information regarding the adsorbed CO could be obtained from the peaks corresponding to the C–O vibrations (Fig. S41, ESI†). Here, the contribution of low-frequency CO at 2060 cm−1 increased in intensity compared to the high-frequency CO band at 2090 cm−1 at Ea = 0 V (compared to Ea = 0.6 V), which can be correlated to C–C coupling and C2+ product formation.30
Importantly, the adsorption of hydroxides on Cu or Zn sites plays a key role for the enhancement of the selectivity toward ethanol.25,36 Here, the intensity of the hydroxide band on Cu at 490 cm−1 increased rapidly during the cathodic pulse at both Ea values investigated and decreased upon the anodic pulse. However, this band redshifted in position due to the Stark shift upon the anodic pulse and decreased during Cu oxidation at Ea = 0.6 V. This indicates that the contribution of adsorbed OH might be larger at Ea = 0 V, which can be attributed to the competition between OH adsorption and Cu oxide formation at Ea = 0.6 V. Additionally, hydroxide species in the form of Cu/ZnOx(OH)y at 370 cm−1 become mainly visible during the anodic pulses at Ea = 0 V, while the band is not pronounced at Ea = 0.6 V for tc = 10 s and ta = 10 s.33,37,38 These observations highlight the enhanced hydroxide coverage at Ea = 0 V, which appears crucial for the understanding of the reaction path to ethanol in this material (Fig. 6d).
The corresponding analysis for the catalytically relevant pulses with tc = 4 s and ta = 1 s (Fig. S42, ESI†) shows a qualitatively similar evolution of the structure and adsorbates compared to the tc = ta = 10 s pulses, when considering the same time range of the pulse as that in the XAS (Fig. S35 and S37, ESI†), XRD (Fig. S39, ESI†), and SERS analysis (Fig. S40 and S41c, d, ESI†). Due to the limited time resolution, changes from XAS analysis for the shorter pulse lengths are difficult to follow but indicate the formation of smaller Zn oxide fractions during the short anodic pulses. Thus, while the catalytic performance with tc = ta = 10 s at Ea = 0 V (Fig. S18, ESI†) is not identical to the shorter pulse length, it still shows a beneficial effect toward C2+ product formation in parallel to suppressing HER. The tc = ta = 10 s pulses can be used to track the evolution of structural and adsorbate behavior with highly resolved data points and estimate the catalytic state after only 1 s of oxidation and 4 s of reduction.
Additionally, the surface sensitive quasi-in situ LMM Auger data also confirm the metallic state of Cu at the catalyst surface, as well as indicate the partial oxidation of Zn after pulsed CO2RR at Ea = 0 V with tc = 4 s and ta = 1 s (Fig. S43, ESI†). Here, the Cu:Zn ratio on the surface significantly increased after the application of the cathodic pulse due to Cu surface segregation simultaneously with CuZn alloy formation (Fig. S44, ESI†). After the anodic pulse, the Cu:Zn ratio decreased again due to the formation of ZnO, which segregates to the surface. This also fits to the results of ML-XAS (Fig. 6a), where the Zn-rich non-fcc alloy transforms to the Cu-rich fcc alloy over the course of the cathodic pulse at Ea = 0 V.
Correlation of structure and selectivity
The ultimate goal of this study was to correlate the structural operando data with the catalytic selectivity at different Ea values during pulsed CO2RR of the Cu–Zn sample. For pulsed CO2RR with tc = 4 s and ta = 1 s, the structural and chemical changes within each individual pulse are small and are also hard to detect, in particular by XAS, due to the limited time resolution of the measurements. Therefore, additional “slow” (standard temporal resolution) XAS spectra were analyzed with an acquisition time of 10 min per spectrum. Fig. 7 presents (a) the weights of the different Zn species as extracted by the ML-EXAFS approach during the cathodic and anodic pulse from “slow” XAS data (with corresponding XAS data and RDFs in Fig. S45 and S46, ESI†); (b) the averaged coherence length at each end of an anodic pulse (Fig. S47, ESI†); and (c) the OH to CO coverage (OHad− on Cu at 490 cm−1, divided by the CO coverage, which is the intensity of COs/COr)25 during the cathodic pulse as well as the intensity of Cu/ZnOx(OH)y (at 370 cm−1, not normalized and intensities cannot be quantified) during the anodic pulse (Fig. S48, ESI†). | ||
| Fig. 7 Effect of the anodic potential Ea on the structure, adsorbates and catalytic performance. (a) Machine-learning (ML) analysis results of the averaged concentrations of Zn(0) (non-fcc-type structure), CuZn (fcc-type structure), ZnO species (oxide-type structure) from the Zn K-edge XAS spectra acquired during the cathodic and anodic pulses with tc = 4 s and ta = 1 s in dependence of the Ea value. (b) Change of the coherence length of the metallic Cu(311) Bragg peak at the end of each anodic pulse with tc = 4 s and ta = 1 s. (c) Blue dots show the intensities of the OHad band (∼490 cm−1) versus the CO coverage (COs/COr) during the cathodic pulse (each cathodic pulse is averaged), and the green dots show the evolution of the averaged intensities of Cu/ZnOx/(OH)y (370 cm−1) during each anodic pulse with tc = ta = 10 s. (d) Scheme of the proposed electrode structure, composition, and reaction products extracted at the start of the cathodic pulse and change of Faradaic efficiencies of ethanol and ethylene during pulsed CO2RR compared to static CO2RR conditions. In all examples, Ec was set to −1.0 V. | ||
Based on the XAS, XRD, and SERS results, as well as microscopy (Fig. 1 and Fig. S2, ESI†), quasi in situ XPS data (Fig. S44, ESI†), and selectivity data (Fig. 3b), we identified three regions within the pulse parameter space with distinct catalyst surface structures, compositions, morphologies, and adsorbate coverages. These variations significantly impact the main selectivity trends, as illustrated in Fig. 7d. Since these collective changes influence the catalytic activity and stability as an ensemble effect, it is crucial to discuss their intertwined effects in detail. At lower anodic pulse potentials (Ea < −0.25 V), the HER and CO production increased significantly. This is the region where the concentration of Zn oxide is the lowest, and the amount of the Cu-rich CuZn alloy phases is high (Fig. 7a). Only minor changes in the Cu lattice were observed in this regime, as evidenced by the XRD data (Fig. 7b and Fig. S47, ESI†) in accordance with similar morphology and edge length of the cubes as after static conditions (Fig. S2a and Table S4, ESI†). These insights indicate that the catalyst structure under these conditions resembles the structure under static conditions, where the C2+ selectivity was, however, still much higher (Fig. 3b). A similar decrease in the C2+ products at Ea = −0.4 V has been measured for the bare Cu2O NCs (Fig. S19, ESI†).24 Thus, the decrease in C2+ products under pulsed CO2RR at lower Ea values is not only related to the catalyst structure and composition but rather to the change in the adsorbate type and coverage and thus the local pH. Indeed, SERS data suggest a decrease of OHadversus CO and no formation of Cu/ZnOx(OH)y species, which are beneficial for the formation of oxygenated products. These low “anodic” pulses might not remove the CO and H species far enough from the catalyst surface and might then be directly released during the cathodic pulse. Further studies need to be performed to confirm the reaction mechanism at low Ea.
Similarly, at high anodic pulse potentials (Ea > 0.3 V), the HER and CO production also increased significantly. However, here ML-EXAFS analysis of the Zn K-edge shows that the fraction of Zn oxide increased (Fig. 7a) in combination with the evolution of a small fraction of Cu2O (LCA-XANES analysis of Cu K-edge). This is in line with a decrease in the coherence length as well as of the Bragg peak area of metallic Cu over the course of the anodic pulse, which indicates the start of Cu oxidation (Fig. 7b and Fig. S47, ESI†). The increased amount of Zn oxide at high Ea values might lead to the (irreversible) segregation of Zn species (ZnO or Zn), as observed in EDX-STEM (Fig. 1l), which results in a higher HER and CO formation stemming from the Zn-rich oxide domains.39 Moreover, the significant particle growth of the CuZn cubes, increasing by ∼5 nm (Tables S1 and S4, ESI†) as well as the dissolution of Zn species, detected as 20 at% by ICP-MS (at Ea = 0.6 V after 1 h of pulsed CO2RR at tc = 4 s and ta = 1 s), may contribute to the instability, as indicated by the increase in current density (Fig. 3b). The observed enhanced CH4 formation under these conditions was also observed with the bare Cu2O NCs and can be assigned to irreversible morphological changes of Cu.23
In contrast, an intermediate anodic pulse potential (Ea = 0 V) resulted in the highest selectivity for ethanol and ethylene formation. In this case, there is an optimal adjustment of the composition of ZnO and the CuZn alloy as well as the Zn-rich phase in combination with metallic Cu (Fig. 6a and 7a). The formation of Zn oxide species during pulsed CO2RR, as observed from XAS, seems to be essential for the ethanol formation, as it was also observed for bare Cu2O NCs, where disordered Cu oxide was formed during pulsed CO2RR.22,23 Moreover, the results of time-resolved ML-XAS (Fig. 6a) and quasi in situ XPS (Fig. S44, ESI†) highlighted that the Zn-rich metallic phase formed only at Ea = 0 V in higher amounts at the beginning of the cathodic pulse, which might be thus crucial for the enhanced ethanol selectivity, while at Ea = 0.6 V the Cu-rich CuZn alloy dominates during the cathodic pulse leading to enhanced HER and C1 products as previously observed for CuZn alloy structures.31 This is also in line with the increase in the coherence length of crystalline Cu (Fig. 7b) due to the dealloying of CuZn and a rearrangement of the Cu phase. These structural changes occur without significant morphological transformation of the CuZn cubes at these moderate anodic potentials, as observed in SEM and STEM images (Fig. 1c and g), which contributes to the high electrocatalytic stability under these conditions. The observed structural changes have also associated an enhancement of the OHadversus CO coverage in SERS, which appears to correlate with the observed ethanol selectivity at different Ea values (Fig. 7c and Fig. S48, ESI†), as observed also for the bare Cu2O NCs.25 In general, morphological changes such as roughening of Cu-based electrocatalysts have been linked to an increased C1 and H2 product formation. Thus, limited oxidation–reduction cycles at electrode potentials in which the Zn is selectively oxidized, helped to limit the overall morphological and structural transformation. Here, we also identified a lower extent of Cu–Zn segregation, which could lead to a pronounced restructuring and dissolution as identified for higher electrode potentials. Furthermore, this study highlights the importance of CO and OHad co-adsorption, since OHad can directly couple with C–C adsorbates to form ethanol, which can be induced by the available oxide from the oxidation of zinc.24,40,41 Besides, the Cu/ZnOx(OH)y band appeared during the anodic pulse mainly between Ea = −0.25 V to 0 V, which seems to be also linked with the enhancement of the OHad during the cathodic pulse to enhance the C2+ products at these potentials.33,37 In summary, we conclude that the synergistic interplay of atomic scale processes in a Cu–Zn catalyst can be tuned via pulsed CO2RR conditions to steer and stabilize the catalytic function toward C2+ products.
Conclusions
This study combines for the first time (sub)-second time-resolved operando XAS, HE-XRD, and SERS to uncover the complex interplay of a multimetallic Cu–Zn nanocatalyst under potentiodynamic CO2RR reaction conditions. Under pulsed CO2RR conditions we could tune the selectivity from C1 to C2+ products by only varying the anodic potential value. To understand the selectivity behavior, we linked the compositional changes, such as Zn oxide, CuZn alloy, and Zn formation, as well as the resulting structural disorder, Cu crystallite size and strain, to changes in the adsorbate coverage, such as OHadversus CO. If only Zn was oxidized during the anodic pulse, the transformation of zinc oxide and a Cu/ZnOx/(OH)y to a Zn-rich phase in the CO2RR regime resulted in an enhanced OH to CO coverage ratio, which increased the ethanol selectivity. On the contrary, if Zn was oxidized to a greater extent coupled with commencing Cu oxidation at a higher anodic potential, ZnO agglomerations started to form on Cu and transformed into a CuZn alloy during CO2RR conditions, which was associated with the observation of a lower OH to CO coverage, which led to an increase in the selectivity of CO and also of the parasitic HER.Thus, this study presents crucial operando mechanistic insights on the potential routes to enhance the ethanol formation in CO2RR by carefully tuning the surface coverage of oxygen as well as adsorbed OH and CO. Overall, the application of potential pulses on a Cu-based bimetallic catalyst offers an easy way to alter the catalyst selectivity and stability toward valuable C2+ products such as ethanol by tuning the oxidation state of the second metal such as Zn.
Methods
Synthesis of Cu–Zn catalyst
ZnO–Cu2O nanocubes (NCs) were prepared by a wet-chemical ligand-free approach as described in our previous work.16 5 mL of an aqueous CuSO4 solution (0.1 M) were mixed with 457.5 mL of ultrapure water (>18 MΩ cm) at room temperature followed by the addition of 17.5 mL of a NaOH solution (1.0 M) under stirring. After 5 s, 20 mL of an L-ascorbic acid solution (0.25 M) were added to the reaction solution and further stirred for 12.5 min. In the meantime, a mixture of 5 mL of L-ascorbic acid (0.25 M) and 2.5 mL of ZnCl2 solution (0.1 M) was prepared. This mixture was added to the reaction solution and stirred for one more minute. The reaction solution was then centrifuged and washed three times, twice with an ethanol–water mixture (1:1) and once with pure ethanol. The final product was dried overnight in vacuum. The working electrodes were prepared by mixing 2.5 mg of the catalyst powder with 800 μL of pure ethanol and 16 μL of a Nafion solution (Sigma-Aldrich, ∼5 wt% in a mixture of alcohols and water). Then, the mixture was ultrasonicated for at least 30 min, and 41 μL of the catalyst dispersion were slowly drop-casted on each side of a 0.5 × 3 cm carbon paper sheet (Alfa Aesar, Toray Carbon Paper, TGP-H-60) to reach a Cu loading of 70 μg cm−2 and dried in an oven at 60 °C. Cu2O NCs, which served as a reference catalyst, were prepared in the same way without adding the mixture of L-ascorbic acid and ZnCl2.
Electrochemical characterization
The electrochemical CO2RR experiments were conducted with a Biologic SP-300 potentiostat in a gas-tight H-type cell, in which the cathodic and anodic compartments were separated by an anion exchange membrane (Selemion AMV, AGC Inc.). Platinum gauze (MaTecK, 3600 mesh cm−2) served as the counter electrode, and a leak-free Ag/AgCl electrode (LF-2, Innovative Instruments, Inc.) as the reference electrode. The electrolyte, 0.1 M KHCO3 solution (Sigma-Aldrich, 99.7%), was previously purified by a cation-exchange resin (Chelex 100 Resin, Bio-Rad) and saturated with CO2 (99.995%) for at least 15 min.Under constant flow of CO2 (20 mL min−1), the catalyst was reduced for 1 h at −1.0 V (pre-reduction). All potentials are referenced to the reversible hydrogen electrode (RHE) and corrected for the iR drop after the measurement by performing potentiostatic electrochemical impedance spectroscopy (PEIS) directly before and directly after the CO2RR measurement. After pre-reduction of the catalyst, a potential pulse protocol was performed for 1 h with a fixed cathodic potential Ec = −1.0 V, but different anodic potentials Ea and a cathodic pulse length tc = 4 s and an anodic pulse length ta = 1 s if not noted differently.
Gas products were measured every 15 min and quantified by online gas chromatography (GC, Agilent 7890B) equipped with a thermal conductivity detector (TCD) and a flame ionization detector (FID). Liquid products were analyzed after each measurement with high-performance liquid chromatography (HPLC, Shimadzu Prominence) equipped with a NUCLEOGEL SUGAR 810 column and a refractive index detector (RID) and with a liquid GC (L-GC, Shimadzu 2010 plus) equipped with a fused silica capillary column and an FID detector. Each presented data point corresponds to an average of at least three different measurements collected with an identical freshly prepared sample under the same experimental conditions, and the error bars represent the standard deviation. The details of the calculations of the Faradaic efficiencies are given in Supplementary Note 1 in the ESI.†
Ex situ characterization
The morphology and elemental distribution of the samples before and after static and pulsed CO2RR were investigated by scanning electron microscopy (SEM, Apreo SEM, Thermo Fisher Scientific), scanning transmission electron microscopy (STEM, FEI Talos F200X microscope, Thermo Fisher Scientific), and energy dispersive spectroscopy (EDX, SuperX 4 SDD EDX detector) maps. The STEM was equipped with an XFEG field emission gun (200 kV) and with brightfield (BF), darkfield (DF), and high-angle annular darkfield (HAADF) detectors. Samples for SEM were measured directly on the carbon paper in the as-prepared state and after different CO2RR conditions. Samples for STEM were prepared by coating a nickel grid (400 mesh with a lacey carbon film, PLANO GmbH) with the catalyst dispersed in EtOH:H2O (1:1) before and after different CO2RR conditions.
The bulk composition and amount of Cu and Zn in the as-prepared samples and the concentrations of Cu and Zn after static and pulsed reaction in the electrolyte were determined by inductively coupled plasma-mass spectrometry (ICP-MS, iCAP RQ, Thermo Fisher Scientific). The as-prepared samples were digested in concentrated HNO3 and heated using microwave irradiation at 180 °C for 20 min, with a ramping step of 10 min (Multiwave GO, Anton Paar). The samples were then diluted with ultrapure water (>18 MΩ cm) to reach the appropriate concentrations.
The surface composition of the catalysts before and after static and pulsed CO2RR was determined by quasi-in situ X-ray photoelectron spectroscopy (XPS) without exposing the samples to air. Therefore, a custom-made electrochemical cell was directly attached to an ultra-high vacuum system equipped with a hemispherical electron analyzer (Phoibos 100, SPECS GmbH, Epass = 15 eV) and an X-ray source (XR 50, SPECS GmbH) with an aluminum anode (1486.6 keV, 300 W). All spectra were aligned to the Cu 2p3/2 peak (Ebin = 932.7 eV). The Cu, Cu2O, and CuO amounts were estimated from the integrated areas of a linear combination fit of the Cu LMM Auger profiles with the corresponding reference spectra. These reference spectra were obtained from an in situ annealed and sputtered Cu foil (metallic reference) and a plasma oxidized CuO sample, and the reference spectrum of Cu2O was used from the literature.42 The Cu to Zn ratio was obtained from the Zn 2p3/2 to Cu 2p3/2 regions and calculated considering the relative sensitivity factors (RSF) of the metals. For the electrochemical measurements, a Metrohm Autolab potentiostat (PGSTAT 302 N) was used. For the determination of the oxidation state at the cathodic and anodic pulses, the potential was stopped at the respective potential as described in our previous studies.22,23
Operando characterization
X-ray absorption spectroscopy (XAS) measurements were conducted at three synchrotron beamlines: (1) the ROCK beamline of SOLEIL synchrotron where quick XAFS (QXAFS) measurements of the catalyst during the cyclic voltammetry scans where acquired; (2) the SAMBA beamline of SOLEIL synchrotron, where steady-state measurements of time-averaged operando XAS data under pulsed CO2RR were collected, and (3) the SuperXAS – X10DA beamline at the Paul Scherrer Institute's SLS synchrotron facility, where operando QXAFS measurements under pulsed CO2RR were carried out.A channel cut Si(111) monochromator was used for energy selection in the QXAFS measurements at the ROCK and SuperXAS beamlines, with a monochromator oscillation frequency of 2 Hz at ROCK and 1 Hz at SuperXAS. At the SAMBA beamline, a Si(220) double crystal monochromator was used. To ensure approximately 10% absorption of the X-rays, the intensity of the X-rays before the sample was measured using an ionization chamber filled with pure N2 (ROCK, SuperXAS) or an N2 and He mixture (SAMBA). Additionally, the XAS measurements were performed in fluorescence mode with a PIPS detector (ROCK, SuperXAS) or a 35-channel Ge detector (SAMBA).
The XAS measurements were conducted at the Cu K-edge (8979 eV) and the Zn K-edge (9659 eV). A home-built single-compartment cell was used for operando XAS measurements, with the NC powder samples spray-coated on a gas diffusion electrode (Sigracet 29 BC, SGL Carbon) with an area of 1 cm2. The sample loading was optimized to approximately 1 mgSample cm−2 to achieve a sufficient signal-to-noise ratio at the Cu K-edge and the Zn K-edge while avoiding self-absorption effects.
To align and calibrate the XAS spectra, a Cu foil spectrum collected in transmission mode was used as a reference. In the case of SuperXAS measurements, a Cu foil spectrum was collected at the start of each QXAFS scan before the cell was moved into the X-ray beam. The data calibration at ROCK was performed by adjusting the energies of the monochromator glitches, while beamline-specific software was used to calibrate the QXAFS data at ROCK and SuperXAS. Further data processing, including data reduction, spectra normalization, averaging, and linear combination analysis of the XANES spectra, was carried out using a set of home-built Wolfram Mathematica scripts. The EXAFS data were obtained from averaged XAS spectra using the Athena software, and analysis of the Zn K-edge EXAFS data was performed using a machine learning-based approach.
Operando time-resolved high energy X-ray diffraction (HE-XRD) experiments were performed at ID31 of the European Synchrotron Radiation Facility (ESRF, Grenoble). The X-ray energy was set to 68 keV (λ = 0.18233 Å). A Dectris Pilatus X CdTe 2 M placed at a working distance of 1.387 m calibrated using a CeO2 standard was used to record the diffraction pattern. The acquisition time of the individual detector images was set to 10 s under stationary conditions and to 0.127 s for the time-resolved pulse experiments. Primary data treatment (calibration, masking, detector image integration) was conducted using the software package pyFAI.43
A homemade electrochemical cell based on a three-electrode configuration and continuous flow of electrolyte using a leak-free miniature Ag/AgCl reference electrode (3.4 M KCl, eDAQ ET072) and a platinum counter-electrode was used. The electrode potentials were controlled using a Biologic SP-300 potentiostat. The catalyst was deposited on HOPG with a loading of 0.1 mgCu cm−2. The incident X-ray angle was tuned between 0° and 1° to ensure an optimal Cu2O to graphite Bragg peak ratio, and to ensure a sufficiently small spread of the X-rays on the sample, thus avoiding parasitic peak broadening.
The data analysis of the diffraction patterns after integration of the detector images was conducted using a set of GNU Octave scripts to perform background pattern subtraction, peak fitting using Lorentz profiles, and averaging of the XRD data collected under pulsed CO2RR. Rietveld refinement was used to analyze the XRD pattern using the software package TOPAS (Bruker-AXS) in combination with the package Powder3D parametric.44 Here, variations in the zero error and the structural parameters of the Cu and Cu2O phases were considered (scale factor, lattice parameter, Gaussian size-induced and Lorentzian-type microstrain-induced peak broadening).
Furthermore, the analysis of single Bragg peaks such as Cu(311), Cu(111), Cu2O(111), and Cu2O(200) was also performed. The structural coherence length (size) of the crystalline domains was determined from the integral breadth of the Bragg peaks by use of the Scherrer equation with a shape factor of 0.89. The lattice strain was calculated from the lattice spacing d = λ/(2sinθ) with the strain = (d − d0)/d0, where d0 denotes the lattice spacing determined from the Bragg peak position at the end of the cathodic pulse.
Operando surface-enhanced Raman spectroscopy (SERS) was performed with a Raman spectrometer (Renishaw, InVia Reflex) together with an optical microscope (Leica Microsystems, DM2500M) and a motorized stage for tracking the sample (Renishaw, MS300 encoded stage). Calibration of the system was performed prior to each measurement using a Si(100) wafer (520.5 cm−1). A near-infrared laser (Renishaw, RL785, λ = 785 nm, Pmax = 500 mW) was used as an excitation source with a power of either 25 mW for the CuZn sample under OCP conditions or 2.5 mW under applied potential conditions in order to accommodate the changes in surface enhancement of the catalyst under reaction conditions. Operando Raman was collected with a water immersion objective (Leica microsystems, 63×, numerical aperture of 0.9), which was covered by a Teflon film (DuPont, film thickness of 0.013 mm) to protect it from the electrolyte. The electrochemical measurements were conducted in a custom-made spectro-electrochemical cell made of PTFE and controlled by a Biologic SP-240 potentiostat. The working electrode consists of the catalyst drop-casted onto a glassy carbon piece. The cell was further equipped with a leak-free Ag/AgCl reference electrode and a Pt counter electrode. A CO2-saturated 0.1 M KHCO3 solution was used as the electrolyte. The collection of each spectrum was performed with 0.25 s (for 4 s/1 s pulses) and 1 s (for 10 s/10 s pulses) of exposure time. The Raman data were first processed using the Renishaw WiRE 5.2 software to normalize the spectra and remove the cosmic rays. Then, GNU Octave scripts were used to correlate the electrochemical and Raman data, to fit the peaks using Gaussian profiles, and to average the SERS data.
Author contributions
A. H., A. B., B. R. C. and J. T. contributed to writing the original manuscript. A. B., H. S. J. and B. R. C. supervised the study. A. H. and D. K. prepared the samples. A. H. conducted and analyzed the electrocatalytic measurements and performed the SERS measurements, including the data analysis. A. H., M. R., H. S. J., J. T., U. H., E. M. D., F. T. H. and A. B. participated in the planning and performing the synchrotron measurements. M. R. and J. T. carried out the machine learning analysis of the XAS data. A. B. conducted the XRD Rietveld analysis. H. S. J., W. F. and S. K. performed the SEM/STEM measurements. C. R. conducted and analyzed the XPS measurements. All authors contributed to the discussion and interpretation of the data and revised the manuscript.Data availability
The catalytic performance data as well as additional XAS, XRD, Raman, TEM, and XPS supporting this article have been included as part of the ESI.† The raw XAS, XRD, and Raman data (requiring specialized software to be processed) are available from the corresponding authors on request.Conflicts of interest
The authors declare no conflict of interests.Acknowledgements
Financial support was provided by the German Research Foundation (DFG, 406944504 – SPP 2080) and Germany's Excellence Strategy (EXC 2008, 390540038, UniSysCat). We acknowledge the Paul Scherrer Institute, Villigen, Switzerland, for provision of synchrotron radiation beamtime at beamline SuperXAS. We thank A. Clark and M. Nachtegaal for assistance in using the SuperXAS beamline. We also acknowledge SOLEIL for provision of synchrotron radiation facilities, and we would like to thank the beam-line staff, in particular Dr Camille La Fotaine and Dr Valerie Briois for assistance in using the beamline “ROCK”, and Dr Andrea Zittolo and Dr Emiliano Fondoa for assistance in using the beamline “SAMBA”. We acknowledge the European Synchrotron Radiation Facility (ESRF) for provision of synchrotron radiation facilities, and we would like to thank Jakub Drnec for assistance and support in using beamline ID31. A. H., C. R., F. T. H. and D. K. acknowledge support by the IMPRS for Elementary Processes in Physical Chemistry. Open Access funding provided by the Max Planck Society.References
- S. Nitopi, E. Bertheussen, S. B. Scott, X. Y. Liu, A. K. Engstfeld, S. Horch, B. Seger, I. E. L. Stephens, K. Chan, C. Hahn, J. K. Norskov, T. F. Jaramillo and I. Chorkendorff, Progress and Perspectives of Electrochemical CO2 Reduction on Copper in Aqueous Electrolyte, Chem. Rev., 2019, 119(12), 7610–7672 CrossRef CAS PubMed.
- I. Sullivan, A. Goryachev, I. A. Digdaya, X. Q. Li, H. A. Atwater, D. A. Vermaas and C. X. Xiang, Coupling electrochemical CO2 conversion with CO2 capture, Nat. Catal., 2021, 4(11), 952–958 CrossRef CAS.
- M. Jouny, W. Luc and F. Jiao, General Techno-Economic Analysis of CO2 Electrolysis Systems, Ind. Eng. Chem. Res., 2018, 57(6), 2165–2177 CrossRef CAS.
- Y. Hori, Electrochemical CO2 Reduction on Metal Electrodes, Springer New York, 2008, pp. 89–189 Search PubMed.
- K. P. Kuhl, E. R. Cave, D. N. Abram and T. F. Jaramillo, New insights into the electrochemical reduction of carbon dioxide on metallic copper surfaces, Energy Environ. Sci., 2012, 5(5), 7050–7059 RSC.
- C. W. Li and M. W. Kanan, CO2 Reduction at Low Overpotential on Cu Electrodes Resulting from the Reduction of Thick Cu2O Films, J. Am. Chem. Soc., 2012, 134(17), 7231–7234 CrossRef CAS PubMed.
- A. Herzog, A. Bergmann, H. S. Jeon, J. Timoshenko, S. Kühl, C. Rettenmaier, M. Lopez Luna, F. T. Haase and B. Roldan Cuenya, Operando Investigation of Ag-Decorated Cu2O Nanocube Catalysts with Enhanced CO2 Electroreduction toward Liquid Products, Angew. Chem., Int. Ed., 2021, 60(13), 7426–7435 CrossRef CAS PubMed.
- C. Yin, Q. Li, J. Zheng, Y. Ni, H. Wu, A.-L. Kjøniksen, C. Liu, Y. Lei and Y. Zhang, Progress in regulating electronic structure strategies on Cu-based bimetallic catalysts for CO2 reduction reaction, Adv. Powder Technol., 2022, 1(4), 100055 Search PubMed.
- J. Gao, H. Zhang, X. Guo, J. Luo, S. M. Zakeeruddin, D. Ren and M. Grätzel, Selective C–C Coupling in Carbon Dioxide Electroreduction via Efficient Spillover of Intermediates As Supported by Operando Raman Spectroscopy, J. Am. Chem. Soc., 2019, 141(47), 18704–18714 CrossRef CAS PubMed.
- D. Ren, B. S.-H. Ang and B. S. Yeo, Tuning the Selectivity of Carbon Dioxide Electroreduction toward Ethanol on Oxide-Derived CuxZn Catalysts, ACS Catal., 2016, 6(12), 8239–8247 CrossRef CAS.
- L. R. L. Ting, O. Piqué, S. Y. Lim, M. Tanhaei, F. Calle-Vallejo and B. S. Yeo, Enhancing CO2 Electroreduction to Ethanol on Copper–Silver Composites by Opening an Alternative Catalytic Pathway, ACS Catal., 2020, 10(7), 4059–4069 CrossRef CAS.
- L. Wan, X. Zhang, J. Cheng, R. Chen, L. Wu, J. Shi and J. Luo, Bimetallic Cu–Zn Catalysts for Electrochemical CO2 Reduction: Phase-Separated versus Core–Shell Distribution, ACS Catal., 2022, 12(5), 2741–2748 CrossRef CAS.
- J. Timoshenko, H. S. Jeon, I. Sinev, F. T. Haase, A. Herzog and B. Roldan Cuenya, Linking the evolution of catalytic properties and structural changes in copper–zinc nanocatalysts using operando EXAFS and neural-networks, Chem. Sci., 2020, 11(14), 3727–3736 RSC.
- H. S. Jeon, I. Sinev, F. Scholten, N. J. Divins, I. Zegkinoglou, L. Pielsticker and B. R. Cuenya, Operando Evolution of the Structure and Oxidation State of Size-Controlled Zn Nanoparticles during CO2 Electroreduction, J. Am. Chem. Soc., 2018, 140(30), 9383–9386 CrossRef CAS PubMed.
- S. B. Varandili, D. Stoian, J. Vavra, K. Rossi, J. R. Pankhurst, Y. T. Guntern, N. López and R. Buonsanti, Elucidating the structure-dependent selectivity of CuZn towards methane and ethanol in CO2 electroreduction using tailored Cu/ZnO precatalysts, Chem. Sci., 2021, 12(43), 14484–14493 RSC.
- M. Rüscher, A. Herzog, J. Timoshenko, H. S. Jeon, W. Frandsen, S. Kühl and B. Roldan Cuenya, Tracking heterogeneous structural motifs and the redox behaviour of copper–zinc nanocatalysts for the electrocatalytic CO2 reduction using operando time resolved spectroscopy and machine learning, Catal. Sci. Technol., 2022, 12(9), 3028–3043 RSC.
- R. Casebolt, K. Levine, J. Suntivich and T. Hanrath, Pulse check: Potential opportunities in pulsed electrochemical CO2 reduction, Joule, 2021, 5(8), 1987–2026 CrossRef CAS.
- A. Engelbrecht, C. Uhlig, O. Stark, M. Hämmerle, G. Schmid, E. Magori, K. Wiesner-Fleischer, M. Fleischer and R. Moos, On the Electrochemical CO2 Reduction at Copper Sheet Electrodes with Enhanced Long-Term Stability by Pulsed Electrolysis, J. Electrochem. Soc., 2018, 165(15), J3059–J3068 CrossRef CAS.
- C. Kim, L.-C. Weng and A. T. Bell, Impact of Pulsed Electrochemical Reduction of CO2 on the Formation of C2+ Products over Cu, ACS Catal., 2020, 10(21), 12403–12413 CrossRef CAS.
- H. S. Jeon, J. Timoshenko, C. Rettenmaier, A. Herzog, A. Yoon, S. W. Chee, S. Oener, U. Hejral, F. T. Haase and B. Roldan Cuenya, Selectivity Control of Cu Nanocrystals in a Gas-Fed Flow Cell through CO2 Pulsed Electroreduction, J. Am. Chem. Soc., 2021, 143(19), 7578–7587 CrossRef CAS PubMed.
- K. W. Kimura, K. E. Fritz, J. Kim, J. Suntivich, H. D. Abruña and T. Hanrath, Controlled Selectivity of CO2 Reduction on Copper by Pulsing the Electrochemical Potential, ChemSusChem, 2018, 11(11), 1781–1786 CrossRef CAS PubMed.
- R. M. Arán-Ais, F. Scholten, S. Kunze, R. Rizo and B. Roldan Cuenya, The role of in situ generated morphological motifs and Cu(I) species in C2+ product selectivity during CO2 pulsed electroreduction, Nat. Energy, 2020, 5(4), 317–325 CrossRef.
- J. Timoshenko, A. Bergmann, C. Rettenmaier, A. Herzog, R. M. Arán-Ais, H. S. Jeon, F. T. Haase, U. Hejral, P. Grosse, S. Kühl, E. M. Davis, J. Tian, O. Magnussen and B. Roldan Cuenya, Steering the structure and selectivity of CO2 electroreduction catalysts by potential pulses, Nat. Catal., 2022, 5(4), 259–267 CrossRef CAS.
- K. W. Kimura, R. Casebolt, J. Cimada DaSilva, E. Kauffman, J. Kim, T. A. Dunbar, C. J. Pollock, J. Suntivich and T. Hanrath, Selective Electrochemical CO2 Reduction during Pulsed Potential Stems from Dynamic Interface, ACS Catal., 2020, 10(15), 8632–8639 CrossRef CAS.
- A. Herzog, M. Lopez Luna, H. S. Jeon, C. Rettenmaier, P. Grosse, A. Bergmann and B. Roldan Cuenya, Operando Raman spectroscopy uncovers hydroxide and CO species enhance ethanol selectivity during pulsed CO2 electroreduction, Nat. Commun., 2024, 15(1), 3986 CrossRef CAS PubMed.
- F. D. Speck and S. Cherevko, Electrochemical copper dissolution: A benchmark for stable CO2 reduction on copper electrocatalysts, Electrochem. Commun., 2020, 115, 106739 CrossRef CAS.
- S. Ishimaru, R. Shiratsuchi and G. Nogami, Pulsed Electroreduction of CO2 on Cu-Ag Alloy Electrodes, J. Electrochem. Soc., 2000, 147(5), 1864 CrossRef CAS.
- S. Jiang, K. Klingan, C. Pasquini and H. Dau, New aspects of operando Raman spectroscopy applied to electrochemical CO2 reduction on Cu foams, J. Chem. Phys., 2019, 150(4), 041718 CrossRef PubMed.
- I. Oda, H. Ogasawara and M. Ito, Carbon Monoxide Adsorption on Copper and Silver Electrodes during Carbon Dioxide Electroreduction Studied by Infrared Reflection Absorption Spectroscopy and Surface-Enhanced Raman Spectroscopy, Langmuir, 1996, 12(4), 1094–1097 CrossRef CAS.
- H. An, L. Wu, L. D. B. Mandemaker, S. Yang, J. de Ruiter, J. H. J. Wijten, J. C. L. Janssens, T. Hartman, W. van der Stam and B. M. Weckhuysen, Sub-Second Time-Resolved Surface-Enhanced Raman Spectroscopy Reveals Dynamic CO Intermediates during Electrochemical CO2 Reduction on Copper, Angew. Chem., Int. Ed., 2021, 60(30), 16576–16584 CrossRef CAS PubMed.
- H. S. Jeon, J. Timoshenko, F. Scholten, I. Sinev, A. Herzog, F. T. Haase and B. Roldan Cuenya, Operando Insight into the Correlation between the Structure and Composition of CuZn Nanoparticles and Their Selectivity for the Electrochemical CO2 Reduction, J. Am. Chem. Soc., 2019, 141(50), 19879–19887 CrossRef CAS PubMed.
- G. Niaura, Surface-enhanced Raman spectroscopic observation of two kinds of adsorbed OH- ions at copper electrode, Electrochim. Acta, 2000, 45(21), 3507–3519 CrossRef CAS.
- M. Moradzaman and G. Mul, In Situ Raman Study of Potential-Dependent Surface Adsorbed Carbonate, CO, OH, and C Species on Cu Electrodes During Electrochemical Reduction of CO2, ChemElectroChem, 2021, 8(8), 1478–1485 CrossRef CAS.
- H. Y. H. Chan, C. G. Takoudis and M. J. Weaver, Oxide Film Formation and Oxygen Adsorption on Copper in Aqueous Media As Probed by Surface-Enhanced Raman Spectroscopy, J. Phys. Chem. B, 1999, 103(2), 357–365 CrossRef CAS.
- C. Zhan, F. Dattila, C. Rettenmaier, A. Bergmann, S. Kühl, R. García-Muelas, N. López and B. Roldan Cuenya, Revealing the CO Coverage-Driven C–C Coupling Mechanism for Electrochemical CO2 Reduction on Cu2O Nanocubes via Operando Raman Spectroscopy, ACS Catal., 2021, 11(13), 7694–7701 CrossRef CAS PubMed.
- M. Luo, Z. Wang, Y. C. Li, J. Li, F. Li, Y. Lum, D.-H. Nam, B. Chen, J. Wicks, A. Xu, T. Zhuang, W. R. Leow, X. Wang, C.-T. Dinh, Y. Wang, Y. Wang, D. Sinton and E. H. Sargent, Hydroxide promotes carbon dioxide electroreduction to ethanol on copper via tuning of adsorbed hydrogen, Nat. Commun., 2019, 10(1), 5814–5820 CrossRef CAS PubMed.
- Y. Zhao, X. Chang, A. S. Malkani, X. Yang, L. Thompson, F. Jiao and B. Xu, Speciation of Cu Surfaces During the Electrochemical CO Reduction Reaction, J. Am. Chem. Soc., 2020, 142(21), 9735–9743 CAS.
- M. Wang, L. Jiang, E. J. Kim and S. H. Hahn, Electronic structure and optical properties of Zn(OH)2: LDA + U calculations and intense yellow luminescence, RSC Adv., 2015, 5(106), 87496–87503 RSC.
- J. Wang, Z. Zhu, X. Wei, Z. Li, J. S. Chen, R. Wu and Z. Wei, Hydrogen-Mediated Synthesis of 3D Hierarchical Porous Zinc Catalyst for CO2 Electroreduction with High Current Density, J. Phys. Chem. C, 2021, 125(43), 23784–23790 CrossRef CAS.
- Q. Zhang, D. Ren, J. Gao, Z. Wang, J. Wang, S. Pan, M. Wang, J. Luo, Y. Zhao, M. Grätzel and X. Zhang, Regulated CO adsorption by the electrode with OH− repulsive property for enhancing C–C coupling, Green Chem. Eng., 2023, 4(3), 331–337 CrossRef.
- G. Iijima, T. Inomata, H. Yamaguchi, M. Ito and H. Masuda, Role of a Hydroxide Layer on Cu Electrodes in Electrochemical CO2 Reduction, ACS Catal., 2019, 9(7), 6305–6319 CrossRef CAS.
- M. C. Biesinger, Advanced analysis of copper X-ray photoelectron spectra, Surf. Interface Anal., 2017, 49(13), 1325–1334 CrossRef CAS.
- J. Kieffer, V. Valls, N. Blanc and C. Hennig, New tools for calibrating diffraction setups, J. Synchrotron Radiat., 2020, 27(2), 558–566 CrossRef CAS PubMed.
- P. Rajiv, R. E. Dinnebier and M. Jansen, “Powder 3D Parametric”- A program for Automated Sequential and Parametric Rietveld Refinement Using Topas, Mater. Sci. Forum, 2010, 651, 97–104 Search PubMed.
Footnotes |
| † Electronic supplementary information (ESI) available. See DOI: https://doi.org/10.1039/d4ee02308k |
| ‡ Present address: Massachusetts Institute of Technology, Research Laboratory of Electronics, 77 Massachusetts Ave, Cambridge, MA 02139, USA. |
| This journal is © The Royal Society of Chemistry 2024 |