Optimizing low-voltage boosting for an air-cathode microbial fuel cell with an anion exchange membrane in a 246 L wastewater treatment reactor†
Ayano
Shimidzu‡
a,
Fumichika
Tanaka
a,
Takahiro
Matsumura
b,
Mitsuhiro
Sakoda
c,
Kazuki
Iida
d and
Naoko
Yoshida‡
 *a
*a
aDepartment of Civil Engineering, Nagoya Institute of Technology (Nitech), Japan. E-mail: yoshida.naoko@nitech.ac.jp; Tel: +81 527 895 437
bResearch Center, Toyobo Co. Ltd., 2-1-1 Katata, Otsu, Shiga, Japan
cWater & Sewage Department, Nippon Koei Urban Space Co., Ltd., 2-17-14 Higashisakura, Higashi-ku, Nagoya, Aichi, Japan
dRiver & Water Resources Division, Nippon Koei Co. Ltd., 5-4 Kojimachi, Chiyoda-ku, Tokyo, Japan
First published on 27th November 2023
Abstract
Microbial fuel cells (MFCs) have been applied in wastewater treatment; however, the secondary use of recovered electricity has been rarely investigated. Here, we aimed to optimize electricity recovery and the secondary use strategy using a 246 L reactor packed with 12 tubular air-cathode MFC units using an anion exchange membrane (AEM) as the separator. Parallelly connected eight MFC units exhibited a maximum electric power, 3.5-fold higher than a single MFC, from 16 to 58 mW; however, the power density was the highest for a single MFC or two MFCs considered together, at 0.10 and 0.11 W m−2, respectively, and decreased for more than three MFCs. Electricity recovery from the MFCs by changing the combination ratios of the MFCs and two DC/DC converters, LTC3105 and ADP5090, was the most efficient (60%) considering the connection of a single MFC and ADP5090, respectively. The 12 pairs of MFCs and ADP5090 in 245 L wastewater powered an aeration pump to achieve 0.39 L h−1 aeration flow in wastewater, an air fan to have 12.8 L h−1 air-flow, and lit two LEDs. Thus, the electricity generated by MFCs treating wastewater could be used to operate various devices, although improvements in individual MFCs are necessary for practical implementation.
Water impactOne critical technical problem for microbial fuel cells (MFCs) treating wastewater is the secondary use of recovered electricity. In a comparison of MFC connections, a pair of an MFC to ADP5090 of a DC/DC converter exhibited the highest electricity recovery efficiency of 60%. The 12 pairs of MFCs and ADP5090s in 245 L wastewater powered a mini air pump to achieve a 0.39 L h−1 (1.6 L h−1 m−3) aeration rate in wastewater and partially increased the dissolved oxygen in the reactor. |
1. Introduction
Wastewater treatment is becoming important in terms of conserving public water quality and as a resource for reclaimed water due to water shortages1 and pollution of public water resources.2 Municipal wastewater treatment accounts for 0.7–4.0% of domestic electricity consumption in developed countries3,4 although sewage has a biomass energy potential equivalent to approximately 9.3 times that of electricity consumption.5 It is estimated that over 0.67 kW h kg-COD−1 or 1.8 kW h per kg-sludge of energy recovery could help a sewage system to maintain itself in terms of energy. Typically, sludge has been converted successfully to biogas6 and solid fuel.7 However, the technologies facilitating energy recovery from wastewater are still in the research stage; these technologies include microalgae cultivation, membrane-enriched fermentation, and microbial fuel cell (MFC) technology.8–10 Among them, the MFC technology is the only technology that helps directly convert chemical energy into electricity.11,12 An MFC is a device that generates electricity by recovering electrons emitted during the microbial decomposition of organic matter; moreover, its use is advantageous in wastewater treatment as aeration is not required.11,13 However, the power generated by MFCs in wastewater is low, and various issues have to be addressed before the practical application of MFCs.14 The theoretical voltage of an MFC is 1.14 V based on the potential difference between the redox potential of organic matter (NADH) at the anode (−0.32 V) and that of oxygen at the air cathode (0.82 V).15 However, the open-circuit voltage (OCV) of MFCs is only 0.4–0.7 V, which is attributable to the voltage loss due to activation loss, concentration loss, and ohmic loss.14,16–18 The low voltage is insufficient to power devices; moreover, it essentially needs to be boosted for the secondary use of recovered electricity. A simple strategy to boost the output voltage from MFCs involves connecting multiple MFCs in series or parallel. However, the MFCs connected in series often fail to boost the voltage due to voltage inversion.19,20 A parallel connection has helped to successfully boost the voltage from 0.6 to 1.05 V,20 although, the voltage has never exceeded the theoretical voltage.21 An effective way to boost the low voltage of an MFC is by creating a module of MFCs connected parallelly, and then by connecting this module in series.22Another way of boosting voltage using MFCs is by voltage multiplier circuits. To date, various DC/DC converters have been used to boost the voltage of MFCs; these include L6920DB (STMicroelectronics, Geneva, Switzerland), LTC3108 (Linear Technology, MA, USA), TPS61200 (Texas Instruments, Dallas TX, USA), or BQ25504 (Texas Instruments). The input and output voltages range from 0.2 to 0.4 V and 2.0 to 3.3 V, respectively.20,22–25 Recently, a voltage multiplier circuit that boosts voltage up to 100 V without using a commercial DC/DC converter was developed.26 The power recovery efficiency is limited, ranging from 4.3% to 53%; moreover, greater the gap between the input and output voltages, lower the power recovery efficiency. The boosted electricity has been used as a power source for light-emitting diodes (LEDs),25 a sensing and data transmission system,23 and pumps,22 as well as for charging a mobile phone battery.27
Here, we examined the applicability of two different DC/DC converters, viz., LTC3105 and ADP5090, to boost a tubular air-cathode MFC using an anion exchange membrane (AEM) as the separator,3,28 which is superior to an MFC with a cation exchange membrane in terms of power recovery29 and has been successfully scaled up to 226 L.30 First, the connection of 1–12 MFC units was evaluated based on the electricity produced and electric density; thereafter, the MFCs were boosted using two DC/DC converters and the secondary use of the electricity was evaluated.
2. Experimental
2.1 MFC
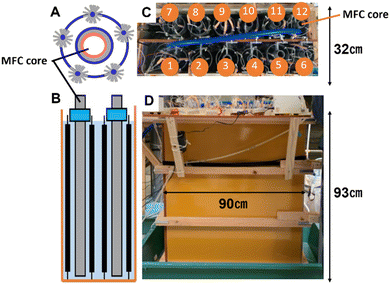
Here, a cylindrical MFC core (diameter: 5 cm; length: 1 m) with an air cathode28 made of a stainless-steel mesh surrounded by a carbon-based cathode was used, along with an AEM (ASE; Astom Co., Ltd., Tokyo, Japan) and nonwoven graphite fabric (TOYOBO Co., Ltd., Osaka, Japan). A mixture of poly(diallyldimethylammonium chloride) (PDDMAC) and polytetrafluoroethylene (PTFE)3 was used as a binder in a carbon catalyst paste. As an anode, five carbon brushes (CBs) (diameter: 4 cm; length: 1 m) were placed around the MFC core in addition to the nonwoven graphite fabric (NWGF). The carbon brushes were manufactured using carbon fabrics (T300B-3k-40B; Toray, Tokyo, Japan), soaked in acetone, and heated at 450 °C for 5 h before use31 to make the surface hydrophilic for microbial adhesion.32 The anodes of NWGF and CBs were immersed in a sewage sludge suspension prior to operation, as described previously.332.2 Operation of the MFC reactors
Twelve sets of an MFC core with five CBs were installed in a cuboid reactor (32 cm × 90 cm × 93 cm) made of polyvinyl chloride and reinforced with wood (Fig. 1), and were filled with 246 L of the effluent from a primary sedimentation tank (PST). The reactor was operated in a sewage wastewater treatment plant (Nagoya City) and continuously supplied with the PST effluent using a tubing pump (TP-20SA; AS ONE, Osaka, Japan) for a hydraulic retention time (HRT) of 12 h. The wastewater in the reactor was circulated at a circulation duration of 12 min using a submersible pump. The cathode and anode of the MFC were connected via an external resistor (Rext) of 1 Ω and a multi-channel data logger (LR-8400; Hioki, Nagano, Japan) in parallel to the Rext. The cell voltage between anode and cathode connected via the Rext was recorded every hour. The CODs in the influent and effluent were measured by Toa Environmental Services Co. (Nagoya, Japan) as described previously.34The 12 MFC units were first operated in a parallel connection considering three MFC units in a module (Fig. S1†); furthermore, the cell voltages for four modules (3P-M1·2·7, 3P-M3·8·9, 3P-M4·10·11, and 3P-M5·6·12) were recorded via 22 and 1 Ω of an Rext. After 10 d of operation, six MFC units were connected in parallel via 150 Ω of an Rext in a module; furthermore, two modules were connected in series (6P-2S) via 5 Ω of an Rext. Finally, the 12 MFC units were operated independently after 24 d and their cell voltages were measured for 11 d.
2.3 Polarization curve
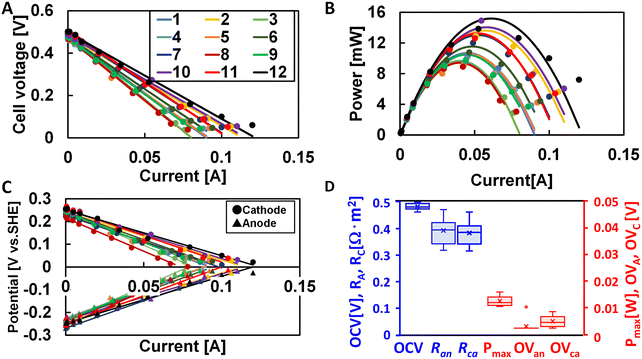
The power density curves were measured for the 12 MFC units with an HRT of 12 h, at 11 d after the start of operation. The MFC units were connected in parallel with a variable resistance (0.5–1000 Ω) (MCP, Toyama, Japan) of Rext as previously described.33 An Ag/AgCl reference electrode (RE-1B; BAS Co., Ltd., Tokyo, Japan) was installed around 15 cm from the water surface near the MFC core, and the anode and cathode potentials were measured. The Ag/AgCl potential was 0.186 V versus a standard hydrogen electrode (SHE). The anode (Ran) and cathode resistances (Rca) of the MFC and ohmic resistance (RΩ) were determined using the eqn (1)–(3):| EAn = EAn,e0 − OVA − IRA, | (1) |
| ECat = EC,e0 − OVC − IRC, | (2) |
| E = EC − EA − IRΩ. | (3) |
2.4 DC–DC boost converter operation
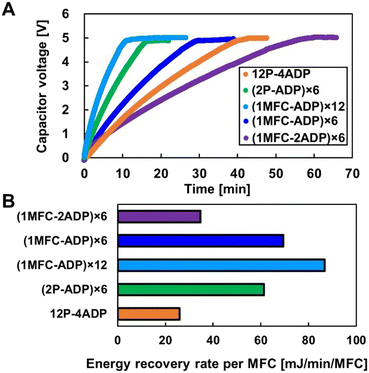
A schematic diagram of the boost converter system using two DC/DC converters, LTC3105 (Linear Technology, Milpitas, CA, USA) and ADP5090 (Analog Devices, Norwood, MA, USA), is presented in Fig. S2A.† These two converters were selected for their superiority in handling minimum applicable voltages: 0.25 V for the LTC3105 and 0.38 V for the ADP509. The boost voltage was 5 V. For ADP5090, six different connections by changing the number of DC/DC converters per MFC were evaluated while a capacitor (1F) was charged. Furthermore, 12P-4ADP was the connection of 12 MFC units in parallel, and it was connected to four ADP5090; (2P-ADP) × 6, was connecting two MFC units in parallel to six ADP5090; (1MFC-ADP) × 12 and (1MFC-ADP) × 6 were connecting 12 and 6 MFC units to DC/DC converters, respectively; and (1MFC-2ADP) × 6 was connecting six sets of a connection of single MFC units to two ADP5090 (Fig. S2B†). In some cases, a mini air pump (KPM130B-3A; Koge Micro Tech Co., Ltd., New Taipei City, Taiwan), fan (YDM2507C05F; Akizuki Denshi Tsusho Co., Ltd., Japan), or white LED (osw5dk5b62a-5v; Akizuki Denshi Tsusho Co., Ltd.) were connected to the output. The output voltage was measured every second using a voltage data logger. The mini-pump was set at 10–50 cm depth and connected to the capacitor. Dissolved oxygen was monitored at 10 cm depth and at 0, 10, and 20 cm of horizontal distance from the mini air pump.3. Results and discussion
3.1 Acclimation of MFCs with different connection modes
The power production by four modules (3P-M1·2·7, 3P-M3·8·9, 3P-M4·10·11, and 3P-M5·6·12) that connected three MFC units in parallel were monitored (Fig. S1†). The power density gradually increased from 4 mW (9 mW m−2) on the starting day and reached to 45–60 mW (0.1–0.13 W m−2) on day 6 (Fig. S3†). The MFC operated with continuous sewage supplementation at a 12 h HRT resulted in an approximate 50% reduction of COD decreasing from 170 mg L−1 in the influent to 87 mg L−1 in the effluent from day 10 to day 33. Simultaneously, a reduction in BOD from 72 to 38 mg L−1 was observed during the same period (Fig. S4†). The MFCs were then operated in a module serially connecting two sub-modules of six MFC units connected in parallel (6P-2S) after 10–20 d; however, the data during 10–15 d was accidently lost. The 6P-2S module exhibited a higher voltage (0.65 V) than the 3P modules (0.09–0.25 V), but a lower power (23–27 mW). Finally, the MFCs were operated independently from 24 to 35 d; furthermore, they exhibited a power output of 5–14 mW (power density: 0.04–0.08 W m−2), while an irregular variance was observed in some MFCs due to a failure in electric connections rather than a variance in the MFC units. The parallel connection, rather than a series connection, helped recover power more effectively from the multiple MFCs with a density equivalent to that of a single MFC unit, as previously observed.30 MFCs connected in series have been reported to facilitate an increase in the power output in hydraulically independent MFCs;34 however, it facilitated a decrease in the power output from MFCs hydraulically connected. This was caused by a short circuit35 in the shared electrolyte source.363.2 Individual MFC performances
The variance in the performance of the 12 individual MFC units was investigated (Fig. 2). The open circuit voltage (OCV) was 0.48 ± 0.011 V and quite similar among the 12 MFC units. At the OCV, the anode and cathode potentials – were 0.24 ± 0.013 and 0.24 ± 0.0097 V vs. standard hydrogen electrode (SHE), respectively. The maximum power (Pmax) was 11 ± 1.9 mW (71 ± 12 mW m−2) with 1 Ω of Rext. The RA and RC were 0.39 ± 0.014 and 0.38 ± 0.013 Ω m2, respectively. The variance of Pmax with a standard deviation of 17% of the average was attributed to the differences in the anode and cathode resistances rather than to those in the OCV, overpotential, and ohmic resistance. The differences in substrate accessibility and biofilm thickness in the anode or the nonuniform spread of cathodic ink or oxygen availability possibly contributed to the variance in the MFC performances in a relatively large reactor.373.3 Connecting multiple MFCs in parallel
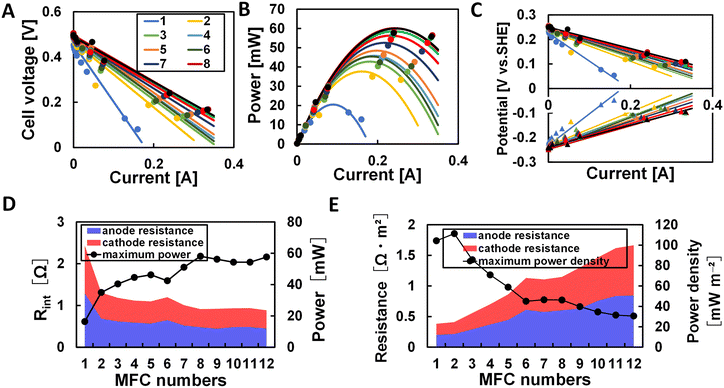
The effect of a parallel connection on the power generated by the MFCs was evaluated by increasing the MFC units from 1 to 12 (Fig. 3). Overall, the increase in units from one to eight facilitated an increase in the power generated (Fig. 3). Eight MFC units generated a power output 3.5-fold higher than that of a single MFC, that is, from 16 to 58 mW of Pmax by a slight increase in the OCV (0.48 to 0.51 V) (Fig. 3A and B) and reducing the RA (1.3 to 0.48 Ω) and RC (1.1 to 0.43 Ω) (Fig. 3D) based on the slope of anode/cathode potential at different current production (Fig. 3C). However, connecting more than eight MFC units did not facilitate further increase in the total power recovery. The power density that power divided by the cathode area is an effective parameter to consider the efficiency of electricity recovery by the applied electrode. The power density exhibited distinct trend compared to the power. The best results were obtained when connecting one or two MFCs, with the values of 0.104 and 0.11 W m−2, respectively. Further connecting 3–12 units resulted in a decrease in power density (Fig. 3E). The connection of eight MFC units contributed to a 44% reduction in the power output (46 m W m−2) compared to that of a single unit. The reduction was attributed to the increase in RA (0.20 to 0.60 Ω m2) and RC (0.18 to 0.54 Ω m2), considering the project area.A parallel connection of multiple MFC units can simply and effectively help achieve a higher power output; moreover, this has been applied in many cases to recover energy.3,22 However, a decrease in the power density apparently indicates the ineffectiveness in recovering energy from a certain electrode area or a volume of wastewater. The decrease in the energy recovery efficiency was attributed to the inefficient collection of current into the load resistance, owing to the dispersion of current even within an anode or cathode due to different local potentials. This was probably one of factors that reduce power density recovery in the scaling-up of MFCs.38 A high internal resistance have been attributed to anode and cathode overpotentials, substrate concentration, membrane resistance, and solution resistance.39 In this study, electrode resistances increased in the step of scaling-up; however, the overpotential and solution resistance changed insignificantly. The membrane resistance depended on the operation time or depth, and the effect on the cathode reaction was negligible.29
3.4 Boosting voltage using DC/DC converters
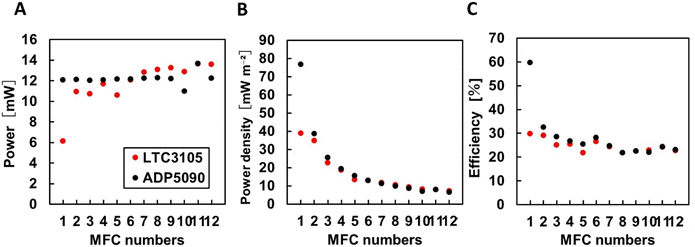
Based on the power produced by an MFC, two different DC/DC converters, LTC3105 and ADP5090, were connected to either a single MFC or a module of multiple MFCs connected in parallel; thereafter, the power production was evaluated (Fig. 4A and B). Boosting the voltage to 5 V using LTC3105 and ADP5090 resulted in a reduction of Pmax by 30% (6.1 mW) and 60% (12 mW) from the original Pmax of 20 mW in a single MFC unit, respectively (Fig. 4C). The power output was similar when multiple MFCs were connected in parallel to ADP5090. Considering a power recovery efficiency using the Pmax density of a single MFC or multiple MFCs in parallel, the efficiency was the highest by connecting a single MFC to either of the converters. A maximum efficiency of 60% was achieved by connecting an MFC and ADP5090, one after the other; furthermore, the efficiency was twice that when LTC3105 was used.Next, 12 MFC units were connected to 4, 6, and 12 ADP5090s and evaluated under the charge of the 1F capacitor (Fig. 5A). Among the three connections, connecting a single MFC and an ADP5090 resulted in a full charge in the shortest time of 10 min. The result indicates that a single MFC is sufficient for ADP5090 to function. The charging time of a single and two ADP5090 devices connected to a single MFC was compared using six MFC units with 6 and 12 ADP5090s, respectively. Connecting an MFC to two ADP5090s required approximately twice the charging time than that with a one-to-one connection. Based on the data, the energy recovery rate per single MFC were compared in Fig. 5B. The value indicates that a one-to-one connection with an ADP5090 and increasing the number of sets of MFCs and ADP5090s is the most efficient.
To date, various commercial DC/DC converters have boosted electric power recovered from actual wastewater using a charge pump-capacitor-converter, L6920DB,40 inductor-based converters (LTC3108 (ref. 25) and TPS61200 (ref. 24)), and BQ25504, all of which help control the input voltage by maximum power point tracking (MPPT) based on the fractional open-circuit voltage method.22 LTC3108 was the most popular converter owing to the low VIN (0.2 V) requirement; however, the electric power efficiency was 4.3% in a 316 mL air-cathode MFC treating domestic wastewater.40 Moreover, the efficiency could be raised to 37% depending on the input power of the MFC.23 The BQ25504 and LTC3105 converters reportedly have a conversion efficiency of approximately 60%; however, the efficiency of an MFC in treating wastewater has never been determined.41 Our study showed that ADP5090 had a power efficiency of 60%; moreover, it also had the function of MPPT as in the BQ25504 and LTC3105 converters. The use of MPTT to recover energy from an MFC is highly suitable in achieving a higher and stable efficiency than that with an MFC connected with a fixed load resistance.42,43
3.5 Secondary use of boosted power
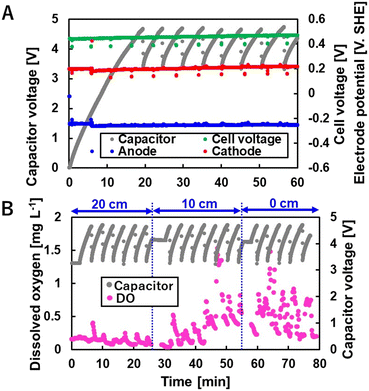
Next, the MFCs were applied as the power source for the three devices listed in Table 1. The 12 MFC units continuously lit up two white LEDs, but not three LEDs. A DC fan worked for 45 s every 8 min and provided 12.8 L h−1 per reactor air-flow. Approximately 2 L of air was exchanged through the air-flow every 2 h. A mini air-pump could run intermittently for 30 s every 5.0 min (Fig. 6A); furthermore, this corresponded to 0.45 L h−1 aeration rate at a depth of 50 cm. The aeration rate was considerably less than that in the reactors with limited aeration succeeding in the simultaneous removal of organic matter and nitrogenous compounds, microbial electrochemical system (MES),44 vertical flow constructed wetland,45 and up-flow partially aerated biological filter.46 The aeration provided 0.54 mg L−1 average dissolved oxygen (DO) above the air pump (Fig. 6B), although the average DO values decreased to 0.39 and 0.14 from 10 and 20 cm horizontal distances, respectively. The DO is reportedly an important factor for nitrification, and 0.5 mg L−1 DO is required for nitrite and ammonia oxidization.47 This observation suggests that the mini air-pump driven by power generated by the MFCs possibly enhances ammonia oxidization; however, the effective volume of the DO being more than 0.5 mg L−1 of the average, was less than 6.4% of the total wastewater volume.| Device | Specification | Condition | Operation |
|---|---|---|---|
| White LED | Forward voltage (VF): 5 V, forward current (IF): 12 mA | Single LED | Always lighting (56–70 lx at 15-cm distance) |
| Two LED | Always lighting | ||
| Three LED | No lighting | ||
| Micro fan | Rated voltage: 5 V | Single | 16 s of working every 8 min of charging (52 L h−1 m−3 or 12.8 L h−1 per reactor) |
| Rated current: 160 mA | |||
| Rotation speed: 10000 rpm | |||
| Mini air pump | Rated voltage: 2.2 V | Single | 4 s of working every 5 min of charging (1.6 L h−1 m−3 or 0.39 L h−1 per reactor) |
| Rated current: 3 A |
In this study, ADP5090 was selected due to the low voltage applicable for the boosting. A higher anode potential3 resulted in a lower voltage of the MFC but led to more COD degradation. An anode potential of +0.7 V vs. SHE is required for the electrochemical microbial oxidization. The boosting system still has 0.40 V of the MFC input voltage with −0.2 V vs. SHE and +0.2 V of anode and cathode potentials, respectively. The voltage of MFC should be recovered as more current to improve water quality. Thus, the COD or ammonia removal is the trade-off relationship with the boosting efficiency that decreases with low input voltages. The integrated evaluation of water quality and energy recovery should be established to optimize the strategy for the secondary use of electricity.
4. Conclusions
In this study, we optimized electricity recovery and the secondary use strategy for MFCs using an anion exchange membrane separator. The most suitable strategy involved connecting an MFC to ADP5090 of a DC/DC converter; it exhibited the highest efficiency of 60%. The 12 pairs of MFCs and ADP5090s in 245 L wastewater lit up two LEDs, and powered a fan to achieve 12.8 L h−1 (52.0 L h−1 m−3) air-flow and a mini air pump to achieve 0.39 L h−1 (1.6 L h−1 m−3) aeration rate in wastewater.Author contributions
A. S.: investigation, writing – original draft, F. T.: writing – review & editing, T. M.: resources, M. S.: project administration, K. I.: project administration, funding acquisition N. Y.: conceptualization, writing – original draft, review & editing, funding acquisition.Conflicts of interest
There are no conflicts to declare.Acknowledgements
This study was funded by the MEXT/JSPS KAKENHI grant (22H01625); Sewage Application Research by the Ministry of Land, Infrastructure, Transport and Tourism (MLIT); and SATREPS by JST and JICA. The project was also supported by Nippon Koei Co., Ltd. and Tamano Consultants Co., Ltd. We appreciate the staff at the Nagoya City Waterworks and Sewerage Bureau for their technical advice and permission to work at the site. We thank Akihiro Iwata of Tamano Consultants Co., Ltd. for their technical support during the reactor construction and Hideaki Hashimoto, Toshiyuki Yagi, and Kyo Ikeru (Nitech) for their support in MFC operation.References
- L. Guppy, P. Uyttendaele, K. G. Villholth and V. Smakhtin, Groundwater and Sustainable Development Goals: Analysis of Interlinkages, 2018, vol. 26 Search PubMed.
- UNESCO, The United Nations World Water Development Report 2021 VALUINGWATER, 2021 Search PubMed.
- M. Sugioka, N. Yoshida and K. Iida, Front. Energy Res., 2019, 7, 1–9 CrossRef.
- M. Lu, S. Chen, S. Babanova, S. Phadke, M. Salvacion, A. Mirhosseini, S. Chan, K. Carpenter, R. Cortese and O. Bretschger, J. Power Sources, 2017, 356, 274–287 CrossRef CAS.
- I. Shizas and D. M. Bagley, J. Energy Eng., 2004, 130, 45–53 CrossRef.
- P. Jin, Y. Gu, X. Shi and W. Yang, Biotechnol. Biofuels, 2019, 12, 1–11 CrossRef PubMed.
- M. Franz, Waste Manage., 2008, 28, 1809–1818 CrossRef CAS PubMed.
- M. Maktabifard, E. Zaborowska and J. Makinia, Rev. Environ. Sci. Biotechnol., 2018, 17, 655–689 CrossRef.
- C. Power, A. McNabola and P. Coughlan, Sustain. Energy Technol. Assess., 2014, 7, 166–177 Search PubMed.
- S. Vinardell, S. Astals, M. Peces, M. A. Cardete, I. Fernández, J. Mata-Alvarez and J. Dosta, Renewable Sustainable Energy Rev., 2020, 130, 109936 CrossRef CAS.
- B. E. Logan, B. Hamelers, R. Rozendal, U. Schröder, J. Keller, S. Freguia, P. Aelterman, W. Verstraete and K. Rabaey, Environ. Sci. Technol., 2006, 40, 5181–5192 CrossRef CAS PubMed.
- C. Santoro, C. Arbizzani, B. Erable and I. Ieropoulos, J. Power Sources, 2017, 356, 225–244 CrossRef CAS PubMed.
- T. Huggins, P. H. Fallgren, S. Jin and Z. J. Ren, J. Microb. Biochem. Technol., 2013, S6, 002 Search PubMed.
- H. Wang, J. Do Park and Z. J. Ren, Environ. Sci. Technol., 2015, 49, 3267–3277 CrossRef CAS PubMed.
- S. B. Pasupuleti, S. Srikanth, X. Dominguez-Benetton, S. V. Mohan and D. Pant, J. Chem. Technol. Biotechnol., 2016, 91, 624–639 CrossRef CAS.
- P. Liang, X. Huang, M. Z. Fan, X. X. Cao and C. Wang, Appl. Microbiol. Biotechnol., 2007, 77, 551–558 CrossRef CAS PubMed.
- P. Y. Zhang and Z. L. Liu, J. Power Sources, 2010, 195, 8013–8018 CrossRef CAS.
- O. Lefebvre, A. Uzabiaga, I. S. Chang, B. H. Kim and H. Y. Ng, Appl. Microbiol. Biotechnol., 2011, 89, 259–270 CrossRef CAS PubMed.
- S. E. Oh and B. E. Logan, J. Power Sources, 2007, 167, 11–17 CrossRef CAS.
- L. Zhuang, Y. Zheng, S. Zhou, Y. Yuan, H. Yuan and Y. Chen, Bioresour. Technol., 2012, 106, 82–88 CrossRef CAS PubMed.
- P. Aelterman, K. Rabaey, H. T. Pham, N. Boon and W. Verstraete, Environ. Sci. Technol., 2006, 40, 3388–3394 CrossRef CAS PubMed.
- Z. Ge and Z. He, Environ. Sci.: Water Res. Technol., 2016, 2, 274–281 RSC.
- T. Yamashita, T. Hayashi, H. Iwasaki, M. Awatsu and H. Yokoyama, J. Power Sources, 2019, 430, 1–11 CrossRef CAS.
- B. Zhang and Z. He, RSC Adv., 2012, 2, 10673–10679 RSC.
- T. Kim, J. Yeo, Y. Yang, S. Kang, Y. Paek, J. K. Kwon and J. K. Jang, J. Power Sources, 2019, 410–411, 171–178 CrossRef CAS.
- N. J. Koffi and S. Okabe, Sci. Rep., 2020, 10, 18985 CrossRef CAS PubMed.
- J. Prasad and R. K. Tripathi, Biosens. Bioelectron., 2021, 172, 112767 CrossRef CAS PubMed.
- T. Yamane, N. Yoshida and M. Sugioka, RSC Adv., 2021, 11, 20036–20045 RSC.
- R. Itoshiro, N. Yoshida, T. Yagi, Y. Kakihana and M. Higa, Membranes, 2022, 12, 183 CrossRef CAS PubMed.
- M. Sugioka, N. Yoshida, T. Yamane, Y. Kakihana, M. Higa, T. Matsumura, M. Sakoda and K. Iida, Environ. Res., 2022, 205, 112416 CrossRef CAS PubMed.
- Y. Feng, Q. Yang, X. Wang and B. E. Logan, J. Power Sources, 2010, 195, 1841–1844 CrossRef CAS.
- N. Yoshida, Y. Miyata and K. Iida, RSC Adv., 2019, 9, 39348–39354 RSC.
- Y. Goto, N. Yoshida, Y. Umeyama, T. Yamada, R. Tero and A. Hiraishi, Front. Bioeng. Biotechnol., 2015, 3, 42 CrossRef PubMed.
- X. A. Walter, I. Gajda, S. Forbes, J. Winfield, J. Greenman and I. Ieropoulos, Biotechnol. Biofuels, 2016, 9, 1–11 CrossRef PubMed.
- L. Zhuang and S. Zhou, Electrochem. Commun., 2009, 11, 937–940 CrossRef CAS.
- B. Kim, J. An, D. Kim, T. Kim, J. K. Jang, B. G. Lee and I. S. Chang, Electrochem. Commun., 2013, 28, 131–134 CrossRef CAS.
- S. C. Popat and C. I. Torres, Bioresour. Technol., 2016, 215, 265–273 CrossRef CAS PubMed.
- S. Cheng and B. E. Logan, Bioresour. Technol., 2011, 102, 4468–4473 CrossRef CAS PubMed.
- P. Clauwaert, P. Aelterman, T. H. Pham, L. De Schamphelaire, M. Carballa, K. Rabaey and W. Verstraete, Appl. Microbiol. Biotechnol., 2008, 79, 901–913 CrossRef CAS PubMed.
- D. Zhang, F. Yang, T. Shimotori, K. C. Wang and Y. Huang, J. Power Sources, 2012, 217, 65–71 CrossRef CAS.
- C. L. Nguyen, B. Tartakovsky and L. Woodward, ACS Omega, 2019, 4, 18978–18986 CrossRef CAS PubMed.
- Y. E. Song, M. M. El-Dalatony, C. Kim, M. B. Kurade, B. H. Jeon and J. R. Kim, Int. J. Hydrogen Energy, 2019, 44, 2372–2379 CrossRef CAS.
- Y. E. Song, H. C. Boghani, H. S. Kim, B. G. Kim, T. Lee, B. H. Jeon, G. C. Premier and J. R. Kim, Energy Technol., 2016, 4, 1427–1434 CrossRef CAS.
- W. He, Y. Dong, C. Li, X. Han, G. Liu, J. Liu and Y. Feng, Water Res., 2019, 372–380 CrossRef CAS PubMed.
- H. Wu, J. Fan, J. Zhang, H. H. Ngo, W. Guo, Z. Hu and J. Lv, Int. Biodeterior. Biodegrad., 2016, 113, 139–145 CrossRef CAS.
- C. Tao, T. Peng, C. Feng, N. Chen, Q. Hu and C. Hao, Bioresour. Technol., 2016, 218, 307–317 CrossRef CAS PubMed.
- K. Hanaki, C. Wantawin and S. Ohgaki, Water Res., 1990, 24, 297–302 CrossRef CAS.
Footnotes |
| † Electronic supplementary information (ESI) available. See DOI: https://doi.org/10.1039/d3ew00448a |
| ‡ These authors contributed equally to this study. |
| This journal is © The Royal Society of Chemistry 2024 |

