 Open Access Article
Creative Commons Attribution 3.0 Unported Licence
Process intensified lauric acid self-ketonization and its economic and environmental impact on biolubricant base oil production†
Tejas
Goculdas‡
ab,
Zhifei
Yuliu‡
b,
Sunitha
Sadula
 ab,
Weiqing
Zheng
 ab,
Basudeb
Saha
 c,
Arvind
Nanduri
 c,
Marianthi
Ierapetritou
 ab and
Dionisios G.
Vlachos
 *ab
*ab
aDelaware Energy Institute, University of Delaware, Newark, 19716, USA
bDepartment of Chemical and Biomolecular Engineering, University of Delaware, Newark, 19716, USA
cRiKarbon, Inc., 550 S. South College Ave, Newark, Delaware 19716, USA
First published on 3rd July 2024
Abstract
Lubricant base oils, traditionally derived from non-renewable petroleum, contribute significantly to greenhouse gas emissions. In contrast, oils sourced from furfural and long-chain ketones through aldol condensation and hydrodeoxygenation present a renewable, cost-effective, and environmentally friendly alternative, offering superior cold flow properties. However, the production of long-chain ketones, a crucial component, currently relies on solvent dewaxing in refineries, which is costly and non-selective. One promising biobased approach involves self-ketonization of long-chain fatty acids derived from coconut or palm kernel oils. This method typically employs high boiling point solvents like dodecane or is done in a batch configuration, limiting its scale and industrial viability. This study addresses this bottleneck by eliminating solvents, transitioning to a continuous flow reactor, and achieving kilogram-scale production of long-chain ketones with exceptional selectivity (90%). The lab-scale setup can yield up to 25 kg of 12-tricosanone per month, utilizing earth-abundant MgO as a catalyst. The catalyst underwent slight deactivation due to carbonate formation. Catalyst stabilization, using mixed metal oxides, and regeneration via simple calcination in air are also discussed. Techno-economic analysis (TEA) indicates a 29% lower minimum selling price than the commercial synthetic poly alpha olefin (PAO). Life cycle assessment (LCA) evaluates the global warming potential (GWP) under different environmental assumptions. Under the carbon-neutral assumption for lauric acid production, an 8.9% reduction in GWP was achieved compared to petroleum-based lubricants.
Introduction
Lubricants are an indispensable part of the contemporary economy.1 By 2025, the lubricants market is projected to be worth $166.25 billion, a notable increase from the $47 billion recorded in 2016.2 This growth and valuation stems from increased global demand in the aviation, industrial, and automotive sectors. Base oils occupy between 75–90% of a lubricant's formulation.1 The API (American Petroleum Institute) classifies mineral oils into five categories (groups I–V). Groups I–III are obtained from the refining, distillation, or hydro-processing of petroleum. Group IV oils are obtained from chemical upgrading of petroleum-derived olefins, e.g., oligomerization of 1-decene to poly alpha olefins (PAO).Group IV oils are of the highest quality.3 Their synthesis utilizes corrosive catalysts (AlCl3, BF3, and HF), resulting in toxic waste streams and higher separation costs.3,4 This produces oils with a wide range of carbon chain numbers. Low-molecular-weight, high-volatility hydrocarbons cause oil thickening, necessitating constant replacement.3 The limitations of production and longevity motivate further development of base oils with minimal environmental impact.5
Synthesizing base oils from bio-based feedstocks can mitigate these challenges.5–8 Balakrishnan et al. introduced a two-step process by condensing biomass-derived ketones and hydrodeoxygenating to synthesize new base oils.9 Alternatively, hydroxy alkylation/alkylation (HAA) followed by hydrodeoxygenation can successfully synthesize base oils from furfural, 5-hydroxy methyl furfural, alkyl furans, and levulinic acid.10–13 These synthesis strategies are promising due to the abundance of oxygenates in biomass resources, the low pour point, and their suitable molecular weights (C20+) with flexible molecular architecture and narrow molecular weight14 that limit the need for frequent replacement. The bio-oils exhibit competitive or superior properties to the industrial PAO group IV base oils. However, the alkyl furans and long-chain aldehydes drive the minimum selling price 15% higher than the commercial PAO.
Norton et al. synthesized base oils from 12-tricosanone and furfural, as shown in Scheme 1,15 a detailed version is given in Scheme S1.† Huang et al. have recently used similar chemistry to couple HMF, furfural and phenolics, leading to C18 fuel additives.16 In Norton et al.'s work,15 Furfural and 12-tricosanone undergo aldol condensation to form C33 furan intermediates, which are then hydrodeoxygenated to branched C33 alkanes. The economics of this pathway has not been assessed. Furfural is commercially produced from hemicellulose, but a large-scale biobased route of long-chain ketones, such as 12-tricosanone, does not exist. Currently, these ketones are produced through solvent dewaxing in petroleum refineries.17 Solvent dewaxing produces a mix of ketones, limiting their applicability for base oil synthesis, and is capital-intensive, generating a large amount of waste.18,19 Considering the annual global consumption of approximately 42 million tons of lubricants and the substantial demand for 12-tricosanone, an alternate synthesis route for 12-tricosanone is imperative.
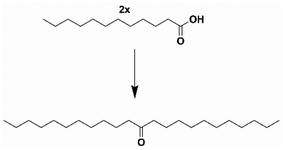
One sustainable production pathway to ketones is the self-ketonization of long-chain fatty acids derived from coconut and palm kernel oils. Ketonization is an established irreversible C–C coupling reaction.20 It has been demonstrated for various substrates21 using heterogeneous, environmentally friendly catalysts22,23 making different products, including jet fuels, precursors for branched-chain lubricants, and bio-waxes.24–28 Most studies on ketonization reactions often utilize a high boiling point solvent, significantly increasing separation costs and emissions from distillation. Furthermore, ketonization is also conducted in batch systems unsuitable for scale-up.19,29–31 Long-chain fatty acids’ viscous nature and high melting points make solventless flow reactors troublesome. Due to these factors, the scaled-up production of 12-tricosanone through lauric acid self-ketonization, shown in Scheme 2, is still nascent. Corma et al. attempted a continuous flow setup, but high yields of the self-ketone were only obtained in a trickle flow of lauric acid (0.05 g min−1) at a low weighted hourly space velocity (WHSV) of 0.025 min−1.32 Consequently, scaling up 12-tricosanone via self-ketonization of lauric acid in a flow system could advance this technology.16
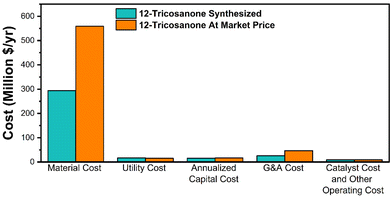
Here, the feasibility of kilogram-scale production of 12-tricosanone from lauric acid over a commercial MgO catalyst is demonstrated. Most notably, reactions were conducted without a solvent, addressing a significant bottleneck in commercializing this chemistry. Reaction conditions were optimized in a batch system before shifting to a centimeter-scale flow reactor and then to a larger tube reactor capable of kilogram-scale production. The impact of process intensification on the minimum selling price (MSP) and global warming potential (GWP) of lubricant base oils was also assessed. The acquisition of commercially available 12-tricosanone increases the MSP of bio-base oils by 81%. However, the synthetic route presented in this work makes these oils 29% cheaper than the average commercial base oil. Life cycle analysis (LCA) also shows that under the carbon-neutral assumption for lauric acid production, the biobased route could lower CO2 emissions by 8.9% than the petroleum-derived alternative.
Experimental methods
Batch reactor
All batch ketonization reactions were conducted in a 100 ml high-pressure Parr reactor. Appropriate amounts of lauric acid and metal oxide catalyst were placed in a glass liner with a magnetic stir bar. The reactor was then purged three times with N2, pressurized with N2, and heated to reaction temperature. After a specified reaction time, it was quenched in an ice bath. Experiments were conducted in duplicate, with deviations below 5%.Product analysis
For batch and flow reactions, the products and remaining reactants were dissolved in chloroform, and the compounds were identified using a gas chromatogram mass spectrometer (GCMS) equipped with a DB-5 column and quantified with a gas chromatogram with a flame ionization detector (GC-FID) fitted with an HP-1 column, calibration curves were prepared for lauric acid (Fig. S1†) and 12-tricosanone (Fig. S2†). For the HP-1 column, an initial oven temperature of 40 °C was held for 5 min. In the next step, the temperature was ramped at 15 °C min−1 until it reached 300 °C and held at 300 °C for 5 min. For the GCMS system, an initial oven temperature of 40 °C was maintained for 4 min. The temperature was then ramped at 20 °C min−1 until it reached 300 °C and held at 300 °C for 5 min. 1H and 13C NMR spectroscopy (Bruker AV400, CDCl3 solvent) was also used to verify 12-tricosanone.Centimeter-scale flow reactor
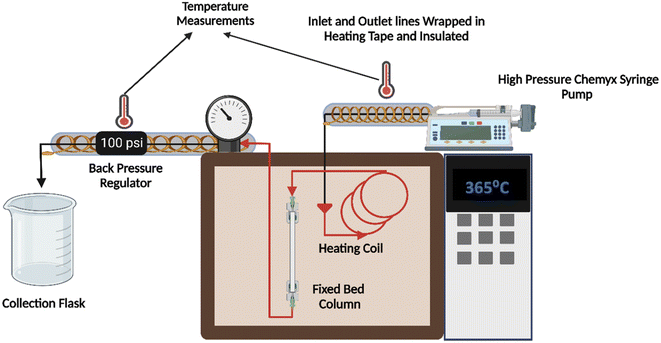
A high-pressure syringe pump (Chemyx fusion 6000) with a high linear force rating (700 lb) was used to flow lauric acid through the system illustrated in Fig. 1. The reactor was constructed using a 12 cm long SS (stainless steel) tube with an ID of 5 mm. All the connections and fluid lines were made of 316 SS material. A back pressure regulator (Equilibar) in the effluent line prevented the vaporization of lauric acid at higher reaction temperatures. The temperature in the inlet and outlet lines was maintained using heating tape wrapped in insulation and aluminum foil connected to variable autotransformers.The flow reactor was packed with about 1 g of pelletized commercial MgO catalyst, as shown in Fig. S3.† Catalyst particles were pelletized using ½ inch I.D. hydraulic press die at a force of 2.5 metric tons for 2 min and sieved uniformly (125–180 μm). We packed the column with 100 mg quartz wool and 0.5 g glass beads to hold the catalyst in place and maintain a steady flow. Experiments were conducted in duplicate, with deviations less than 5% between them.
Scale-up flow reactor
The same syringe pump, heating and insulation method, and back pressure regulator were used for the kilogram-scale reactor. All connections and tubing were constructed of 316 SS. The reactor tube was 30 cm long and 1.25 cm in ID. The column was encased in a heating mantle and calibrated at the desired reaction temperature.The reactor column was packed with 10 g of pelletized (125–250 μm) commercial MgO catalyst. Trial runs with an inert solvent (chloroform) resulted in a high-pressure drop along the bed (400 psi), and the syringe pump stalled repeatedly. The higher-pressure drop was expected due to the increased length of the bed. Based on Ergun's equation, the catalyst particle size was increased to 425–500 μm. The bed was re-constructed using the catalyst and silica beads in a 1![[thin space (1/6-em)]](https://www.rsc.org/images/entities/char_2009.gif) :
:![[thin space (1/6-em)]](https://www.rsc.org/images/entities/char_2009.gif) 1 ratio to mitigate the pressure drop (Fig. S4a†). The column was packed with 1 g quartz wool and 5 g glass beads to keep a steady flow. Lauric acid was heated to 150–200 °C to maintain flow.
1 ratio to mitigate the pressure drop (Fig. S4a†). The column was packed with 1 g quartz wool and 5 g glass beads to keep a steady flow. Lauric acid was heated to 150–200 °C to maintain flow.
Due to the heated tubular reactor, a vertical temperature gradient along the column is expected. To obtain a steady temperature gradient, the reactor was heated for 3 h, and then the temperature at different points along the vertical column was measured using a thermocouple inserted at the top using a bore-through fitting. As shown in Fig. S5,† a 6–7 cm isothermal region was identified close to the center of the reactor, with the temperature decreasing at each side away from the central zone. The catalyst bed was placed in the isothermal region during regular reactor operation.
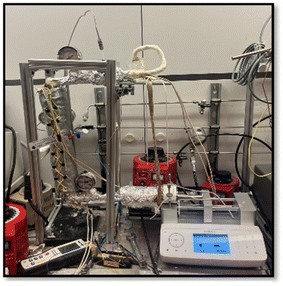
The system was calibrated for lauric acid flow rate using the configuration depicted in Fig. 2. Heating tape and multilayered insulation were used to maintain a 150–200 °C temperature in the outlet lines. Pressure gauges were installed at the inlet and outlet to measure the pressure drop across the reactor. The reactor was packed with quartz wool for flowrate measurements, and inert silica beads were used to simulate the catalyst particles, as shown in Fig. S6a.† The flow rate calibrations are given in Fig. S6b;† this data demonstrates the system is leak-free.
Preparation of doped metal oxide catalysts by co-precipitation
Doped metal oxide catalysts Mg3Al1O4.5 and Ce0.1Mg3Al0.9O4.5 were prepared using co-precipitation.33 The corresponding hydrated salts of each mixed metal oxide were first dissolved in DI (de-ionized) water. A basic solution of 1M NaOH was also prepared to precipitate out the metals. Both solutions were added dropwise to another beaker containing 100 ml of DI water. The amount of NaOH solution was adjusted to keep the pH between 8 and 9. The colloidal solution was placed in an oil bath and heated at 80 to 90 °C for 8 h. The precipitate was then dried in an oven overnight in air. The resulting powder was calcinated in air at 600 °C for 3 h to burn off any impurities.Preparation of mixed metal oxide catalysts by impregnation
MgO/SiO2, MgO/Al2O3, and MgO/ZrO2 were prepared through wet impregnation using Mg (NO3)2·6H2O dissolved in DI water as the metal precursor. The loading of MgO was 10 wt%. The salt solution was added dropwise onto the selected support over a hot plate. After impregnation, all catalysts were dried in an oven overnight to remove the excess water and calcined at 600 °C for 3 h in air.Catalyst characterization
X-ray diffraction spectra (XRD) were obtained using an X-ray diffractometer (Bruker D8) with Cu Kα radiation (λ = 1.54056 Å) at 40 kV and 40 mA. The surface areas reported were measured using N2 physisorption at 77 K using a Micromeritics ASAP 2020 Brunauer–Emmett–Teller (BET) Analyzer. Thermogravimetric analysis (TGA) was performed with a TA Q600 TGA/DSC instrument with a ramp rate of 20 °C min−1 in air in a temperature range of 20 to 800 °C. Fourier transform infrared (FTIR) data was collected with a Thermo Fisher FTIR/ATR by scanning the sample from 400 to 4000 nm. X-ray fluorescence (XRF) of the post-reaction solutions was collected and analyzed using a Rigaku Supermini 200 WDXRF machine to detect the presence of Mg2+ ions.For spent catalyst characterization at the batch scale, the reaction solution was decanted into 50 ml polypropylene tubes and centrifuged for 10 min at 10![[thin space (1/6-em)]](https://www.rsc.org/images/entities/char_2009.gif) 000 rpm. The solid residue was collected and washed several times with chloroform due to its high volatility and ability to solubilize organic material. The recovered catalyst was then dried in an oven at 100 °C overnight. The catalyst was then analyzed through XRD, FTIR, and TGA.
000 rpm. The solid residue was collected and washed several times with chloroform due to its high volatility and ability to solubilize organic material. The recovered catalyst was then dried in an oven at 100 °C overnight. The catalyst was then analyzed through XRD, FTIR, and TGA.
Aspen Plus process simulation
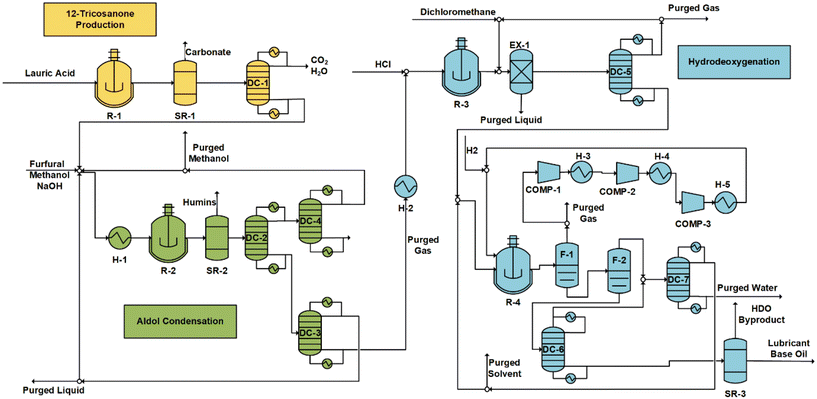
The process was simulated using experimental results from this study and literature data15 using Aspen Plus V12.0.34 The liquid–liquid and vapor–vapor interactions were predicted using the nonrandom two-liquid (NRTL) method. Data for most compounds was available in the Aspen database. Chemicals unavailable in the database were defined using their molecular structure and boiling points.35 The missing parameters were estimated using the Aspen Plus Property Constant Estimation System (PCES) or NIST Thermo Data Engine (TDE).36,37 The TDE software predicts thermodynamic and transport properties based on dynamic data evaluation. The Rstoich reactor model was used. The rest of the lubricant base oil production was based on a previous study. The reaction conditions are shown in Table 1.| Reaction | 12-Tricosanone production | Aldol condensation | Hydrodeoxygenation |
|---|---|---|---|
| T (°C) | 365 | 80 | 180 |
| P (bar) | 1 | 1 | 50 |
| Catalyst | MgO | [OH−] | Ir-ReOx/SiO2 |
| Yield (%) | 93 | 94 | 61 |
Technoeconomic analysis (TEA)
The capital and operating costs were estimated using the Aspen Process Economic Analyzer (APEA) V12.0. Heat integration was considered to reduce energy, utilizing the Aspen Energy Analyzer V12.0. The economic evaluation was conducted based on the discounted cash flow analysis.38 The number of years for analysis was 20, and the payout time was 10 years. The MSP for lubricants was determined such that the net present value (NPV) is zero at payout time. The cost of catalyst recovery was not considered. The economics was compared with the HAA reaction pathway.Life-cycle assessment (LCA)
The Ecoinvent 3.9.1 database39 was used for LCA. The system boundary was defined using “cradle-to-gate” criteria, which accounts for biomass growth, raw material extraction, upstream utility generation, and the lubricant production process. The boundaries for LCA analysis are illustrated in Fig. S7.† The Tool for the Reduction and Assessment of Chemical and other Environmental Impact (TRACI)40 was used for environmental impact assessment. The GWP was chosen as the environmental metric. Mass allocation was used to share the burden of production. For biomass-based production of furfural and lauric acid, carbon is absorbed during plant growth.35,41 Biomass-based furfural is mainly produced from corn cob, and its carbon sequestration effect is estimated based on previous literature.35 Palm oil was the primary source of lauric acid production.39–41 The carbon sequestration of lauric acid production from palm oil depends on the land use change (LUC) by converting natural forests or other land types to plantations.42 The effect of LUC depends on planning, governance, and agricultural management.43 For example, a carbon neutral assumption was invoked for the plantation sequestration, emitting 1.7 kg CO2e per kg lauric acid.42 A strong net carbon sequestration effect was found for oil palm plantations compared to forest.39 In this work, we use a carbon-neutral assumption for the base case to reflect the superior carbon sequestration ability of oil plantations. We also considered a carbon-neutral assumption at the plantation stage with 1.7 kg CO2e per kg lauric acid,42 a relatively conservative scenario. More details are in the ESI.†Results and discussion
Lauric acid self-ketonization in a batch reactor
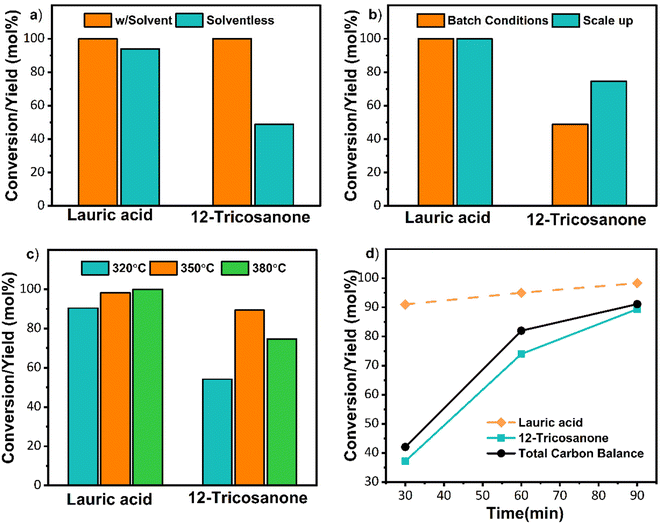
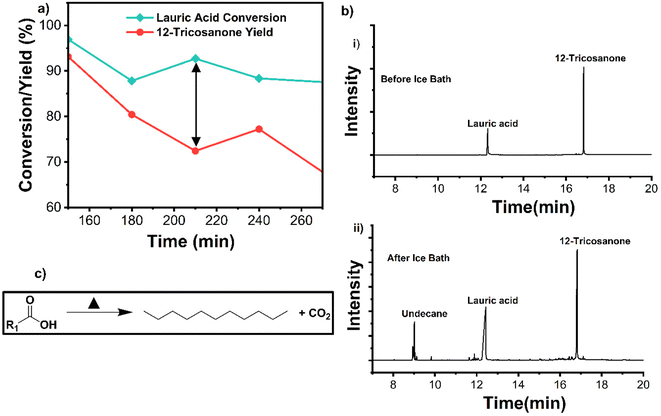
Initial solventless reactions were performed at the optimized conditions determined in previous work44 with n-dodecane as a solvent (Fig. S8†). As depicted in Fig. 3a, the solventless reaction resulted in a lower 12-tricosanone yield (∼49%). GCMS data (Fig. S9†) showed that 12-tricosanone undergoes thermal cracking at this elevated temperature to lauraldehyde and undecane, resulting in lower output. Thermal cracking of C22–C28 ketones to shorter chain alkanes and alkenes has been reported.29 The catalytic decarboxylation of carboxylic acids has been observed over metal oxides above 300 °C, and therefore, undecane could also form via decarboxylation of the lauric acid.43,44 We also suspected that mixing could be an issue due to the lack of solvent. The batch system was then scaled up from 2 g to 11.1 g to fill the space in the reactor and improve mixing. This scale-up improved the product yield to 72% and decreased product decomposition (Fig. 3b and Fig. S10†). Since the conversion was already 100%, the reaction temperature was reduced to 320 °C to minimize 12-tricosanone's thermal cracking. However, the yield of 12-tricosanone dropped to 53% despite a conversion of 90%. Thermal cracking was not observed. The low carbon balance was attributed to complexes forming with MgO. Specifically, due to the strong basicity of MgO, bulk acetate reaction intermediates form on the catalyst in self-ketonization reactions with carboxylic acids, lowering the yield compared to conversion, as detailed in previous work.24,45 Notably, complexes at lower temperatures form more rapidly than ketonization. These complexes decompose to ketones at higher temperatures or longer reaction times. Therefore, to minimize thermal cracking and thermally decompose the complexes, the reaction temperature was increased to 350 °C. At this temperature, a ∼90% 12-tricosanone yield was achieved (Fig. 3c and Fig. S10†). To minimize thermal cracking, the reaction time was reduced (Fig. 3d). A shorter reaction time still resulted in complete lauric acid conversion and a 12-tricosanone yield of 36% at 30 min, resulting in a 55% carbon loss due to complexation. These batch reactions indicate that a reaction time of 90 min at 350 °C is optimal for high yields of 12-tricosanone in solventless conditions. Due to the varying temperature during the preheating in a batch reactor, more detailed reaction time–temperature optimization was not pursued. Instead, the temperature-reaction time was optimized in continuous flows to ensure complete conversion, limit thermal cracking, and minimize the formation of complexes.Centimeter-scale continuous flow reactor performance
After demonstrating solventless batch reactions, we advanced to the centimeter-scale flow reactor. The lauric acid flow rate was calibrated in the setup shown in Fig. 1. The initial flow reactions were conducted at 350 °C, with a lauric acid the WHSV from 0.1 to 0.3 min−1. Optimization was performed to ensure complete conversion of lauric acid and increase the system's productivity (in grams of product per min). The highest yield of 82% was obtained for longer residence times at WHSV of 0.1 min−1, as shown in Table 2. The lauric acid conversion and 12-tricosanone yield were 12% higher than the literature values at comparative WHSVs.30| Case/ref. | Lauric acid flowrate (g min−1) | W/F (min) | WHSV (min−1) | Lauric acid conversion (mol%) | Product yield (mol%) |
|---|---|---|---|---|---|
| 130 | 0.12 | 17.0 | 0.06 | 78 | 70 |
| 2 (this work) | 0.1 | 10.0 | 0.10 | 93 | 83 |
| 3 (this work) | 0.2 | 5.0 | 0.20 | 80 | 66 |
| 4 (this work) | 0.3 | 3.3 | 0.30 | 72 | 64 |
The solventless batch system optimization studies and recent work on cross-ketonization of 2-furoic acid with lauric acid showed that thermal decomposition of the metal-carboxylic acid complex is crucial in ketonization.44 Increasing the reaction temperature favors the metal-complex decomposition if thermal decomposition is prevented. Therefore, the reaction temperature was increased from 350 to 365 °C, and the 12-tricosanone yield increased from 82% to 93% (Table 3). Similar increases in yield were observed at different WHSV values. The batch reactor optimization showed thermal cracking of 12-tricosanone at 380 °C; thus, a further increase in temperature was not attempted. The temperature and WHSV optimization indicated that 365 °C and longer residence times give higher 12-tricosanone yields. These optimized conditions were also carried forward to the kilogram scale flow reactor.
| Case | Lauric acid flowrate (g min−1) | W/F (min) | WHSV (min−1) | Lauric acid conversion (mol%) | Product yield (mol%) |
|---|---|---|---|---|---|
| 1 | 0.1 | 10.0 | 0.10 | 99 | 93 |
| 2 | 0.2 | 5 | 0.20 | 96 | 89 |
| 3 | 0.3 | 3.33 | 0.30 | 92 | 81 |
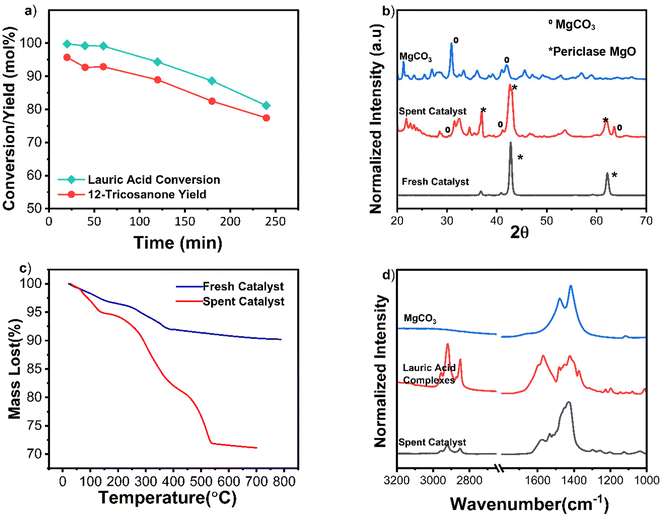
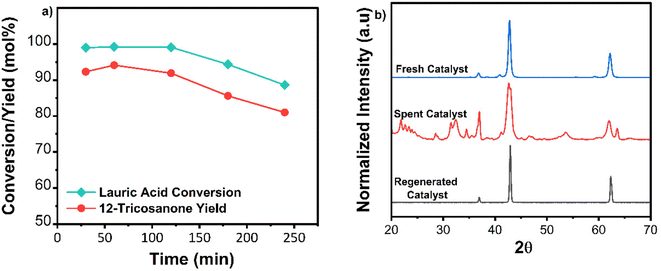
TGA analysis of the spent catalyst showed light coke formation as most weight loss occurred below 500 °C (Fig. 4c). FTIR spectra of the spent catalyst were compared to pure magnesium carbonate and magnesium-lauric acid complexes. The broad carbonyl (C![[double bond, length as m-dash]](https://www.rsc.org/images/entities/char_e001.gif) O) peak of MgCO3 was at a wavelength of approximately 1475 cm−1 in the spent material. Smaller C–H alkane peaks at approximately 2900 cm−1 and Mg-COO carboxylate peaks at around 1650 cm−1 were also observed (Fig. 4d). These alkane and carboxylate peaks indicate lauric acid complexes with MgO and carbonate deposits. The catalyst was successfully regenerated by calcination in air at 600 °C for 2 h. TOS studies were repeated with the regenerated material (Fig. 5a). XRD analysis of the regenerated catalyst showed no carbonate deposits (Fig. 5b), and the activity was comparable to that of the fresh catalyst. To summarize, no catalyst leaching was observed during TOS studies. However, the catalyst underwent slight deactivation due to carbonate formation. This deactivation was reversed through calcination, and the regenerated material displayed the same activity as the fresh catalyst.
O) peak of MgCO3 was at a wavelength of approximately 1475 cm−1 in the spent material. Smaller C–H alkane peaks at approximately 2900 cm−1 and Mg-COO carboxylate peaks at around 1650 cm−1 were also observed (Fig. 4d). These alkane and carboxylate peaks indicate lauric acid complexes with MgO and carbonate deposits. The catalyst was successfully regenerated by calcination in air at 600 °C for 2 h. TOS studies were repeated with the regenerated material (Fig. 5a). XRD analysis of the regenerated catalyst showed no carbonate deposits (Fig. 5b), and the activity was comparable to that of the fresh catalyst. To summarize, no catalyst leaching was observed during TOS studies. However, the catalyst underwent slight deactivation due to carbonate formation. This deactivation was reversed through calcination, and the regenerated material displayed the same activity as the fresh catalyst.
Another stabilization strategy could involve Mg–Al hydrotalcites synthesized through co-precipitation. These hydrotalcites can also be improved by doping with ceria.33 The hydrotalcite catalysts were not as active as pure MgO and deactivated at a similar rate. As depicted in Fig. S12a and b,† Mg3Al1O4.5, and Mg3Al0.8Ce0.2O4.5 initially showed 74 and 71% 12-tricosanone yield at 30 min but 48 and 52% at 240 min, respectively. These results indicate that embedding MgO in the hydrotalcite structure does not improve stability. The higher BET surface area of the mixed oxides (Table S2†) and lower activity than pure MgO indicate that internal mass transfer of lauric acid to the magnesium oxide sites in the hydrotalcites is possibly not limiting the reaction at this temperature regime. Aluminum and cerium oxides are less effective for ketonization than MgO, and the lower activity of the mixed oxides could be attributed to lower MgO loadings than the pure oxide. With the same Mg loading of 1.1 g in batch, the 12-tricosanone yield was indeed comparable: 90% over pure MgO, 87% over Mg3Al1O4.5, and 93% over Mg3Al0.8Ce0.2O4.5 (Fig. S13†). Pure MgO demonstrated the best performance and stability and was selected for further scale-up.
After the experiments, we recovered the spent catalysts and analyzed them using XRD, while the post-reaction solution was analyzed using XRF. All four catalysts appeared noticeably greyer, suggesting the presence of carbonate deposits. The XRD scans of the fresh and spent Mg/Al2O3 are shown in Fig. S15a and b.† The periclase MgO peaks at 42° and 63° were replaced with the trihydrate magnesium carbonate at 16°. The phase change was less prominent for Mg/ZrO2, although there was a slight loss of crystallinity indicated by the broadening of the mixed Mg–Zr phase at 34°. Carbonate formation was most noticeable on the hydrotalcite catalysts. Both oxides exhibited peaks of syn magnesite and magnesium carbonate hydroxide. While pure MgO transformed into magnesite as shown in Fig. 4, the peaks of magnesium carbonate hydroxide were unique to the hydrotalcite.
Interestingly, XRF scans of the post-reaction solution revealed no Mg2+ ions, suggesting that carbonate deposits were the leading cause of deactivation. Notably, the carbon balance was over 90% for all four experiments, indicating minimal complexation. According to the published complexation mechanism, the carboxylic acid would have to remove Mg from the lattice structure for complexation to occur. Likely, anchoring MgO onto ZrO2, Al2O3, or embedding it in the hydrotalcite structure prevents this. Khromova et al. demonstrated this through the preparation of Mg–Al and Mg–Zr admixtures. Pure MgO was found to deactivate due to the formation of carboxylate salts, while the admixtures showed more MgCO3 formation.
Taking the data together, it is evident that different degrees and types of carbonate form, and carbonate formation is a key deactivation pathway.
Scaled-up flow reactor performance
Systems analysis
![[thin space (1/6-em)]](https://www.rsc.org/images/entities/char_2009.gif) 000 ton per year.14 A 35% tax rate is imposed.
000 ton per year.14 A 35% tax rate is imposed.
In the base scenario, the process consumes 170![[thin space (1/6-em)]](https://www.rsc.org/images/entities/char_2009.gif) 167 ton per year of lauric acid and 66
167 ton per year of lauric acid and 66![[thin space (1/6-em)]](https://www.rsc.org/images/entities/char_2009.gif) 000 ton per year of furfural and produces 109
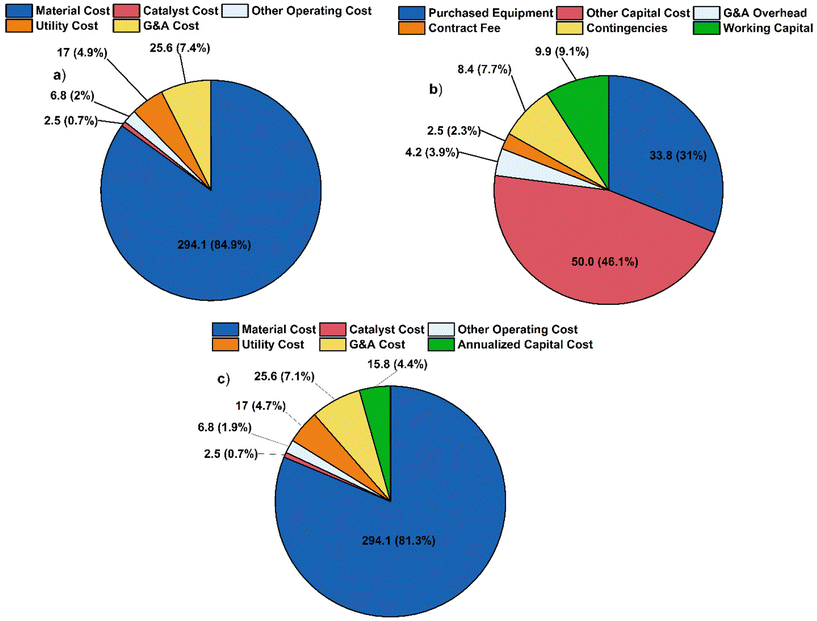
000 ton per year of furfural and produces 109![[thin space (1/6-em)]](https://www.rsc.org/images/entities/char_2009.gif) 471 metric ton per year of lubricant base oil. The cost breakdown (Fig. 9) is compared to the alternate scenario (Fig. 10). The total annualized costs and the breakdown for the alternative scenario are shown in Fig. S19 and Tables S3, S4.† In both cases, material costs dominate the total cost breakdown.
471 metric ton per year of lubricant base oil. The cost breakdown (Fig. 9) is compared to the alternate scenario (Fig. 10). The total annualized costs and the breakdown for the alternative scenario are shown in Fig. S19 and Tables S3, S4.† In both cases, material costs dominate the total cost breakdown.
The MSP is calculated to be $3184 per ton for the base case scenario and $5775 per ton for the alternative scenario. The difference is primarily due to the raw material cost, as shown in Fig. S10.† This study shows a lower MSP by 30% and 29% compared to the previous study and the commercial synthetic PAO4 price of $4475 per ton.14
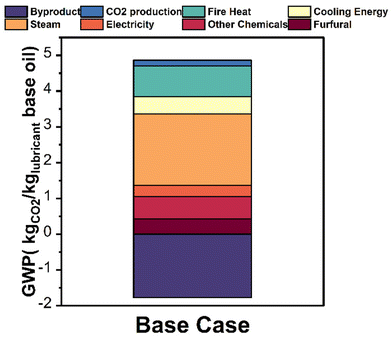
In scenario 1, the GWP was 3.09 kg CO2e per kg lubricant base oil, 8.9% lower than petroleum-derived process (3.39 CO2e per kg lubricant base oil). In scenario 2, the GWP was 4.77 kg CO2e per kg lubricant base oil, 40.7% greater than the petroleum-based process. This assumption is more conservative as Yee et al.41 showed that palm oil exhibits a better carbon assimilation capability than the rainforest, on which the plantation is usually built. In scenario 3, the GWP was −64.1 kg CO2e per kg lubricant base oil, indicating a net carbon absorption and a lower bound. Due to the complexity of capturing the effect of LUC, further quantitative studies in agricultural science are needed to investigate the effect of LUC on upstream carbon sequestration. The process breakdown for scenario 1 (Fig. 11 and Table S5†) shows that steam contributes 1.99 kg CO2e (41.1%), heat 0.86 kg CO2e (17.8%), cooling 0.48 kg CO2 eq. (9.9%), and the byproduct 1.77 kg CO2e (36.4%).
Conclusions
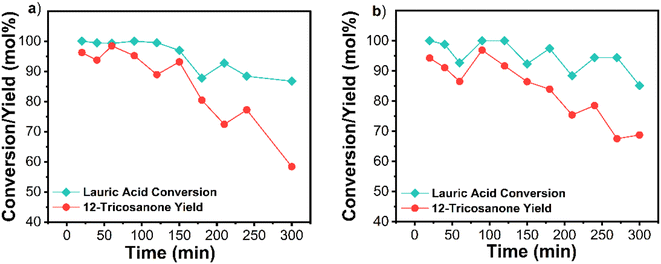
This work demonstrates the successful scale-up of the solventless self-ketonization of lauric acid to 12-tricosanone, a lubricant precursor. The batch experiments showcased a tradeoff of temperature and time; high temperatures lead to the removal of carbonate complexes but also to product thermal cracking. Optimization in a batch system resulted in a 90% yield at 350 °C in 90 min. Flow scale experiments allowed fine control of the residence time and temperature by bypassing the uncontrolled preheating of batch systems. A centimeter-scale flow reactor facilitated solventless operation, achieving 93% of 12-tricosanone yield at 365 °C and a 0.1 g min−1 flow rate. Catalyst deactivation reduced the yield from 93% to 77% after 2 h TOS. The catalyst could be fully regenerated through calcination. The process was then scaled up from 0.1 g min−1 to 1 g min−1 through reactor and catalyst modifications while keeping the reaction temperature and WHSV the same. The reported processing rate is 20 times higher than literature at comparable productivity. TEA revealed a MSP 29% lower than the commercial synthetic PAO. LCA showed that under the carbon neutral assumption for lauric acid production, lubricants have 8.9% lower GWP than petroleum-derived lubricants.Author contributions
T. G., S. S., D. G. V., M. I., B. S. conceived the idea and designed the experiments. T. G. performed all the experiments, W. Z. assisted with flow reactor construction, and Z. Y. performed the process simulation, TEA, and LCA. T. G., Z. Y., S. S., D. G. V., and M. I. co-wrote the manuscript. All authors commented on the manuscript.Data availability
All data needed to evaluate the conclusions in the paper are in the paper and/or the ESI.† Additional data regarding this paper may be requested from the authors.Conflicts of interest
The authors declare no conflicts.Acknowledgements
This work was supported as part of the Delaware Biosciences Center for Advanced Technology grant with award number 12A00448 and a Small Business Innovation Research grant from the Department of Energy, award number DE-SC0021559.References
- L. R. Rudnick, Synthetics, Mineral Oils, and Bio-Based Lubricants, CRC Press, 2020 Search PubMed.
- Lubricants Market Size, Share & Trends Analysis Report, 2030, https://www.grandviewresearch.com/industry-analysis/lubricants-market, (accessed 15 May 2023).
- R. Shah, M. Woydt and S. Zhang, Lubricants, 2021, 9, 1–11 Search PubMed.
- P. M. Lugt, Tribol. Int., 2016, 97, 467–477 CrossRef CAS.
- N. A. Zainal, N. W. M. Zulkifli, M. Gulzar and H. H. Masjuki, Renewable Sustainable Energy Rev., 2018, 82, 80–102 CrossRef CAS.
- G. Karmakar, P. Ghosh and B. K. Sharma, Lubricants, 2017, 5, 1–17 CrossRef.
- M. A. Hossain, M. A. Mohamed Iqbal, N. M. Julkapli, P. San Kong, J. J. Ching and H. V. Lee, RSC Adv., 2018, 8, 5559–5577 RSC.
- J. Haßelberg and A. Behr, Eur. J. Lipid Sci. Technol., 2016, 118, 36–46 CrossRef.
- M. Balakrishnan, G. E. Arab, O. B. Kunbargi, A. A. Gokhale, A. M. Grippo, F. D. Toste and A. T. Bell, Green Chem., 2016, 18, 3577–3581 RSC.
- S. Chen and C. Zhao, ACS Sustainable Chem. Eng., 2021, 9, 10818–10826 CrossRef CAS.
- M. Kabbour and R. Luque, Furfural as a platform chemical: From production to applications, Elsevier B.V., 2019 Search PubMed.
- F. Deng and A. S. Amarasekara, Ind. Crops Prod., 2021, 159, 113055 CrossRef CAS.
- S. Liu, R. Bhattacharjee, S. Li, A. Danielson, T. Mazal, B. Saha and D. G. Vlachos, Green Chem., 2020, 22, 7896–7906 RSC.
- S. Liu, T. R. Josephson, A. Athaley, Q. P. Chen, A. Norton, M. Ierapetritou, J. I. Siepmann, B. Saha and D. G. Vlachos, Sci. Adv., 2019, 5, 1–8 Search PubMed.
- A. M. Norton, S. Liu, B. Saha and D. G. Vlachos, ChemSusChem, 2019, 12, 4780–4785 CrossRef CAS.
- S. Huang, X. Luo, J. Li, S. Liu and L. Shuai, Green Chem., 2024, 26, 4043–4050 RSC.
- C. D. Neveu, R. Sondjaja, T. Stöhr and N. J. Iroff, Polym. Sci. a Compr. Ref., 2012, vol. 1–10, pp. 453–478 Search PubMed.
- A. M. As’ad, A. M. Yeneneh and E. O. Obanijesu, J. Pet. Environ. Biotechnol., 2015, 6(2), 1–9 Search PubMed.
- B. Boekaerts, M. Vandeputte, K. Navaré, J. Van Aelst, K. Van Acker, J. Cocquyt, C. Van Caneyt, P. Van Puyvelde and B. F. Sels, Green Chem., 2021, 23, 7137–7161 RSC.
- B. Boekaerts and B. F. Sels, Appl. Catal., B, 2021, 283, 119607 CrossRef CAS.
- J. De Maron, D. Cesari, S. Banu Rameesdeen, T. Tabanelli, A. Fasolini, F. Basile and F. Cavani, Green Chem., 2023, 25, 7381–7392 RSC.
- M. Cohen, T. Goculdas and D. G. Vlachos, React. Chem. Eng., 2023, 8, 824–837 RSC.
- S. Zhang, B. Jiang, M. Tong, Y. Yang, Z. Liao, Z. Huang, J. Sun, J. Wang and Y. Yang, Ind. Eng. Chem. Res., 2023, 62, 20667–20676 CrossRef CAS.
- H. Nguyen, Y. Wang, D. Moglia, J. Fu, W. Zheng, M. Orazov and D. G. Vlachos, Catal. Sci. Technol., 2021, 11, 2762–2769 RSC.
- J. H. Miller, G. R. Hafenstine, H. H. Nguyen and D. R. Vardon, Ind. Eng. Chem. Res., 2022, 61, 2997–3010 CrossRef CAS.
- T. N. Pham, T. Sooknoi, S. P. Crossley and D. E. Resasco, ACS Catal., 2013, 3, 2456–2473 CrossRef CAS.
- E. I. Gürbüz, E. L. Kunkes and J. A. Dumesic, Green Chem., 2010, 12, 223–227 RSC.
- Y. Lee, J. W. Choi, D. J. Suh, J. M. Ha and C. H. Lee, Appl. Catal., A, 2015, 506, 288–293 CrossRef CAS.
- L. J. Gooßen, P. Mamone and C. Oppel, Adv. Synth. Catal., 2011, 353, 57–63 CrossRef.
- R. Kumar, N. Enjamuri, S. Shah, A. S. Al-Fatesh, J. J. Bravo-Suárez and B. Chowdhury, Catal. Today, 2018, 302, 16–49 CrossRef CAS.
- K. Lee, Y. Kim and M. Choi, ACS Sustainable Chem. Eng., 2018, 6, 13035–13044 CrossRef CAS.
- A. Corma, M. Renz and C. Schaverien, ChemSusChem, 2008, 1, 739–741 CrossRef CAS.
- B. Jiang, Z. Xi, F. Lu, Z. Huang, Y. Yang, J. Sun, Z. Liao, J. Wang and Y. Yang, Catal. Sci. Technol., 2019, 9, 6335–6344 RSC.
- Aspen Plus V12.
- Y. Luo, M. J. Kuo, M. Ye, R. Lobo and M. Ierapetritou, Ind. Eng. Chem. Res., 2022, 61, 8963–8972 CrossRef CAS.
- NIST Standard Reference Database 103b | NIST, https://www.nist.gov/mml/acmd/trc/thermodata-engine/srd-nist-tde-103b, (accessed 8 December 2023).
- NIST Standard Reference Database 103a | NIST, https://www.nist.gov/mml/acmd/trc/thermodata-engine/srd-nist-tde-103a, (accessed 8 December 2023).
- L. T. Biegler, I. E. Grossmann and A. W. Westerberg, Systematic Methods of Chemical Process Design, Prentice Hall PTR, New Jersey, 1999 Search PubMed.
- R. Frischknecht, in Information Systems for Sustainable Development, 2005, pp. 26–33 Search PubMed.
- J. Bare, Clean Technol. Environ. Policy, 2011, 13, 687–696 CrossRef CAS.
- K. F. Yee, K. T. Tan, A. Z. Abdullah and K. T. Lee, Appl. Energy, 2009, 86, S189–S196 CrossRef.
- H. L. Ngo, A. Nunez, W. Lin and T. A. Foglia, Eur. J. Lipid Sci. Technol., 2007, 109, 214–224 CrossRef.
- F. Deng, J. Huang, E. E. Ember, K. Achterhold, M. Dierolf, A. Jentys, Y. Liu, F. Pfeiffer and J. A. Lercher, ACS Catal., 2021, 11, 14625–14634 CrossRef.
- B. Boekaerts and B. F. Sels, ACS Sustainable Chem. Eng., 2022, 10, 11466–11472 CrossRef.
- T. Goculdas, S. Deshpande, W. Zheng, R. J. Gorte, S. Sadula and D. G. Vlachos, Green Chem., 2023, 25, 614–626 RSC.
- S. A. Khromova, A. A. Smirnov, S. A. Selishcheva, R. G. Kukushkin, V. O. Dundich, L. I. Trusov and V. A. Yakovlev, Catal. Ind., 2013, 5, 260–268 CrossRef.
- R. Huang, J. Chang, H. Choi, J. M. Vohs and R. J. Gorte, Catal. Lett., 2022, 1, 1–10 Search PubMed.
- S. Shylesh, L. A. Bettinson, A. Aljahri, M. Head-Gordon and A. T. Bell, ACS Catal., 2020, 10, 4566–4579 CrossRef CAS.
- A. V. Ignatchenko and A. J. Cohen, Catal. Commun., 2018, 111, 104–107 CrossRef CAS.
- Y. Lee, J. W. Choi, D. J. Suh, J. M. Ha and C. H. Lee, Appl. Catal., A, 2015, 506, 288–293 CrossRef CAS.
- Q. Yu, Y. Guo, X. Wu, Z. Yang, H. Wang, Q. Ge and X. Zhu, ACS Sustainable Chem. Eng., 2021, 9, 7982–7992 CrossRef CAS.
- A. Kuznetsov, G. Kumar, M. A. Ardagh, M. Tsapatsis, Q. Zhang and P. J. Dauenhauer, ACS Sustainable Chem. Eng., 2020, 8, 3273–3282 CrossRef CAS.
- Hot sale soap raw material lauric acid powder cosmetic grade 99% – buy lauric acid, lauric acid price, lauric acid 99 Tka product on Alibaba.com, https://www.alibaba.com/product-detail/Hot-Sale-Soap-Raw-Material-Lauric_1600734662380.html?spm=a2700.galleryofferlist.0.0.67c25191WtrbJD, (accessed 8 December 2023).
- 12-Tricosanone 540-09-0 Purity 95%, 99% dayang clients requirement China, https://www.guidechem.com/trade/12-tricosanone-id3277392.html, (accessed 8 December 2023).
- J. A. Noël, P. M. Allred and M. A. White, Int. J. Life Cycle Assess., 2015, 20, 367–376 CrossRef.
- B. Wicke, R. Sikkema, V. Dornburg and A. Faaij, Land Use Policy, 2011, 28, 193–206 CrossRef.
Footnotes |
| † Electronic supplementary information (ESI) available. See DOI: https://doi.org/10.1039/d4gc01721h |
| ‡ These authors contributed equally. |
| This journal is © The Royal Society of Chemistry 2024 |


