 Open Access Article
Creative Commons Attribution 3.0 Unported Licence
Cross-polymerization between bio-oil and polyaniline: synergistic effects on pore development in subsequent activation and adsorption of phenol†
Baihong
Li
a,
Chao
Li
 a,
Dianqiang
Li
a,
Lijun
Zhang
a,
Shu
Zhang
b,
Yi
Wang
a,
Dianqiang
Li
a,
Lijun
Zhang
a,
Shu
Zhang
b,
Yi
Wang
 c,
Song
Hu
c,
Jun
Xiang
c,
Mortaza
Gholizadeh
d and
Xun
Hu
c,
Song
Hu
c,
Jun
Xiang
c,
Mortaza
Gholizadeh
d and
Xun
Hu
 *a
*a
aSchool of Material Science and Engineering, University of Jinan, Jinan, 250022, P. R. China. E-mail: Xun.Hu@outlook.com
bCollege of Materials Science and Engineering, Nanjing Forestry University, Nanjing, 210037, P. R. China
cState Key Laboratory of Coal Combustion, Huazhong University of Science and Technology, P. R. China
dPyrochar Company, Notting Hill, Victoria 3168, Australia
First published on 7th March 2024
Abstract
Bio-oil is a major product from pyrolysis of biomass which serves as a carbon source to produce carbon material due to its high reactivity towards polymerization itself or cross-polymerization with other organic feedstocks. In this study, activation of polyaniline (PANI) mixed with wheat straw-derived bio-oil and K2C2O4 at 800 °C was conducted, aiming to understand the effect of potential interactions of bio-oil with PANI on pore development of resulting activated carbon (AC). The results revealed cross-polymerization reactions between PANI and bio-oil during direct activation, which increased the yield of AC from 13.0% (calculated average) to 15.0%, the specific surface area from 1677.9 m2 g−1 (calculated average) to 1771.3 m2 g−1, and the percentage of micropores from 94.3% to 97.1%. In addition, pre-polymerization of PANI and bio-oil at 200 °C before activation was also conducted. Such pretreatment could increase the AC yield from 13.0% to 23.3%, but the specific surface area decreased to 1381.8 m2 g−1. The pre-polymerization formed the organics that were more resistant towards cracking/gasification, but introduced oxygen-rich functionalities. This made AC highly hydrophilic, rendering a much higher capability for adsorption of phenol despite the smaller specific surface area. Additionally, the AC with developed pore structures facilitated dispersion of nickel in Ni/AC and enhanced the catalytic activity for hydrogenation of o-chloronitrobenzene and vanillin.
Keywords: Polyaniline; Bio-oil; Activation; Activated carbon; Pre-polymerization; Adsorption.
1 Introduction
Pyrolysis is an important thermochemical route to convert bulky biomass to biochar and bio-oil of much higher volumetric energy density as well as pyrolytic gases that can be combusted in situ.1–3 Biochar has versatile applications, while bio-oil is commonly accepted as an intermediate product for production of biofuel via further hydrotreatment.4–6 However, owing to the high oxygen content, high acidity and high reactivity of the organics in bio-oil towards polymerization, hydrotreatment of bio-oil for deoxygenation is rather challenging due to rapid coking and deactivation of the catalyst, making the process costly.7–10The high tendency of organics in bio-oil to polymerize is an issue for hydrotreatment, which, however, is highly desirable in the preparation of carbonaceous materials. Moreover, Fan et al. indicated that bio-oil is nearly ash-free11 and bio-oil-based materials avoid the inheritance or interference of biological structures of biomass. This makes bio-oil a suitable precursor for the preparation of carbon materials. Nonetheless, bio-oil is composed of condensable volatiles, implying high volatility of organics in bio-oil during heating, which diminishes the yield of solid carbonaceous material.12,13 For example, the study by Li et al. showed that the yield of coke derived from heating of heavy components in bio-oil was only 2.73% without adding template material or additives.14 To tackle this issue, Hu et al. proposed cross-polymerization of bio-oil with furfural, which remarkably enhanced the yield of carbonaceous material.15 Furfural can be produced from biomass via hydrolysis or pyrolysis,16–18 and opening of its furan ring during hydrolysis generates reactive intermediates,19–21 facilitating polymerization of the organics in bio-oil. Nonetheless, furfural will not work in the preparation of heteroatoms such as N-doped carbon material from bio-oil. Externally added nitrogen-containing organics are required to cross-react with the organics in bio-oil.
Herein, polyaniline (PANI) was used for the preparation of N-doped porous carbon material from bio-oil. PANI was selected as a nitrogen source, which was based on the consideration that it is alkaline and contains a benzene ring for the occurrence of polymerization via electrophilic substitution reactions. The generated product will unavoidably be impacted by a cross-reaction between PANI and bio-oil. Thus, PANI and bio-oil were mixed in various ratios and pre-polymerized at 200 °C to form a carbonaceous material, which was then activated with K2C2O4 at 800 °C to prepare activated carbon (AC). Direct activation of the mixture of PANI and bio-oil was also conducted for comparison. The obtained AC was used for adsorption of phenol from the aqueous phase and also as a carrier of nickel catalyst for hydrogenation of o-chloronitrobenzene and vanillin. The research scheme is shown in Scheme 1. Additionally, the development of functional groups of AC from activation of the carbonaceous material from the polymerization of PANI and bio-oil was investigated with in situ diffuse reflectance infrared Fourier transform spectroscopy (DRIFTS). The results indicated that cross-polymerization between PANI and bio-oil existed and was a determining factor for development of the pore structures, functionalities, and capabilities of the resulting ACs for adsorption of phenol from the aqueous phase.
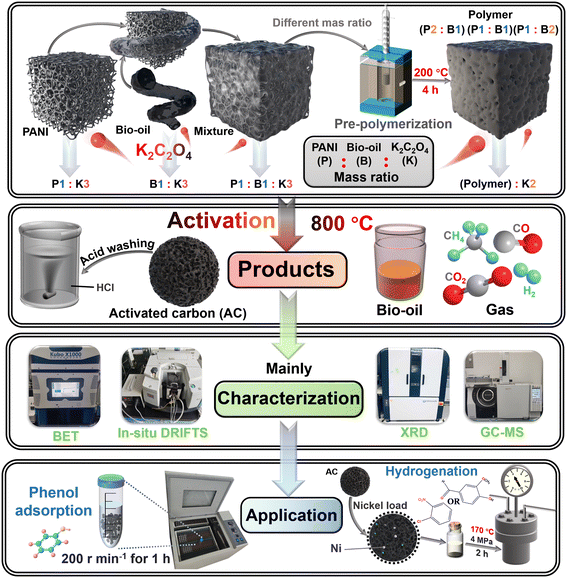 | ||
| Scheme 1 The research scheme for the direct activation or pre-polymerization plus activation of polyaniline and bio-oil. | ||
2 Results and discussion
2.1 Yields of the pyrolysis and activation products
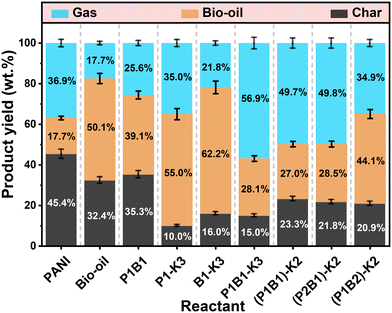
The distribution of products from the pyrolysis or activation of PANI, bio-oil or their mixture at 800 °C is shown in Fig. 1 and S2.† For the pyrolysis of PANI, bio-oil or their mixture (P1B1), the yield of bio-oil was higher (39.1% vs. 33.9% average value) with the mixture as a feedstock. This was at the cost of biochar (35.3% vs. 38.9% from average value). The heavy organics in bio-oil could react with PANI, but the thermally unstable nature of the organics led to the formation of condensable volatiles but not solid residue. PANI also interfered with aromatization of heavy phenolics during the pyrolysis. Pyrolysis of PANI generated more gases than bio-oil, while the activation of PANI with K2C2O4 further significantly increased the formation of bio-oil via cracking routes, producing AC with a very low yield (10.0%).Activation of bio-oil with K2C2O4 also formed gases as the main product, while the heavy organics in the bio-oil were more resistant to the cracking/gasification reactions induced by the high temperature and K2C2O4, generating AC of a higher yield (16.0%). Moreover, activation of the mixture of PANI and bio-oil (P1B1-K3) formed a relatively higher yield of AC (15.0% vs. 13.0% from average value), attributed to the occurrence of cross-polymerization between PANI and organics in bio-oil during the activation. Similarly, the pre-polymerization of PANI and bio-oil at 200 °C for 4 h could also enhance the thermal stability of the organics and their resistivity towards cracking/gasification, especially for the ones with a mass ratio of 1![[thin space (1/6-em)]](https://www.rsc.org/images/entities/char_2009.gif) :
:![[thin space (1/6-em)]](https://www.rsc.org/images/entities/char_2009.gif) 1 for PANI and bio-oil. The detailed composition of the bio-oil formed was further analyzed.
1 for PANI and bio-oil. The detailed composition of the bio-oil formed was further analyzed.
2.2 Characterizations of bio-oil
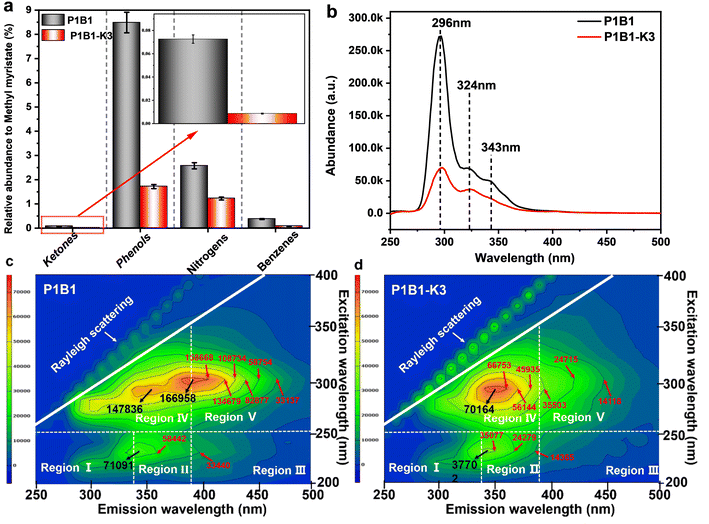
The relative abundance of light organics generated during the pyrolysis and activation of the bio-oil and PANI mixture is shown in Fig. 2a and Table S1.† The components in the liquid products from the pyrolysis of PANI and bio-oil were relatively simple, including mainly phenols (i.e. phenol, 4-ethyl-2-methoxy-phenol and 2-methoxy-4-methyl-phenol) and benzenes (i.e. styrene), nitrogen-containing organics (i.e. aniline and diphenylamine) and a small portion of ketones (i.e. 4-cyclopentene-1,3-dione and 3-methyl-1,2-cyclopentanedione). This was due to the degradation of PANI and the further cracking of heavy pyrolytic lignin and sugar oligomers in the heavy bio-oil. The activation with K2C2O4 further reduced the abundance of these light components in the liquid products. The presence of K2C2O4 led to essential cracking of these organic compounds into gases (Fig. 1). For example, the abundance of phenolics like phenol and 4-ethyl-2-methoxy-phenol, the nitrogen-containing organics like aniline and 2-hydroxy-benzonitrile, and even the benzenes like styrene decreased remarkably in the activation (Table S1†). The promotional effect of K2C2O4 on cracking/gasification also impacted the evolution of the heavy organics.Fig. 2b–d show UV fluorescence spectra of the heavy organics in the liquid products. Three main peaks located at 296, 324 and 343 nm in the 2D UV fluorescence spectra (Fig. 2b) are attributed to the organics with equivalent single to multi-benzene ring structures.22 The activation with K2C2O4 significantly reduced the abundance of the fluorescence peaks, especially the one at 343 nm, reflecting the high activity of K2C2O4 for cracking. Similar conclusions could be extracted in the 3D fluorescence spectra in Fig. 2c and d. Regions IV and V represent heavy organics with tryptophan-like and humic acid-like structures, respectively.23 K2C2O4 led to significant cracking of the humic acid-like organics, while the abundance of tryptophan-like organics also decreased remarkably.
2.3 Biochar and AC characterization
| Entry | Samples | S BET (m2 g−1) | V b (cm3 g−1) | S micro (m2 g−1) | V micro (cm3 g−1) | D a (nm) |
|---|---|---|---|---|---|---|
| a S BET is the specific surface area obtained by the BET method. b V b is the total pore volume at P/P0 = 0.99. c S micro is the micropore surface area; the percentage of Smicro/SBET is given in parentheses. d V micro is the micropore volume; the percentage of Vmicro/Vt is indicated in parentheses. e D a is the average pore diameter. | ||||||
| 1 | Biochar-P1B1 | 79.1 | 0.63 | 79.1(100%) | 0.0055(0.8%) | 31.9 |
| 2 | AC-P1-K3 | 2060.6 | 1.8 | 1962.1(95.2%) | 1.4(81.6%) | 3.4 |
| 3 | AC-B1-K3 | 1295.1 | 0.79 | 1208.0(93.3%) | 0.47(60.0%) | 2.4 |
| 4 | AC-P1B1-K3 | 1771.3 | 1.2 | 1720.3(97.1%) | 0.86(79.4%) | 2.7 |
| 5 | AC- (P1B1)-K2 | 1381.8 | 0.73 | 1340.1(97.0%) | 0.58(78.9%) | 2.1 |
| 6 | AC- (P2B1)-K2 | 1676.1 | 1.0 | 1619.2(96.6%) | 0.77(73.3%) | 2.5 |
| 7 | AC- (P1B2)-K2 | 1411.9 | 0.83 | 1372.1(97.2%) | 0.56(67.8%) | 2.3 |
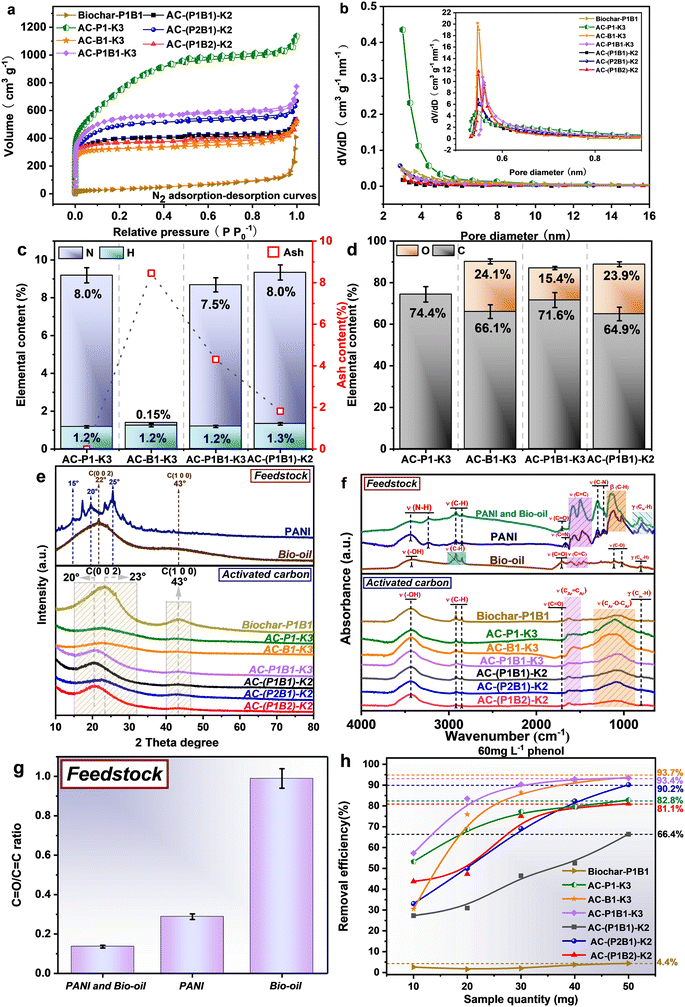
The pre-polymerization PANI and bio-oil at 200 °C also affected the evolution of the pore structure of ACs. AC-(P2B1)-K2 with higher abundance of PANI still possessed a higher specific surface area (1676.1 m2 g−1) than the counterparts. AC-(P1B1)-K2 showed a higher mass yield (Fig. 1), which was achieved at the expense of the specific surface area (1381.8 m2 g−1). Additionally, the activation of the samples with the coexistence of PANI and bio-oil all showed a higher proportion of micropores (≥96.6%) than that from only PANI (≥95.2%) or only bio-oil (≥93.3%). The formation of polymeric products from the cross-polymerization facilitated the formation of micropores. The adsorption–desorption curves of the ACs in Fig. 3 showed a rapid increase in adsorption volume when P/P0 was below 0.01. Moreover, when P/P0 was higher than 0.2, the curve approached a horizontal plateau, which conformed to a Type I curve, indicating that the pores in AC were mainly micropores with a small amount of mesopores.23,24 K2C2O4 could promote the development of the mesoporous structure of AC from PANI, forming mesopores of larger size (Fig. 3b). In contrast, for the formation of micropores, the activation of bio-oil or the mixture of PANI and bio-oil with a higher bio-oil content formed micropores of larger pore sizes.
The microcrystalline structure of ACs was further analyzed (Table S2†). The higher the stacking height (Lc) and the narrower the full-width at half-maximum (FWHM), the higher the degree of graphitization and the more orderly the arrangement of microcrystalline structure of AC. Compared with AC-P1-K3 and AC-B1-K3, the ACs obtained from the activation of mixtures of PANI and bio-oil exhibited lower FWHM and higher Lc. This once again proved that the cross-polymerization between PANI and bio-oil could form stable structures, which improved the carbonization degree of AC and promoted the orderliness of its microcrystalline structure.
![[double bond, length as m-dash]](https://www.rsc.org/images/entities/char_e001.gif) O and C–O with the absorption at 3424, 1708 and 1024–1111 cm−1, respectively. The high ratio of C
O and C–O with the absorption at 3424, 1708 and 1024–1111 cm−1, respectively. The high ratio of C![[double bond, length as m-dash]](https://www.rsc.org/images/entities/char_e001.gif) O to C
O to C![[double bond, length as m-dash]](https://www.rsc.org/images/entities/char_e001.gif) C in the bio-oil further confirmed the higher abundance of C
C in the bio-oil further confirmed the higher abundance of C![[double bond, length as m-dash]](https://www.rsc.org/images/entities/char_e001.gif) O (Fig. 3g). PANI, on the other hand, is a polymer with nitrogen-containing functional groups such as N–H,30 C
O (Fig. 3g). PANI, on the other hand, is a polymer with nitrogen-containing functional groups such as N–H,30 C![[double bond, length as m-dash]](https://www.rsc.org/images/entities/char_e001.gif) N and C–N located at 3436–3236, 1668 and 1226–1300 cm−1, respectively.31,32 After their mixing and reactions, the functionalities on the outside of the mixture were mainly governed by PANI. The ratio of C
N and C–N located at 3436–3236, 1668 and 1226–1300 cm−1, respectively.31,32 After their mixing and reactions, the functionalities on the outside of the mixture were mainly governed by PANI. The ratio of C![[double bond, length as m-dash]](https://www.rsc.org/images/entities/char_e001.gif) O to C
O to C![[double bond, length as m-dash]](https://www.rsc.org/images/entities/char_e001.gif) C further decreased (Fig. 3g) due to the abundant benzene ring structures in PANI. Importantly, the abundance of C
C further decreased (Fig. 3g) due to the abundant benzene ring structures in PANI. Importantly, the abundance of C![[double bond, length as m-dash]](https://www.rsc.org/images/entities/char_e001.gif) N diminished, suggesting the occurrence of their cross-reactions. For the ACs, the C
N diminished, suggesting the occurrence of their cross-reactions. For the ACs, the C![[double bond, length as m-dash]](https://www.rsc.org/images/entities/char_e001.gif) O and C–N functional groups largely disappeared due to the intensive cracking reactions in the activation,23 except the former in AC-B1-K3 and the latter functionality in AC-P1-K3. The vanishing of these functional groups could be due to the cross-polymerization reactions between PANI and the bio-oil.
O and C–N functional groups largely disappeared due to the intensive cracking reactions in the activation,23 except the former in AC-B1-K3 and the latter functionality in AC-P1-K3. The vanishing of these functional groups could be due to the cross-polymerization reactions between PANI and the bio-oil.
The contact angle in Fig. S3† shows that the biochar was very hydrophobic. This was due to the limited pore development and the intense cracking for removing most polar functional groups. Although the AC activated from PANI (AC-P1-K3) showed the highest specific surface area, it was extremely hydrophobic, since there was a dearth of o-containing functionality. In contrast, the AC from the activation of the feedstock containing bio-oil was rather hydrophilic, which was related to the polar oxygen-containing functional groups derived from the bio-oil (Fig. 5b, FT-IR analysis). Apart from the polar functional groups, the high degree of pore development also contributed to the high hydrophilicity of the AC.
![[double bond, length as m-dash]](https://www.rsc.org/images/entities/char_e001.gif) C–H was also attributed to PANI. The abundance of C
C–H was also attributed to PANI. The abundance of C![[double bond, length as m-dash]](https://www.rsc.org/images/entities/char_e001.gif) O and its ratio to C
O and its ratio to C![[double bond, length as m-dash]](https://www.rsc.org/images/entities/char_e001.gif) C decreased with the increase of heating temperature (Fig. S4a†), which was probably consumed via the cross-polymerization with PANI or cracking reactions.
C decreased with the increase of heating temperature (Fig. S4a†), which was probably consumed via the cross-polymerization with PANI or cracking reactions.
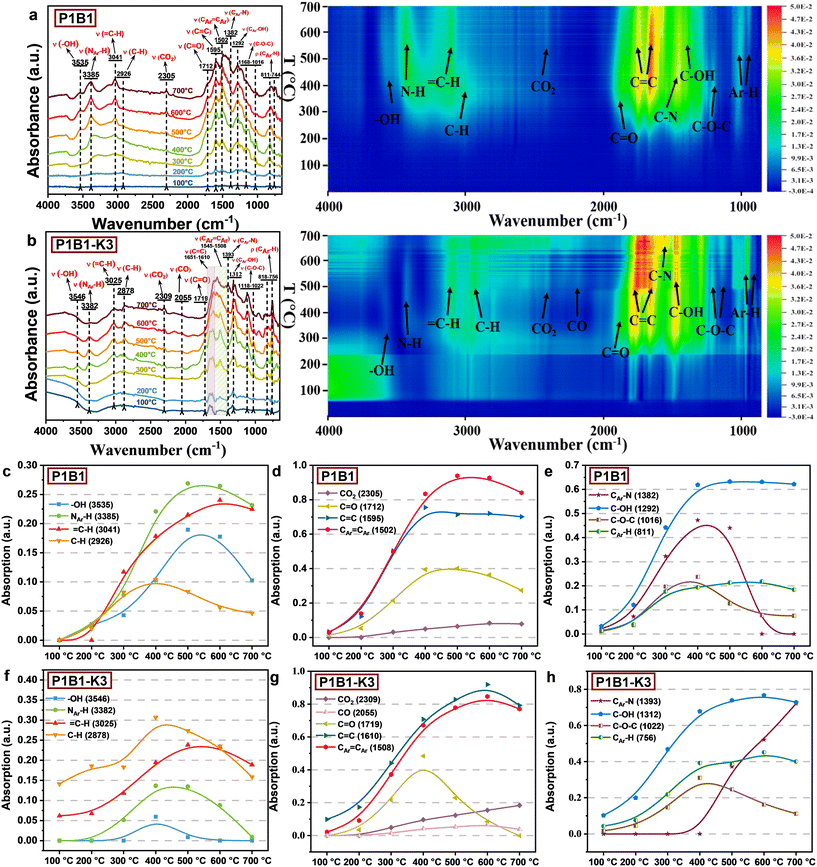 | ||
| Fig. 4 In situ DRIFTS characterization for the functionalities of the biochar/AC in heating mixture of polyaniline and bio-oil in the (a and c–e) absence of K2C2O4 and (b and f–h) presence of K2C2O4. | ||
The presence of K2C2O4 significantly changed the abundance of functional groups by promoting the cracking reactions (Fig. 4b). Even at lower temperatures, the C–H in alkanes (2878 cm−1) formed by cracking of aliphatic could be observed. In the meantime, the abundance of both N–H and –OH became much lower and further decreased through the cracking route with increasing temperature (Fig. 4f). K2C2O4 also promoted cracking of carbonyl groups (1719 cm−1), causing their large removal at 500 °C. Not all C![[double bond, length as m-dash]](https://www.rsc.org/images/entities/char_e001.gif) O were converted into the CO2 (2309 cm−1) intermediate, as some were transformed into CO (2055 cm−1). In addition, the ratio of olefinic C
O were converted into the CO2 (2309 cm−1) intermediate, as some were transformed into CO (2055 cm−1). In addition, the ratio of olefinic C![[double bond, length as m-dash]](https://www.rsc.org/images/entities/char_e001.gif) C located at 1610–1651 cm−1 to aromatic C
C located at 1610–1651 cm−1 to aromatic C![[double bond, length as m-dash]](https://www.rsc.org/images/entities/char_e001.gif) C at 1502 cm−1 decreased with increasing temperature (Fig. S4b†). This indicated that the intensive cracking reactions induced by K2C2O4 created some additional aliphatic structures. These excessive cracking reactions created the developed pore structures but also decreased the yield of the resulting AC.
C at 1502 cm−1 decreased with increasing temperature (Fig. S4b†). This indicated that the intensive cracking reactions induced by K2C2O4 created some additional aliphatic structures. These excessive cracking reactions created the developed pore structures but also decreased the yield of the resulting AC.
![[thin space (1/6-em)]](https://www.rsc.org/images/entities/char_2009.gif) :
:![[thin space (1/6-em)]](https://www.rsc.org/images/entities/char_2009.gif) 1 or 1
1 or 1![[thin space (1/6-em)]](https://www.rsc.org/images/entities/char_2009.gif) :
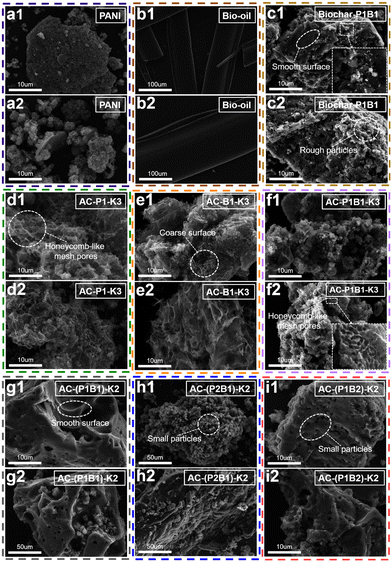
:![[thin space (1/6-em)]](https://www.rsc.org/images/entities/char_2009.gif) 2 formed AC-(P1B1)-K2 and AC-(P1B2)-K2 with a smooth surface (Fig. 5g1, g2, i1 and i2), which was paste-like material and similar to that of the biochar (Fig. 5a1 and a2). The pre-polymerization formed the organics with high resistivity towards cracking, which explained their lower specific surface area. In comparison, even after the pre-polymerization, the activation of PANI and bio-oil with a mass ratio of 2
2 formed AC-(P1B1)-K2 and AC-(P1B2)-K2 with a smooth surface (Fig. 5g1, g2, i1 and i2), which was paste-like material and similar to that of the biochar (Fig. 5a1 and a2). The pre-polymerization formed the organics with high resistivity towards cracking, which explained their lower specific surface area. In comparison, even after the pre-polymerization, the activation of PANI and bio-oil with a mass ratio of 2![[thin space (1/6-em)]](https://www.rsc.org/images/entities/char_2009.gif) :
:![[thin space (1/6-em)]](https://www.rsc.org/images/entities/char_2009.gif) 1 formed AC-(P2B1)-K2 with a broken surface decorated with lots of small particles (Fig. 5h1 and h2). Higher concentration of PANI did not facilitate the cross-polymerization, forming AC-(P2B1)-K2 with higher specific surface area but lower mass yield.
1 formed AC-(P2B1)-K2 with a broken surface decorated with lots of small particles (Fig. 5h1 and h2). Higher concentration of PANI did not facilitate the cross-polymerization, forming AC-(P2B1)-K2 with higher specific surface area but lower mass yield.
2.4 Application of AC
3 Limitations and prospect
The aforementioned findings demonstrated that cross-interactions occurred in pre-polymerization at 200 °C or activation of the mixture of PANI and bio-oil with K2C2O4 at 800 °C. This enhanced the yields of AC but did not remarkably increase or even reduce pore development during the activation, especially for the samples via the pre-polymerization pretreatment. However, the presence of bio-oil did enhance the hydrophilicity and hence performance for adsorption. This indicated that there were good sustainable application prospects of AC derived from PANI doped with bio-oil. Nonetheless, some remaining questions are to be further answered. Firstly, how the organics in the bio-oil react with PANI during direct heating of the mixture or the pre-polymerization needs to be clarified, as this impacts pore development and retainment of organics in the subsequent activation. Secondly, the cross-interaction of bio-oil and PANI is confirmed herein, influence of which on the properties of AC is also demonstrated from the above results. The unresolved issue herein is how these organics formed from the cross-polymerization reactions between PANI and bio-oil affect the pore development. The reason underneath the higher resistivity towards cracking reactions during the activation needs to be further explored. Thirdly, bio-oil is oxygen-rich while PANI is nitrogen-rich. How the oxygen- and nitrogen-containing species evolve in the activation needs to be further verified. This affects the distribution of functionalities on the surface of AC and also further application of AC as an adsorbent or carrier of catalyst.4 Conclusions
In summary, activation of PANI, bio-oil or their mixture with or without pre-polymerization with K2C2O4 as an activating agent was studied, aiming to probe the potential influence of cross-reactions of the two feedstocks of varied origin on the evolution of pore structures of AC as shown in Scheme 2. The results showed that direct activation of the mixture of PANI and bio-oil enhanced the yield of AC by 15% (with calculated average as a base) due to cross-polymerization occurring between PANI and organics in the bio-oil. Such cross-polymerization also showed synergistic effects in enhancing the specific surface area of the resultant AC from 1677.9 m2 g−1 (calculated average) to 1771.3 m2 g−1, also with more micropores generated. Nevertheless, the pre-polymerization pretreatment of PANI and bio-oil at 200 °C generated thermally more stable organics, enhancing their resistivity towards cracking/gasification in the activation. This enhanced the yield of AC from heating directly the mixture of PANI and bio-oil from 15.0% to 23.3% via the pre-polymerization plus activation, which, however, diminished the pore development and also generated more micropores. The pre-polymerization formed the carbon crystal structure in the resulting AC with less lattice distortion and retained more oxygen species. This made AC of highly hydrophilic nature, rendering superior capability for adsorption of phenol to that of the hydrophobic AC derived from activation of PANI, despite the higher specific surface area (AC–PANI, 2060.6 m2 g−1). Additionally, the activation of PANI with K2C2O4 formed AC with a coarse surface such as honeycomb-like structures. The mixing of PANI with bio-oil and the pre-polymerization pretreatment formed AC of smooth surface due to coverage of the surface of AC with heavy components of bio-oil. This enhanced the yield of AC at the expense of pore development but increased the hydrophilicity for adsorption of polar organics. In addition, the developed pore structures of AC provided abundant anchoring points for Ni, which effectively catalyzed the hydrogenation of o-chloronitrobenzene and vanillin (conversion rate reached 100%). The results herein demonstrated the cross-interactions of bio-oil with PANI during activation, but the detailed reaction network needs to be further investigated.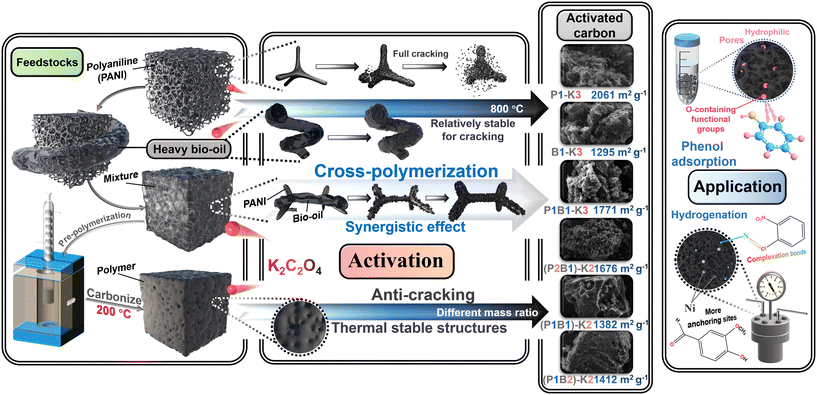 | ||
| Scheme 2 Proposed different interactions between PANI and bio-oil during activation as well as the mechanisms for phenol adsorption and catalysis of hydrogenation. | ||
5 Materials and methods
5.1 Materials
PANI and K2C2O4 were purchased from Shanghai Macklin Biochemical Co., Ltd, while ethanol was bought from Sinopharm Chemical Reagent Co., Ltd. Heavy bio-oil was produced by the pyrolysis of wheat straw at 500 °C, the detailed composition of which can be found in a previously published paper.385.2 Experimental process
![[thin space (1/6-em)]](https://www.rsc.org/images/entities/char_2009.gif) :
:![[thin space (1/6-em)]](https://www.rsc.org/images/entities/char_2009.gif) 1, 1
1, 1![[thin space (1/6-em)]](https://www.rsc.org/images/entities/char_2009.gif) :
:![[thin space (1/6-em)]](https://www.rsc.org/images/entities/char_2009.gif) 2 and 2
2 and 2![[thin space (1/6-em)]](https://www.rsc.org/images/entities/char_2009.gif) :
:![[thin space (1/6-em)]](https://www.rsc.org/images/entities/char_2009.gif) 1, which was then heated at 200 °C for 4 h in a tube furnace with a condensing unit at a heating rate of 20 °C min−1, as shown in Fig. S1.† The pretreated samples were then dried in a 90 °C oven and then impregnated with K2C2O4 with a mass ratio of 1
1, which was then heated at 200 °C for 4 h in a tube furnace with a condensing unit at a heating rate of 20 °C min−1, as shown in Fig. S1.† The pretreated samples were then dried in a 90 °C oven and then impregnated with K2C2O4 with a mass ratio of 1![[thin space (1/6-em)]](https://www.rsc.org/images/entities/char_2009.gif) :
:![[thin space (1/6-em)]](https://www.rsc.org/images/entities/char_2009.gif) 2. In addition, four control experiments, in which polyaniline and heavy bio-oil were directly impregnated with K2C2O4 in different mass ratios without pre-polymerization, were also conducted for comparison. Before the subsequent activation experiment, all the prepared samples were dried to a constant weight in an oven at 90 °C and ground to the same particle size (30–100 μm).
2. In addition, four control experiments, in which polyaniline and heavy bio-oil were directly impregnated with K2C2O4 in different mass ratios without pre-polymerization, were also conducted for comparison. Before the subsequent activation experiment, all the prepared samples were dried to a constant weight in an oven at 90 °C and ground to the same particle size (30–100 μm).
Both pyrolysis and activation experiments were conducted in a fixed bed reactor equipped with a quartz tube of 20 mm diameter under a N2 atmosphere (60 mL min−1). Typically, 5 g of mixture were placed in a quartz sleeve with a diameter of 18 mm, which was then fixed in the central heating area of the quartz reactor. Before the start of the activation, the carrier gas was introduced about 15 min in advance to flush the residual air inside the tube. The sample was then heated to 800 °C at 5 °C min−1 and held at 800 °C for 1 h. The condensable volatiles (bio-oil) generated during the activation were captured by two empty gas–liquid separators connected to the end of the quartz reactor, and the non-condensable volatiles were further trapped by a third gas–liquid separator filled with ethanol. A 15 L gas bag was additionally connected to the outlet of the third gas–liquid separator to collect gaseous products. After completion of the experiment and cooling of the reactor, the solid products were collected from the quartz sleeve and then washed and stirred with 1 mol L−1 hydrochloric acid for 12 h to remove retained inorganics to obtain AC. The calculation method for the yield of the products is shown by eqn (1)–(3). To guarantee that the experimental error was less than 5%, every experiment was conducted more than three times.
| YAC or Biochar = mAC or Biochar × 100/mmixture | (1) |
| Ybio-oil = mbio-oil × 100/mmixture | (2) |
| Ygas = 100% − YAC or Biochar − Ybio-oil | (3) |
5.3 Characterization
5.4 Adsorption experiment
The adsorption capacity of AC for phenol was determined in an aqueous solution. The prepared phenol solution (30 mL and 50 mg L−1) was mixed with AC of different loadings in a centrifuge tube, which was then placed in a shaker to vibrate at a constant rate of 200 r min−1 for 1 h. The shaken centrifuge tubes were fixed in a centrifuge and separated at 10![[thin space (1/6-em)]](https://www.rsc.org/images/entities/char_2009.gif) 000 RPM for 5 min, and then the supernatant was extracted using a 0.22 μm membrane filter. The phenol concentration in the solution after adsorption was calculated by the variation of peak intensity at 270 nm measured by an ultraviolet-visible spectrometer (AA-7000 Shimadzu, Japan). Eqn (4) and (5) display the adsorption ability (qe, mg g−1) and the removal efficiency (R, %) of the contaminants.
000 RPM for 5 min, and then the supernatant was extracted using a 0.22 μm membrane filter. The phenol concentration in the solution after adsorption was calculated by the variation of peak intensity at 270 nm measured by an ultraviolet-visible spectrometer (AA-7000 Shimadzu, Japan). Eqn (4) and (5) display the adsorption ability (qe, mg g−1) and the removal efficiency (R, %) of the contaminants.| qe = (Co − Ce)V/m | (4) |
| R = (Co − Ce)/Co × 100 | (5) |
5.5 Hydrogenation experiment
The AC/biochar samples obtained from activation/pyrolysis of different feedstocks were used as a carrier of nickel catalyst by impregnating a certain mass of Ni(NO3)2·6H2O to achieve a Ni loading of 15%. The impregnated sample was then dried in an oven at 90 °C for obtaining the precursor of the catalyst, which was placed in a tube furnace, heated to 500 °C in a N2 atmosphere at a heating rate of 5 °C min−1, and held at the end for 2 h. Finally, the calcined catalyst was reduced at 500 °C in a H2 atmosphere (60 mL min−1) for 2 h to obtain the Ni/AC catalyst. The hydrogenation experiment with Ni/AC as a catalyst was carried out in an autoclave reactor with a volume of 10 mL. The 4 g substrate–solvent mixture with a concentration of the target reactant (vanillin or o-chloronitrobenzene) of 2.5 wt% was added into the reactor with loading of catalyst of 40 mg. Before heating, the autoclave reactor was flushed with H2 three times to remove residual air and then pressurized to 4 MPa with H2. The hydrogenation experiment was carried out for 2 h at 170 °C. The liquid product was collected and analyzed by GC-MS (Shimadzu, QP2020) to calculate the conversion or yields of products.Abbreviation
| AC | Activated carbon |
| PANI | Polyaniline |
| P1B1 | Polyaniline and bio-oil mixed at a mass ratio of 1![[thin space (1/6-em)]](https://www.rsc.org/images/entities/char_2009.gif) : :![[thin space (1/6-em)]](https://www.rsc.org/images/entities/char_2009.gif) 1 1 |
| P1-K3 | Polyaniline and K2C2O4 mixed at a mass ratio of 1![[thin space (1/6-em)]](https://www.rsc.org/images/entities/char_2009.gif) : :![[thin space (1/6-em)]](https://www.rsc.org/images/entities/char_2009.gif) 3 3 |
| B1-K3 | Bio-oil and K2C2O4 mixed at a mass ratio of 1![[thin space (1/6-em)]](https://www.rsc.org/images/entities/char_2009.gif) : :![[thin space (1/6-em)]](https://www.rsc.org/images/entities/char_2009.gif) 3 3 |
| P1B1-K3 | Polyaniline, bio-oil and K2C2O4 mixed at a mass ratio of 1![[thin space (1/6-em)]](https://www.rsc.org/images/entities/char_2009.gif) : :![[thin space (1/6-em)]](https://www.rsc.org/images/entities/char_2009.gif) 1 1![[thin space (1/6-em)]](https://www.rsc.org/images/entities/char_2009.gif) : :![[thin space (1/6-em)]](https://www.rsc.org/images/entities/char_2009.gif) 3 3 |
| (P1B1)-K2 | Polyaniline and bio-oil pre-polymerized at a ratio of 1![[thin space (1/6-em)]](https://www.rsc.org/images/entities/char_2009.gif) : :![[thin space (1/6-em)]](https://www.rsc.org/images/entities/char_2009.gif) 1 and then mixed with K2C2O4 at a ratio of 1 1 and then mixed with K2C2O4 at a ratio of 1![[thin space (1/6-em)]](https://www.rsc.org/images/entities/char_2009.gif) : :![[thin space (1/6-em)]](https://www.rsc.org/images/entities/char_2009.gif) 2 2 |
| (P2B1)-K2 | Polyaniline and bio-oil pre-polymerized at a ratio of 2![[thin space (1/6-em)]](https://www.rsc.org/images/entities/char_2009.gif) : :![[thin space (1/6-em)]](https://www.rsc.org/images/entities/char_2009.gif) 1 and then mixed with K2C2O4 at a ratio of 1 1 and then mixed with K2C2O4 at a ratio of 1![[thin space (1/6-em)]](https://www.rsc.org/images/entities/char_2009.gif) : :![[thin space (1/6-em)]](https://www.rsc.org/images/entities/char_2009.gif) 2 2 |
| (P1B2)-K2 | Polyaniline and bio-oil pre-polymerized at a ratio of 1![[thin space (1/6-em)]](https://www.rsc.org/images/entities/char_2009.gif) : :![[thin space (1/6-em)]](https://www.rsc.org/images/entities/char_2009.gif) 2 and then mixed with K2C2O4 at a ratio of 1 2 and then mixed with K2C2O4 at a ratio of 1![[thin space (1/6-em)]](https://www.rsc.org/images/entities/char_2009.gif) : :![[thin space (1/6-em)]](https://www.rsc.org/images/entities/char_2009.gif) 2 2 |
| GC-MS | Gas chromatography-mass spectrometry |
| UV | UV-fluorescence spectroscopy |
| BET | Brunnauer–Emmet–Teller |
| XRD | X-ray diffraction |
| FT-IR | Fourier-transform infrared |
| DRIFTS | Diffuse reflectance infrared Fourier-transform spectroscopy |
| HHV | Higher heating value |
| SEM | Scanning electron microscopy |
| MMP | 2-Methoxy-4-methylphenol |
| EMP | 4-(Ethoxymethyl)-2-methylphenol |
Author contributions
Baihong Li: conceptualization; investigation; formal analysis; conducted the experiments and data/evidence collection; writing – original draft; writing – review & editing. Chao Li: formal analysis, verified the accuracy of the results. Dianqiang Li: formal analysis; validation. Lijun Zhang: formal analysis; investigation. Shu Zhang: supervision; project administration. Yi Wang: supervision; modified the manuscript. Song Hu: supervision; modified the manuscript. Jun Xiang: supervision; modified the manuscript. Mortaza Gholizadeh: project administration; modified the manuscript. Xun Hu: resources; supervision; writing – review & editing; guided experimental plans; funding acquisition.Conflicts of interest
The authors declare that they have no known competing financial interests or personal relationships that could have appeared to influence the work reported in this paper.Acknowledgements
This work was supported by the National Natural Science Foundation of China (No. 52276195), the Program for supporting innovative research from Jinan (202228072), and the Program of agricultural development from Shandong (SD2019NJ015).References
- C. J. Wrasman, A. N. Wilson, O. D. Mante, K. Iisa, A. Dutta, M. S. Talmadge, D. C. Dayton, S. Uppili, M. J. Watson, X. Xu, M. B. Griffin, C. Mukarakate, J. A. Schaidle and M. R. Nimlos, Catalytic pyrolysis as a platform technology for supporting the circular carbon economy, Nat. Catal., 2023, 6, 563–573 CrossRef.
- W. Cai, X. Wang, Z. Zhu, R. Kumar, P. N. Amaniampong, J. Zhao and Z.-T. Hu, Synergetic effects in the co-pyrolysis of lignocellulosic biomass and plastic waste for renewable fuels and chemicals, Fuel, 2023, 353, 129210 CrossRef CAS.
- J. He, Q. Qiang, L. Bai, W. Su, H. Yu, S. Liu and C. Li, Acetalization strategy in biomass valorization: a review, Ind. Chem. Mater., 2024, 2, 30–56 RSC.
- W. Chaiwat, R. Gunawan, M. Gholizadeh, X. Li, C. Lievens, X. Hu, Y. Wang, D. Mourant, A. Rossiter, J. Bromly and C.-Z. Li, Upgrading of bio-oil into advanced biofuels and chemicals. Part II. Importance of holdup of heavy species during the hydrotreatment of bio-oil in a continuous packed-bed catalytic reactor, Fuel, 2013, 112, 302–310 CrossRef CAS.
- H. Shahbeik, A. Shafizadeh, V. K. Gupta, S. S. Lam, H. Rastegari, W. Peng, J. Pan, M. Tabatabaei and M. Aghbashlo, Using nanocatalysts to upgrade pyrolysis bio-oil: A critical review, J. Cleaner Prod., 2023, 413, 137473 CrossRef CAS.
- S. Singh, K. K. Pant and M. Krishania, Current perspective for bio-oil production from agricultural residues in commercialization aspect: A review, J. Anal. Appl. Pyrolysis, 2023, 175, 106160 CrossRef CAS.
- X. Hu and G. Lu, Bio-oil steam reforming, partial oxidation or oxidative steam reforming coupled with bio-oil dry reforming to eliminate CO2 emission, Int. J. Hydrogen Energy, 2010, 35, 7169–7176 CrossRef CAS.
- P. Lahijani, M. Mohammadi, A. R. Mohamed, F. Ismail, K. T. Lee and G. Amini, Upgrading biomass-derived pyrolysis bio-oil to bio-jet fuel through catalytic cracking and hydrodeoxygenation: A review of recent progress, Energy Convers. Manage., 2022, 268, 115956 CrossRef CAS.
- M. Gholizadeh, S. Zhang, X. Hu and Y. Wang, Advances and Perspectives of Bio-oil Hydrotreatment for Biofuel Production, Energy Fuels, 2023, 37, 10134–10154 CrossRef CAS.
- Y. Han, B. A. Simmons and S. Singh, Perspective on oligomeric products from lignin depolymerization: their generation, identification, and further valorization, Ind. Chem. Mater., 2023, 1, 207–223 RSC.
- H. Fan, S. Zhou, Q. Li, G. Gao, Y. Wang, F. He, G. Hu and X. Hu, Hydrogen-bonded frameworks crystals-assisted synthesis of flower-like carbon materials with penetrable meso/macropores from heavy fraction of bio-oil for Zn-ion hybrid supercapacitors, J. Colloid Interface Sci., 2021, 600, 681–690 CrossRef CAS PubMed.
- Y. Chhiti, S. Salvador, J.-M. Commandre and F. Broust, Thermal decomposition of bio-oil: Focus on the products yields under different pyrolysis conditions, Fuel, 2012, 102, 274–281 CrossRef CAS.
- Z. Xiong, Y. Wang, S. S. A. Syed-Hassan, X. Hu, H. Han, S. Su, K. Xu, L. Jiang, J. Guo, E. E. S. Berthold, S. Hu and J. Xiang, Effects of heating rate on the evolution of bio-oil during its pyrolysis, Energy Convers. Manage., 2018, 163, 420–427 CrossRef CAS.
- X. Li, H. Zhang, B. Zhao and Y. Zhang, Preparation of hydrogen storage carbon materials using bio-oil heavy components as carbon-containing precursor, Fuel Process. Technol., 2020, 203, 106386 CrossRef CAS.
- X. Hu, K. Nango, L. Bao, T. Li, M. D. M. Hasan and C.-Z. Li, High yields of solid carbonaceous materials from biomass, Green Chem., 2019, 21, 1128–1140 RSC.
- X. Chen, H. Yang, Y. Chen, W. Chen, T. Lei, W. Zhang and H. Chen, Catalytic fast pyrolysis of biomass to produce furfural using heterogeneous catalysts, J. Anal. Appl. Pyrolysis, 2017, 127, 292–298 CrossRef CAS.
- B. Hu, A.-s. Cheng, W.-l. Xie, J. Liu, Y.-b. Huang, L.-j. Zhu, B. Zhang, M.-x. Li, L. Zhao, T.-p. Wang and Q. Lu, The oxalic acid-assisted fast pyrolysis of biomass for the sustainable production of furfural, Fuel, 2022, 322, 124279 CrossRef CAS.
- K. J. Yong, T. Y. Wu, C. B. T. L. Lee, Z. J. Lee, Q. Liu, J. M. Jahim, Q. Zhou and L. Zhang, Furfural production from biomass residues: Current technologies, challenges and future prospects, Biomass Bioenergy, 2022, 161, 106458 CrossRef CAS.
- P. Delliere and N. Guigo, Revealed pathways of furan ring opening and surface crosslinking in biobased polyfurfuryl alcohol, Eur. Polym. J., 2023, 187, 111869 CrossRef CAS.
- X. Zhang, Y. Shao, K. Sun, M. Fan, S. Zhang and X. Hu, Introduction of NiSO4 to Ni/SiO2 catalyst in hydrogenation of furfuryl alcohol: Tailoring metallic nickel sites to switch major product from tetrahydrofurfuryl alcohol to cyclopentanone, Mol. Catal., 2023, 542, 113136 CrossRef CAS.
- E. Andini, J. Bragger, S. Sadula and D. G. G. Vlachos, Production of neo acids from biomass-derived monomers, Green Chem., 2023, 25, 3493–3502 RSC.
- W. Chen and H.-Q. Yu, Advances in the characterization and monitoring of natural organic matter using spectroscopic approaches, Water Res., 2021, 190, 116759 CrossRef CAS PubMed.
- B. Li, C. Li, D. Li, L. Zhang, S. Zhang, Z. Cui, D. Wang, Y. Tang and X. Hu, Activation of pine needles with zinc chloride: Evolution of functionalities and structures of activated carbon versus increasing temperature, Fuel Process. Technol., 2023, 252, 107987 CrossRef CAS.
- J. Liang, C. Li, K. Sun, S. Zhang, S. Wang, J. Xiang, S. Hu, Y. Wang and X. Hu, Activation of mixed sawdust and spirulina with or without a pre-carbonization step: Probing roles of volatile-char interaction on evolution of pyrolytic products, Fuel Process. Technol., 2023, 250, 107987 CrossRef.
- Q. Yao, Q. Wang, L. Wang, Y. Wang, J. Sun, H. Zeng, Z. Jin, X. Huang and L. Chen, The synergic regulation of conductivity and Seebeck coefficient in pure polyaniline by chemically changing the ordered degree of molecular chains, J. Mater. Chem. A, 2014, 2, 2634–2640 RSC.
- M. Gusain, R. Nagarajan and S. K. Singh, Highly ordered polyaniline: synthesis, characterization and electrochemical properties, Polym. Bull., 2020, 77, 3277–3286 CrossRef CAS.
- J. Hou, X. Tu, X. Wu, M. Shen, X. Wang, C. Wang, C. Cao, H. Peng and G. Wang, Remarkable cycling durability of lithium-sulfur batteries with interconnected mesoporous hollow carbon nanospheres as high sulfur content host, Chem. Eng. J., 2020, 401, 126141 CrossRef CAS.
- J. Liang, C. Li, S. Zhang, B. A. Mohamed, L. Wang, J. Xiang, S. Hu, Y. Wang and X. Hu, Activation of poplar and spirulina with H3PO4: Marked influence of biological structures of the biomasses on evolution structure of activated carbon, Fuel Process. Technol., 2023, 252, 107986 CrossRef CAS.
- L. Fang, W. Yang, J. Hou, K. Zheng, A. Hussain, Y. Zhang, Z. Hou and X. Wang, Tofukasu-derived biochar with interconnected and hierarchical pores for high efficient removal of Cr (VI), BioChar, 2023, 5(1), 69 CrossRef CAS.
- J. Song, Z. Meng, X. Wang, G. Zhang, C. Bi and J. Hou, One-step microwave method synthesis of Fe3O4 nanoribbon@ carbon composite for Cr (VI) removal, Sep. Purif. Technol., 2022, 298, 121530 CrossRef CAS.
- M. Trchova and J. Stejskal, Polyaniline: The infrared spectroscopy of conducting polymer nanotubes (IUPAC Technical Report), Pure Appl. Chem., 2011, 83, 1803–1817 CrossRef CAS.
- J. Hou, T. Jiang, X. Wang, G. Zhang, J.-J. Zou and C. Cao, Variable dimensional structure and interface design of g-C3N4/BiOI composites with oxygen vacancy for improving visible-light photocatalytic properties, J. Cleaner Prod., 2021, 287, 125072 CrossRef CAS.
- C. Li, Y. Li, Y. Shao, L. Zhang, S. Zhang, S. Wang, B. Li, Z. Cui, Y. Tang and X. Hu, Activation of biomass with volatilized KOH, Green Chem., 2023, 25, 2825–2839 RSC.
- C. Li, J.-i. Hayashi, Y. Sun, L. Zhang, S. Zhang, S. Wang and X. Hu, Impact of heating rates on the evolution of function groups of the biochar from lignin pyrolysis, J. Anal. Appl. Pyrolysis, 2021, 155, 105031 CrossRef CAS.
- M. Xia, W. Chen, J. Wu, Y. Chen, H. Yang, X. Chen, D. Zhu and H. Chen, Organic salt-assisted pyrolysis for preparation of porous carbon from cellulose, hemicellulose and lignin: New insight from structure evolution, Fuel, 2021, 291, 120185 CrossRef CAS.
- C. Wang, D. Wu, H. Wang, Z. Gao, F. Xu and K. Jiang, Biomass derived nitrogen-doped hierarchical porous carbon sheets for supercapacitors with high performance, J. Colloid Interface Sci., 2018, 523, 133–143 CrossRef CAS PubMed.
- J. E. Del Bene, I. Alkorta and J. Elguero, Do nitrogen bases form chlorine-shared and ion-pair halogen bonds?, Chem. Phys. Lett., 2011, 508, 6–9 CrossRef CAS.
- M. Fan, Y. Shao, K. Sun, Y. Jiang, S. Zhang, Y. Wang, S. Hu, J. Xiang and X. Hu, Bio-oil as a carbon source for synthesis of pin-like cobalt catalyst for hydrogenation of o-chloronitrobenzene, Fuel Process. Technol., 2023, 248, 107814 CrossRef CAS.
Footnote |
| † Electronic supplementary information (ESI) available. See DOI: https://doi.org/10.1039/d4im00001c |
| This journal is © Institute of Process Engineering of CAS 2024 |

