 Open Access Article
Improvement of octane number in FCC gasoline through the extraction with urea/thiourea complex based on property analysis
Lin
Gao
 *abc,
Chunyu
Geng
*c,
Botao
Teng
de,
Hongwei
Xiang
ac,
Xiaodong
Wen
 *ac,
Yong
Yang
 ac and
Yongwang
Li
ac
aState Key Laboratory of Coal Conversion, Institute of Coal Chemistry, Chinese Academy of Sciences, Taiyuan 030001, P. R. China. E-mail: wxd@sxicc.ac.cn
bUniversity of Chinese Academy of Sciences, Beijing 100049, P. R. China
cNational Energy R&D Center for Coal to Liquid Fuels, Synfuels China Technology Co., Ltd., Beijing 101407, P. R. China. E-mail: gaolin@synfuelschina.com.cn; gengchunyu@synfuelschina.com.cn
dTianjin Key Laboratory of Brine Chemical Engineering and Resource Eco-utilization, College of Chemical Engineering and Materials Science, Tianjin University of Science and Technology, Tianjin 300457, China
eKey Laboratory of the Ministry of Education for Advanced Catalysis Materials, Zhejiang Normal University, Jinhua, 321004, China
First published on 16th March 2024
Abstract
In the research described in this paper, the uses of the urea/thiourea complexation approach were employed to enhance the octane number of FCC gasoline by extracting n-alkanes. It was observed that adding thiourea improved the removal of the n-alkanes from gasoline, and matching results were obtained from experiments using model samples. Molecular dynamics simulation revealed that the stability of urea complexes increased as the carbon number of the n-alkanes was raised, whereas lighter n-alkane molecules exhibited a lower propensity for complex formation with urea. This finding is in agreement with the results of the DSC measurement at the decomposition temperature. Furthermore, infrared spectrum analysis, XRD characterization, and reaction heat measurements indicated that although thiourea was introduced into the reaction system, it did not actively participate in the complexation reaction. In summary, the introduction of thiourea resulted in an increased solubility of urea in an ethanol solution and enhanced the reaction heat, suggesting its beneficial role in promoting urea complex formation and facilitating n-alkane removal from FCC gasoline.
Keywords: Urea; Thiourea; FCC gasoline; Thermoanalysis; Molecular dynamics.
1 Introduction
During the mid-twentieth century, many researchers studied urea inclusion compounds (UICs) that were constructed by combining urea host molecules with organic guest molecules. The urea host molecules formed a linear, parallel one-dimensional tunnel through hydrogen bonding, allowing for effective fixation of the organic guest molecules (primarily straight-chain aliphatic compounds containing six or more carbon atoms).1,2 This led to the development of a separation technology for n-paraffins using urea extractive crystallization. Additionally, scientists later discovered that thiourea could form inclusion compounds with branched and cyclic paraffin.3The primary application of separation technology for n-paraffins is in dewaxing, which reduces the pour point of diesel oil and determines the n-paraffin content in petroleum heavy distillates.4 However, its use in gasoline was rare due to the lighter hydrocarbon fraction and low content of n-paraffins. Although extracting n-paraffins from gasoline presents a challenge as the stability of the UICs decreases with descending carbon-number5 and achieving a high octane number—which is crucial for the antiknock index of gasoline6—could be accomplished by separating 8% n-paraffins. The present study investigates the impact of urea concentration, temperature, and the number of carbon atoms on UIC stability in the reactant phase. Our findings demonstrate that the UIC stability exhibits an upward trend with a higher urea concentration, lower reaction temperature, longer n-paraffin molecule chain, and a higher concentration of unreacted residues of n-paraffins. The ketone–water solvent7 utilized in the urea extraction crystallization process indicated certain shortcomings due to hydrolysis induced by urea. Consequently, this study opted for using ethanol as an alternative solvent.
FCC gasoline can be derived from the catalytic cracking of higher molecular weight hydrocarbons obtained by the Fischer–Tropsch Synthesis, which still contains 5–20 wt% n-paraffins and can undergo separation to enhance its octane rating. However, conventional approaches such as incorporating gasoline additives like MTBE, ETBE, and alcohols8 to improve the octane number have several drawbacks including reduced engine efficiency, contamination of underground water sources, and increased oxynitride emissions. Given the exacerbation of global climate conditions and urgent need for environmental preservation, it is imperative to explore effective and environmentally friendly methods for energy utilization.
In this research, the primary focus is on the separation of n-paraffins from FCC gasoline using the urea/thiourea complex. The utilization of urea for removing n-paraffins from FCC gasoline is an eco-friendly approach to enhance its octane number without significantly impacting on other performance indicators. Initially, a saturated solution of urea–ethanol was prepared for separating n-paraffins, however, it resulted in a low separation efficiency. Therefore, based on the carbon number distribution and low content level of n-paraffins in FCC gasoline, the raw oil was fractionated into different parts containing higher amounts of n-paraffin. It was observed that as the content of n-paraffins increased, so did its removal efficiency. Furthermore, during experimentation with adding thiourea to urea–ethanol solution, a significant improvement in the octane number was found. Consequently, extensive investigations were conducted to optimize experimental conditions, including temperature and duration, as well as ratios between activators and complexing agents. These efforts resulted in a remarkable 10% reduction in the content of n-paraffins, leading to a significant increase of 12 units in the gasoline octane number under optimal conditions. It was also noted that the composition and carbon number distribution played a crucial role in determining the effectiveness of the experimental conditions. Additionally, the stability of the UICs was investigated using molecular dynamic (MD) simulation, the results of which showed consistent agreement with experimental data obtained during earlier tests conducted on FCC feed oil.
2 Results and discussion
2.1 Experimental conditions optimization
To compare the differences in the processes of urea and urea/thiourea complexation, the effect of temperature was initially examined, as shown in Fig. 1a. Despite a decrease in the reaction rate with decreasing temperature, low temperatures favor complex formation due to exothermic nature of the complexation reactions; thus, the content of the n-alkanes in the residue decreased at a lower temperature. Meanwhile, the composition of the n-alkanes in raw materials also influences the n-alkane content in residual products after complexation; therefore, as shown in Fig. 1a, feed oil 1 at −20 °C, exhibits the lowest n-alkane content; similarly, feed oil 2 at −10 °C demonstrates a relatively lower level, which was attributed to the different distillation range temperature and different hydrocarbon compositions. Furthermore, an increase in reaction time leads to a progressively lower n-alkane content in separated products (Fig. 1b), indicating an enhanced yield of complex products.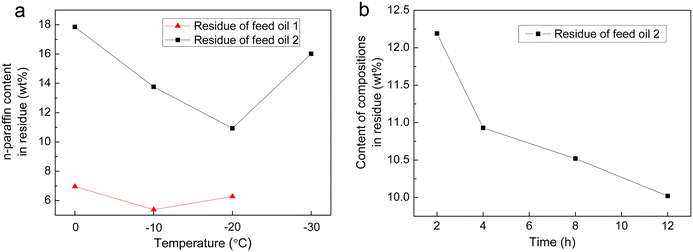 | ||
| Fig. 1 (a) N-Paraffin content in residues at different temperature; and (b) N-paraffin content in residue with different reaction times. | ||
To compare the composition of each component in the residual liquid product before and after separation, it is useful to refer to Table 1 which provides information on urea and urea–thiourea complexing reaction conditions. Fig. 2a clearly shows a significant reduction in n-alkane content when using urea or urea–thiourea as complexing agents, while the aromatic content increases when compared to the original feed oil. This outcome undoubtedly contributes to an improved octane number of the liquid phase product oil, so feed oil 1 has an octane number of 69.8, and the residue octane number is 84.2 after complexing with urea and thiourea according to measurements performed using standard ASTM D2699. Furthermore, it was observed that with the addition of thiourea, there was a lower presence of the n-alkanes in the liquid phase product, thus facilitating their removal.
The ratio of urea to thiourea was adjusted to investigate the effect of thiourea addition on the removal of the n-alkanes, followed by an examination of the remaining liquid phase products to determine their n-alkane content. As shown in Fig. 2b and c, it is evident that a 1![[thin space (1/6-em)]](https://www.rsc.org/images/entities/char_2009.gif) :
:![[thin space (1/6-em)]](https://www.rsc.org/images/entities/char_2009.gif) 1 ratio of urea to thiourea results in a relatively lower content of the n-alkanes in the product. Therefore, the appropriate complexing agent ratio can be determined based on a urea to thiourea ratio of 1
1 ratio of urea to thiourea results in a relatively lower content of the n-alkanes in the product. Therefore, the appropriate complexing agent ratio can be determined based on a urea to thiourea ratio of 1![[thin space (1/6-em)]](https://www.rsc.org/images/entities/char_2009.gif) :
:![[thin space (1/6-em)]](https://www.rsc.org/images/entities/char_2009.gif) 1.
1.
2.2 Model FCC comparison
As is already known, petroleum products, including gasoline, can be categorized into n-alkanes, olefins, i-alkanes, cycloalkanes, and aromatic hydrocarbons based on their group composition. In this study, representative hydrocarbons in FCC gasoline such as octane, isooctane, 1-octene, cyclohexane and xylene (the mass ratio is approximately 1![[thin space (1/6-em)]](https://www.rsc.org/images/entities/char_2009.gif) :
:![[thin space (1/6-em)]](https://www.rsc.org/images/entities/char_2009.gif) 5
5![[thin space (1/6-em)]](https://www.rsc.org/images/entities/char_2009.gif) :
:![[thin space (1/6-em)]](https://www.rsc.org/images/entities/char_2009.gif) 4
4![[thin space (1/6-em)]](https://www.rsc.org/images/entities/char_2009.gif) :
:![[thin space (1/6-em)]](https://www.rsc.org/images/entities/char_2009.gif) 2
2![[thin space (1/6-em)]](https://www.rsc.org/images/entities/char_2009.gif) :
:![[thin space (1/6-em)]](https://www.rsc.org/images/entities/char_2009.gif) 2, based on the proportion of components in the feed oil) were employed as model components (MFCC) to qualitatively and representatively investigate the function of thiourea with urea and hydrocarbon. The temperature of the reaction was approximately −10 °C, while the reaction time lasts for about 4 h.
2, based on the proportion of components in the feed oil) were employed as model components (MFCC) to qualitatively and representatively investigate the function of thiourea with urea and hydrocarbon. The temperature of the reaction was approximately −10 °C, while the reaction time lasts for about 4 h.
Fig. 3 shows analytical results comparing the n-alkanes with other components in the complex formed by urea and the urea–thiourea complexing agent. It can be clearly observed that the content of octane in the residue decreased with the addition of more urea, which was due to its reaction with octane forming a urea complex. Furthermore, upon addition of thiourea, there was a further decrease in the octane content indicating an increased level of complexation. Meanwhile, if only thiourea is added to the complexation reaction, the content of octane in the residue increases, while for cyclohexane significantly decreases, which indicated that thiourea preferentially complexed with the cycloalkanes.
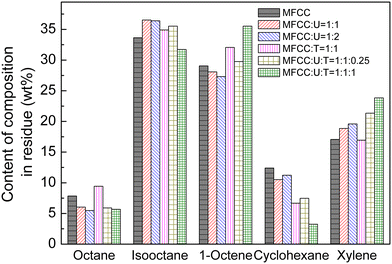 | ||
| Fig. 3 Comparison of MFCC separated using urea, thiourea and a urea + thiourea complex with different ratios (U: urea and T: thiourea). | ||
When urea and thiourea were added together, the amount of thiourea has an impact on the octane content in the residue, which indicated that the addition of thiourea was beneficial for the complexation reaction, and the complexing agent can form more complexes with octane. Additionally, when urea and thiourea are added in a 1![[thin space (1/6-em)]](https://www.rsc.org/images/entities/char_2009.gif) :
:![[thin space (1/6-em)]](https://www.rsc.org/images/entities/char_2009.gif) 1 ratio, cyclohexane and thiourea are complexed, which caused a significant decrease in cyclohexane content and an increase in other components, especially xylene and 1-octene.
1 ratio, cyclohexane and thiourea are complexed, which caused a significant decrease in cyclohexane content and an increase in other components, especially xylene and 1-octene.
It can be concluded that the coordination between thiourea and octane without urea is poor because when compared to urea/thiourea addition, the octane content in the residue liquid phase increased when only thiourea was added to the MFCC. Based on results in Fig. 3, the utilization of urea and thiourea as a complexing agent was beneficial for the complexation and elimination of the n-alkanes, which shows agreement with findings during urea dewaxing of the feed oils.
2.3 MD simulation
The crystal structure, which consists of an hexagonal prism channel structure formed by hydrogen bonding of the urea host molecules, was determined using X-ray single crystal structure parameters of the urea complexes.9 The initial model of the urea complex crystal involved incorporating the n-alkanes with varying carbon numbers into the channel structure of the main urea molecule according to periodic changes in the crystal cell, followed by optimization of hydrocarbon molecule structures. For a deeper understanding of the effect of thiourea addition, molecular dynamics (MD) simulations were performed on the optimized urea complex crystal using the force module of the Materials Studio software package.10 This study selected the crystal structure of the urea molecule and its complex with C5, C6, C7, C16 or C30 as research objects.When conducting MD simulations, a simulation box with dimensions of 24 × 24 × 33 Å3, which is equivalent to using 4 × 4 × 3 crystal cells, was employed. The simulations were performed under an isothermal–isobaric (NPT) ensemble using the compass force field. The system temperature and pressure conditions were set in accordance with the simulation system, introducing a simulation time of 300 ps and a step size of 1 fs. Periodic boundary conditions were implemented, while van der Waals and electrostatic interactions were handled using the Ewald method. All atoms underwent unrestricted movement during the simulation process, with the temperature and pressure controlled by Andersen11 and Berendsen12 methods, respectively. With these specified simulation parameters, the initial structural optimization of the research object was first carried out prior to the molecular dynamics simulation, recording the motion trajectory every 500 steps.
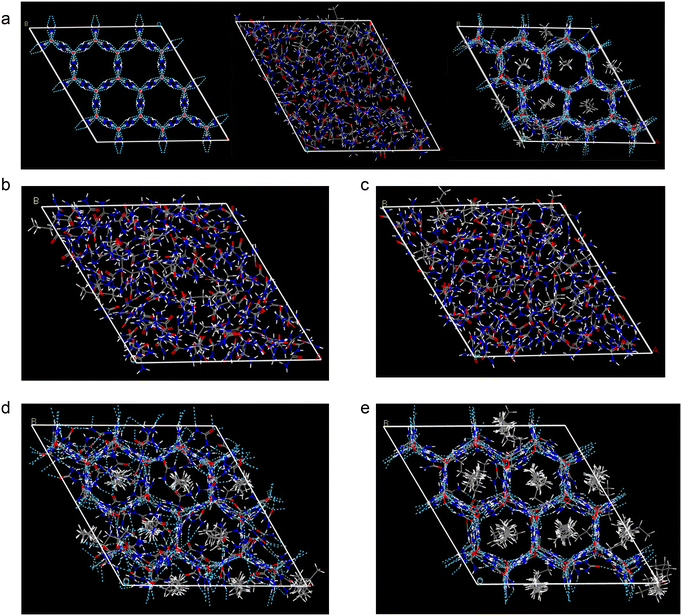
Under a system temperature of 25 °C, the main molecular structure of urea (urea), C5 urea complex (C5-UIC), and C6 urea complex (C6-UIC) were subjected to molecular dynamics simulations. Fig. 4a shows that at 25 °C, the lattice structure of urea and C5-UIC was disrupted in the absence of normal hydrocarbon molecules, while C6-UIC maintains its regular crystal structure.
The MD simulations were conducted on C6-UIC at a temperature of 50 °C and 75 °C, and the stability of the C5 and C6 urea complexes was compared using the oxygen atom radial distribution function (RDF) at 25, 50, and 75 °C, as shown in Fig. 5a. In the RFD analysis, a regular crystal lattice exhibits a uniform distribution of positions between the oxygen atoms in the lattice space, resulting in a consistent pattern in the RFD. Conversely, the regular distribution of atoms is disrupted when the lattice is destroyed, leading to a smaller peak of the RFD. For this reason, the comparison in Fig. 5a proves that the stability of Urea-C6 deteriorates with the increasing temperature.
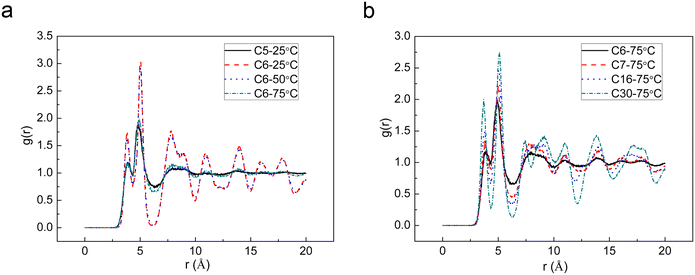 | ||
| Fig. 5 (a) RDF of C5 urea and C6-UIC at different temperatures and (b) comparison of RDF for C6, C7, C16, and C30 complexes. | ||
The MD simulations were performed on C6, C7, C16, and C30 urea complexes at 75 °C. The simulation results are presented in Fig. 4b–e, and the radial distribution of the complexes is shown in Fig. 5b. As shown in Fig. 4b–e, the initial structure of the C6 and C7 urea complexes had been disrupted at higher temperatures. Conversely, the C16 and C30 urea complexes can basically maintain their initial structure with minimal structural changes in the latter. Furthermore, as shown in Fig. 5b, an increase in carbon number for the n-alkanes leads to a gradual enhancement of peak value in the radial distribution of the urea complexes at r = 5 Å. This indicates an improved stability of complex formation between high carbon the n-alkanes and urea.
2.4 Structure analysis
During the research on the dewaxing process, it was found that the addition of thiourea is advantageous for the n-alkane removal from FCC gasoline. To elucidate the role of thiourea in the complexation process, infrared spectroscopy was employed to characterize solid phase products obtained by the complexation reactions involving urea, thiourea, a mixture of urea and thiourea, n-hexadecane with urea (C16-UIC), and n-hexadecane with urea thiourea (C16-U-TIC), as shown in Fig. 6a. It can be observed that there is no significant difference in the formation of complex products between C16-UIC and C16-U-TIC. The positions of absorption peaks were basically identical, and on particular showed a broad peak at about 608 cm−1,13 indicating that C16-UIC and C16-U-TIC correspond to crystals formed by complexes involving urea.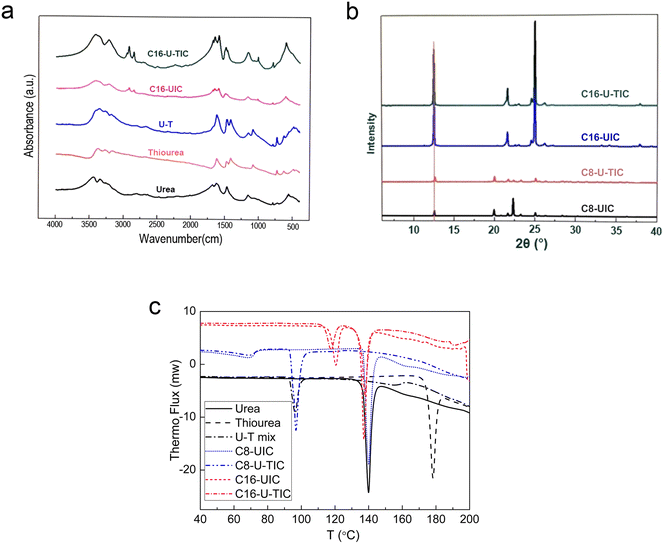 | ||
| Fig. 6 (a) Comparison of IR analyses; (b) XRD spectra of C8 and C16 urea complexes; and (c) DSC curves of the compounds. | ||
In Fig. 6b, a comparison of XRD spectra results shows that, following the reaction of C8 and C16 with urea and urea thiourea complexing agents, their spectra reveal a high degree of consistency. Meanwhile, it can be seen that there is a diffraction peak with a diffraction angle of 2θ = 12.2°, which means that complex crystals all have a hexagonal structure, confirming the formation of C8-UIC and C16-UIC. Moreover, the XRD diffraction peak intensity for C16-UIC and C16-U-TIC surpasses that of C8-UIC and C8-U-TIC, and this shows the superior crystal characteristics of C16-UIC and C16-U-TIC.
Differential scanning calorimetry(DSC) was used to determine the temperature increasing thermal decomposition process of these substances (Fig. 6c). By comparing DSC analysis results of the thermal stability for the urea thiourea complex and the urea complex, it can be seen that the melting temperature of urea is 137 °C and that of thiourea is 179 °C, while after mixing urea and thiourea, the melting temperature decreased to 96 °C, indicating the formation of a co-melting point. For the complexes, C8-UIC has an initial decomposition temperature of 64 °C, and C16-UIC has an initial decomposition temperature of 115 °C. The decomposition temperature of C16-UIC is higher than that of C8-UIC and indicates the better thermal stability for C16-UIC compared to that of C8-UIC. This observation was consistent with MD simulation results, which indicated that high carbon n-alkanes form more stable complexes with urea than low carbon n-alkanes do. There is no significant difference in the decomposition process between C8-U-TIC and C8-UIC or between C16-U-TIC and C16-UIC, indicating that C8 and C16 n-alkanes form similar substances when complexed with either urea or urea thiourea.
According to thermal analysis results, it can be seen that the addition of thiourea did not cause a significant difference in the decomposition process of the complex, thereby indicating an absence of new compound formation between the n-alkanes and thiourea. However, the co-melting point observed in the mixture of urea and thiourea suggested that the urea thiourea method exhibited a superior efficacy in separating the n-alkanes. This phenomenon can be attributed to the enhanced properties of urea resulting from the addition of thiourea, which facilitate a more efficient complexation between urea and the n-alkanes.
2.5 Thermal analysis of solutions
To further validate the involvement of thiourea in the complexation process, a SETARAM BT2.15 microcalorimeter was utilized to measure the heat released during the complexation process and to compare it with other reaction heats. The mass and reaction heat data obtained are presented in Table 2. When an equivalent quantity of urea is dissolved in ethanol and thiourea–ethanol solutions, dissolution processes exhibit endothermic characteristics. Notably, upon addition of urea, the enthalpy change associated with dissolution significantly increases when compared to that observed without urea addition. This observation strongly suggests that incorporating thiourea enhances the solubility of urea.The n-alkanes, namely n-hexane, n-octane, n-decane, and n-dodecane, were selected as the subjects of investigation. Urea and/or thiourea was added to an ethanol solution for complete dissolution. Subsequently, the mixed ethanol solution was combined with the n-alkanes to measure the heat generated during the mixing process. The object of this mixing procedure was to assess whether the addition of thiourea could enhance the complexation efficiency of the n-alkanes. The outcomes are presented in Table 3. From the perspective of the complexation reactions, an increase in alkane complexes would inevitably lead to a higher reaction heat under identical reaction conditions. Therefore, by comparing the results obtained from measuring the reaction heat, whether addition of thiourea is advantageous for enhancing urea complexation can be determined.
| No. | Alcohol (g) | Urea (g) | Thiourea (g) | n-Alkane (g) | ΔH (mJ) |
|---|---|---|---|---|---|
| C6 | |||||
| Ref. 1 | 1.5015 | 0.4007 | |||
| 1.5018 | 0.1500 | 0.4019 | −881.7 | ||
| Ref. 2 | 1.5022 | 0.1504 | 0.4008 | ||
| 1.5042 | 0.1506 | 0.1511 | 0.4007 | −6973.7 | |
| C8 | |||||
| Ref. 3 | 1.5014 | 0.1525 | |||
| 1.5010 | 0.1509 | 0.1508 | −9726.6 | ||
| Ref. 4 | 1.5012 | 0.1520 | 0.1525 | ||
| 1.5006 | 0.1506 | 0.1512 | 0.1530 | −10![[thin space (1/6-em)]](https://www.rsc.org/images/entities/char_2009.gif) 700.8 700.8 |
|
| C10 | |||||
| Ref. 1 | 1.5000 | 0.1521 | |||
| 1.5005 | 0.1504 | 0.1525 | −12![[thin space (1/6-em)]](https://www.rsc.org/images/entities/char_2009.gif) 741.1 741.1 |
||
| Ref. 2 | 1.5004 | 0.1502 | 0.1530 | ||
| 1.5001 | 0.1500 | 0.1512 | 0.1521 | −16![[thin space (1/6-em)]](https://www.rsc.org/images/entities/char_2009.gif) 605.3 605.3 |
|
| C12 | |||||
| Ref. 1 | 1.5008 | 0.1527 | |||
| 1.5008 | 0.1502 | 0.1522 | −17![[thin space (1/6-em)]](https://www.rsc.org/images/entities/char_2009.gif) 190.3 190.3 |
||
| Ref. 2 | 1.5003 | 0.1506 | 0.1523 | ||
| 1.5003 | 0.1505 | 0.1505 | 0.1531 | −20![[thin space (1/6-em)]](https://www.rsc.org/images/entities/char_2009.gif) 050.3 050.3 |
|
In Table 3, upon comparing reaction enthalpies, it is evident that for low-carbon alkanes, when thiourea is added, there is a significant increase in reaction enthalpies under equivalent urea conditions. This further confirms the advantageous role of thiourea in promoting urea complexation reactions, because thiourea has a catalytic effect on the reaction process. Consequently, this explains why the n-alkane content in the residual liquid phase decreases after adding thiourea to FCC gasoline.
In Table 4, according to the composition of the FCC gasoline feed oil, the n-alkanes were mixed in specific ratios as model alkanes, and their reaction heats with urea and urea thiourea complexing agents were compared. It was obvious that the reaction heat of the urea thiourea agent with the n-alkanes is greater than that of urea alone. When only thiourea is used for complexation without adding urea, a significant endothermic process occurs, indicating a negligible interaction between thiourea and the n-alkanes. Using the dissolution heat measurements presented in Table 4, it is possible to elucidate why thiourea can improve the yield of the complexation reaction between urea and the n-alkanes. This improvement primarily stems from the ability of thiourea to increase the solubility of urea, thereby enhancing mass transfer efficiency and facilitating easier formation of the urea complexes. Consequently, when treating FCC gasoline to improve the octane number, employing urea thiourea as a complexing agent for the interaction with the n-alkanes and increasing their removal proves to be a reasonable solution.
| No. | Alcohol (g) | Urea (g) | Thiourea (g) | n-Alkanes (g) | ΔH (mJ) |
|---|---|---|---|---|---|
C6![[thin space (1/6-em)]](https://www.rsc.org/images/entities/char_2009.gif) : :![[thin space (1/6-em)]](https://www.rsc.org/images/entities/char_2009.gif) C8 = 4 C8 = 4![[thin space (1/6-em)]](https://www.rsc.org/images/entities/char_2009.gif) : :![[thin space (1/6-em)]](https://www.rsc.org/images/entities/char_2009.gif) 1 1 |
|||||
| Ref. 1 | 1.5067 | 0.5057 | |||
| 1.5069 | 0.1509 | 0.5049 | −1650.5 | ||
| Ref. 2 | 1.5024 | 0.1505 | 0.5064 | ||
| 1.5014 | 0.1525 | 0.1508 | 0.5051 | −13![[thin space (1/6-em)]](https://www.rsc.org/images/entities/char_2009.gif) 018.8 018.8 |
|
C6![[thin space (1/6-em)]](https://www.rsc.org/images/entities/char_2009.gif) : :![[thin space (1/6-em)]](https://www.rsc.org/images/entities/char_2009.gif) C7 C7![[thin space (1/6-em)]](https://www.rsc.org/images/entities/char_2009.gif) : :![[thin space (1/6-em)]](https://www.rsc.org/images/entities/char_2009.gif) C8 = 3.8 C8 = 3.8![[thin space (1/6-em)]](https://www.rsc.org/images/entities/char_2009.gif) : :![[thin space (1/6-em)]](https://www.rsc.org/images/entities/char_2009.gif) 13.2 13.2![[thin space (1/6-em)]](https://www.rsc.org/images/entities/char_2009.gif) : :![[thin space (1/6-em)]](https://www.rsc.org/images/entities/char_2009.gif) 4.7 4.7 |
|||||
| Ref. 1 | 1.5010 | 0.5075 | |||
| 1.5017 | 0.1534 | 0.5015 | −7957.4 | ||
| Ref. 2 | 1.5006 | 0.1566 | 0.5000 | ||
| 1.5004 | 0.1508 | 0.1574 | 0.5040 | −14![[thin space (1/6-em)]](https://www.rsc.org/images/entities/char_2009.gif) 130.6 130.6 |
|
C6![[thin space (1/6-em)]](https://www.rsc.org/images/entities/char_2009.gif) : :![[thin space (1/6-em)]](https://www.rsc.org/images/entities/char_2009.gif) C7 C7![[thin space (1/6-em)]](https://www.rsc.org/images/entities/char_2009.gif) : :![[thin space (1/6-em)]](https://www.rsc.org/images/entities/char_2009.gif) C8 C8![[thin space (1/6-em)]](https://www.rsc.org/images/entities/char_2009.gif) : :![[thin space (1/6-em)]](https://www.rsc.org/images/entities/char_2009.gif) xylene = 3.8 xylene = 3.8![[thin space (1/6-em)]](https://www.rsc.org/images/entities/char_2009.gif) : :![[thin space (1/6-em)]](https://www.rsc.org/images/entities/char_2009.gif) 13.0 13.0![[thin space (1/6-em)]](https://www.rsc.org/images/entities/char_2009.gif) : :![[thin space (1/6-em)]](https://www.rsc.org/images/entities/char_2009.gif) 4.3 4.3![[thin space (1/6-em)]](https://www.rsc.org/images/entities/char_2009.gif) : :![[thin space (1/6-em)]](https://www.rsc.org/images/entities/char_2009.gif) 80.7 80.7 |
|||||
| Ref. 1 | 1.5027 | 1.5048 | |||
| 1.5022 | 0.1548 | 1.5045 | −1113.5 | ||
| Ref. 2 | 1.5051 | 0.1507 | 1.5060 | ||
| 1.5021 | 0.1525 | 0.1523 | 1.5038 | −7521.4 | |
| Ref. 3 | 1.5046 | 1.5025 | |||
| 1.5018 | 0.1508 | 1.5037 | 1122.2 | ||
3 Conclusions
The primary focus of this paper is to examine the role of thiourea in the urea complexation process. An investigation into the dewaxing process of FCC gasoline using urea, it was observed that adding thiourea is beneficial for the removal of the n-alkanes from FCC gasoline, and this means that there is a significant reduction in their content within the remaining liquid phase. Furthermore, consistent outcomes were obtained when studying model samples consisting of n-alkanes.Using MD simulation, the stability of n-alkane complexes with different carbon numbers was compared. It was observed that the stability of the urea complexes increased with increasing carbon atom numbers from C6 to C30, which is agreement with the decomposition temperature results obtained from the DSC analysis. This finding also indicates that gasoline, because of its composition of small hydrocarbon molecules, does not readily form complexes with urea.
By further measuring and comparing infrared spectra, XRD spectra, and reaction heats of the complexes, it can be concluded that despite the thiourea addition to the reaction system, no formable compounds were detected in the complexation products. This suggests that thiourea does not participate in the urea complexation process. However, upon addition of thiourea, there is an increase in urea solubility in the ethanol solvent, which facilitates the formation of complexes between urea and the n-alkanes. Consequently, the addition of thiourea during the urea dewaxing process of FCC gasoline, as supported by experimental and calculation approaches, unequivocally leads to a substantial reduction in the n-alkane content within the remaining liquid phase products. This is highly advantageous for improving the octane number of gasoline.
4 Experimental section
4.1 Feed oil preparation
The gasoline fraction is primarily composed of hydrocarbons ranging from C5 to C12, with a significantly low octane number due to the presence of n-pentane (RON = 61), n-hexane (RON = 26), n-heptane (RON = 0), and n-octane (RON = −17).14 Low carbon alkanes (e.g., pentane) have weak reactivity with urea, thus FCC gasoline can be cut to two parts, then the cut heavy fraction was complexed with urea to remove the n-alkanes and increase the octane number.15The heavy fractions of FCC gasoline obtained from SFC (Synfuels China Technology Co., Ltd., Beijing) and distilled at above 100 °C were used to create feed oil 1, while fractions obtained by distillation between 75 °C and 135 °C from this gasoline were utilized as feed oil 2. The compositions and carbon-number distributions for both the feed oils are listed in Tables 5 and 6.
| Feed oil | NP (wt%) | IP (wt%) | O (wt%) | N (wt%) | A (wt%) |
|---|---|---|---|---|---|
| NP: n-paraffin; IP: iso-paraffin; O: olefin; N: naphthenic hydrocarbon; A: aromatic hydrocarbon. | |||||
| FCC gasoline | 12.92 | 27.10 | 38.85 | 5.54 | 14.84 |
| 1 | 17.57 | 20.65 | 21.29 | 6.72 | 31.71 |
| 2 | 21.83 | 12.59 | 26.34 | 4.63 | 34.18 |
| Feed oil | C6 (wt%) | C7 (wt%) | C8 (wt%) | C9 (wt%) | C10 (wt%) | C11 (wt%) | C12 (wt%) |
|---|---|---|---|---|---|---|---|
| 1 | — | 0.86 | 2.18 | 5.63 | 5.28 | 2.68 | 0.94 |
| 2 | 3.75 | 13.23 | 4.70 | 0.06 | — | — | — |
4.2 Separation procedure
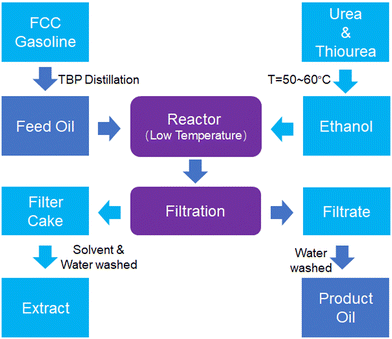
Fig. 7 illustrates the separation procedure for n-paraffin in FCC gasoline. First, FCC gasoline is distilled using true boiling point (TBP) techniques to obtain heavy n-paraffin (HNP) gasoline, which serves as feed oil. The HNP gasoline is charged into a reactor and mixed with a saturated solution of urea–thiourea–ethanol. The reaction temperature gradually increases to 50–60 °C over 30 min before being rapidly cooled to a low temperature and later allowed to react for about 4 h. The product of this reaction is a crystalline urea complex that exists in a fluid slurry state of a two-phase liquid system. The slurry is filtered to give two parts: the filtrate and filter cake. The filtrate undergoes washing with water to obtain the product oil, whereas the filter cake undergoes washing with solvent and water to extract the n-alkanes in the complex.4.3 Composition analysis
Feed oils and products are distinguished using the Agilent 7890 gas chromatography (GC) system, with operating conditions of H2 flow rate = 30 mL min−1; a capillary column of Agilent DB-1, measuring 50 m × 210 μm × 0.5 μm; the initial temperature is set at 35 °C for 15 min, followed by an increase of 2 °C min−1 up to a maximum of 180 °C, and further an increase of 5 °C min−1 up to a maximum of 220 °C, with a final hold time at 220 °C for 70 min. The precise quantitative and qualitative analysis of each sample is conducted by the use of the Agilent 7890 GC system and ChemStation software developed by the Research Institute of Petroleum Processing (ASTM D5134-98). Moreover, the octane number is accurately calculated by taking into account the gasoline composition.4.4 Thermal measurement
The SETARAM BT2.15 microcalorimeter was utilized for determining the heat flow rate of reactions involving urea/thiourea and n-alkanes at 25 °C, as previously described in the literature.16,17 The mixing/stirring cells provided by the manufacturer can efficiently measure the mixing heat. In addition, all reagents used have been confirmed to be of analytical purity.Author contributions
Lin Gao: methodology, investigation, formal analysis, validation, data curation, writing – original draft. Chunyu Geng: investigation, formal analysis, writing – review & editing. Botao Teng: methodology, formal analysis and MD calculations. Hongwei Xiang: project administration, supervision. Xiaodong Wen: methodology, project administration, funding acquisition, supervision. Yong Yang: methodology, conceptualization, funding acquisition, supervision. Yongwang Li: methodology, conceptualization.Conflicts of interest
The authors declare that they have no known competing financial interests or personal relationships that could have appeared to influence the work reported in this paper.Acknowledgements
The authors gratefully acknowledge the financial support from the key special project of “Inner Mongolia Revitalization Action with Science and Technology” (No. 2021EEDSCXSFQZD004) and from the Clean Combustion and Low-carbon Utilization of Coal Strategic Priority Research Program of the Chinese Academy of Sciences (Grant No. XDA 29000000).References
- Y. Wang, X. Ge, M. Zhang, H. Zhu, Z. Zhang and M. Wang, Growth characteristic, guest distribution, guest ordering and the stability of urea inclusion compounds with 1-decene, n-decane and mixture of 1-decene and n-decane, J. Mol. Struct., 2014, 1058, 259–264 CrossRef CAS.
- D. Swern, Urea and thiourea complexes in separating organic compounds, Ind. Eng. Chem., 1955, 47, 216–221 CrossRef CAS.
- A. A. Lappas, D. Patiaka, D. Ikonomou and I. A. Vasalos, Separation and characterization of paraffins and naphthenes from FCC feedstocks, Ind. Eng. Chem. Res., 1997, 36, 3110–3115 CrossRef CAS.
- J. R. Marquart, G. B. Dellow and E. R. Freitas, Determination of noraml paraffins in petroleum heavy distillates by urea adduction and gas chromatography, Anal. Chem., 1968, 40, 1633–1637 CrossRef CAS.
- K. A. Kobe and L. R. Reinhart, Separation of organic compounds with urea and thiourea, J. Chem. Educ., 1959, 36, 300 CrossRef.
- E. Singh, J. Badra, M. Mehl and S. M. Sarathy, Chemical kinetic insights into the octane number and octane sensitivity of gasoline surrogate mixtures, Energy Fuels, 2017, 31, 1945–1960 CrossRef CAS.
- W. A. Bailey, R. A. Bannerot, L. C. Fetterly and A. G. Smith, Urea extractive crystallization of straight-chain hydrocarbons, Ind. Eng. Chem., 1951, 43, 2125–2129 CrossRef CAS.
- T. Ogura, Y. Sakai, A. Miyoshi, M. Koshi and P. Dagaut, Modeling of the oxidation of primary reference fuel in the presence of oxygenated octane improvers: Ethyl tert-butyl ether and ethanol, Energy Fuels, 2007, 21, 3233–3239 CrossRef CAS.
- L. Yeo, B. M. Kariuki, H. Serrano-González and K. D. M. Harris, Structural properties of the low-temperature phase of the hexadecane/urea inclusion compound, investigated by synchrotron x-ray powder diffraction, J. Phys. Chem. B, 1997, 101, 9926–9931 CrossRef CAS.
- Materials Studio, version 4.0, Accelrys Software, Inc., San Diego, CA, 2006 Search PubMed.
- H. C. Andersen, Molecular dynamics simulations at constant pressure and/or temperature, J. Chem. Phys., 2008, 72, 2384–2393 CrossRef.
- H. J. C. Berendsen, J. P. M. Postma, W. F. van Gunsteren, A. DiNola and J. R. Haak, Molecular dynamics with coupling to an external bath, J. Chem. Phys., 1984, 81, 3684–3690 CrossRef CAS.
- H. L. Casal, Conformations of n-alkanes in urea inclusion adducts, J. Phys. Chem., 1990, 94, 2232–2234 CrossRef CAS.
- D. Stratiev, I. Shishkova, M. Ivanov, R. Dinkov, V. Toteva, D. Angelova, I. Kolev, M. Tavlieva and D. Yordanov, Alternative options for ebullated bed vacuum residue hydrocracker naphtha utilization, Processes, 2023, 11, 3410 CrossRef CAS.
- X. Qin, L. Ye, J. Liu, Y. Xu, A. Murad, Q. Ying, H. Shen, X. Wang, L. Hou, X. Pu, X. Han, J. Li, R. Wang and N. Liu, A molecular-level coupling model of fluid catalytic cracking and hydrotreating process to improve gasoline quality, Chem. Eng. J., 2023, 451, 138778 CrossRef CAS.
- Y. Huang, J. Liu, Y. Liu and Z. Zhang, Further study on thermokinetics of n-C36H74 oxidation(ii) — the n-C36H74 oxidization at different temperatures, Thermochim. Acta, 2000, 352–353, 141–145 CrossRef CAS.
- T. H. Syed, T. J. Hughes, K. N. Marsh and E. F. May, Isobaric heat capacity measurements of liquid methane+propane, methane+butane, and a mixed refrigerant by differential scanning calorimetry at high pressures and low temperatures, J. Chem. Eng. Data, 2014, 59, 968–974 CrossRef CAS.
| This journal is © Institute of Process Engineering of CAS 2024 |


