A potential stibnite reference material for sulfur isotope determination by LA-MC-ICP-MS
Zhi-hui
Dai
 *a,
Shan-ling
Fu
*a,
Yue-fu
Liu
b,
Yu-miao
Meng
a,
Zhi-an
Bao
c,
Ke-jun
Hou
d and
Ting-guang
Lan
a
*a,
Shan-ling
Fu
*a,
Yue-fu
Liu
b,
Yu-miao
Meng
a,
Zhi-an
Bao
c,
Ke-jun
Hou
d and
Ting-guang
Lan
a
aState Key Laboratory of Ore Deposit Geochemistry, Institute of Geochemistry, Chinese Academy of Sciences, Guiyang 550081, China. E-mail: daizhihui@mail.gyig.ac.cn; fushanling@mail.gyig.ac.cn
bSchool of Chemistry and Environmental Engineering, Hanshan Normal University, Chaozhou 521041, China
cState Key Laboratory of Continental Dynamics, Department of Geology, Northwest University, Xi'an 710069, China
dInstitute of Mineral Resources, Chinese Academy of Geological Sciences, Beijing 100037, China
First published on 11th December 2023
Abstract
The identification of metal and sulfur sources in hydrothermal Sb ore deposits has long been recognized as a challenging task. Stibnite is commonly found as one of the primary ore minerals in most antimony deposits, and it can even occur as the sole ore mineral in some large antimony deposits; therefore, the sulfur isotope composition of stibnite often contains invaluable information for exploring the origin and ore-forming processes of Sb deposits. A well-characterized and matrix-matched material is imperative for conducting in situ S isotope microanalysis. However, the lack of standardized materials for stibnite hinders precise determination of sulfur isotope composition, thereby impeding the application of stibnite sulfur isotopes in deciphering the ore genesis of Sb deposits. The present study recommends the utilization of a natural stibnite (BJ-Snt) as a potential reference material for S isotope analysis employing laser ablation multicollector inductively coupled plasma-mass spectrometry (LA-MC-ICP-MS). The sulfur isotope compositions, backscattered electron (BSE) maps, mineral phases, and elemental compositions were analyzed to evaluate the homogeneity of the stibnite BJ-Snt. The method validation was conducted through comparison of S isotope values obtained by LA-MC-ICP-MS and IRMS, as well as intercomparisons with two other laboratories. The consistent findings have established that BJ-Snt is a suitable standard for bracketing in situ S isotope measurement using LA-MC-ICP-MS, and the recommended δ34S value determined by IRMS was −0.71 ± 0.32‰ (2 s, n = 15).
1. Introduction
Antimony is a non-renewable strategic mineral resource and has been designated as a key metal of strategic importance by major countries such as China and the United States.1–3 Stibnite is among the most important Sb-bearing mineral phases in the majority of Sb deposits and it even occur as the exclusive Sb-bearing ore mineral in some large Sb deposits.4–7 Therefore, the geochemistry of stibnite, particularly the sulfur isotopic variations at a sub-grain scale, often harbors valuable information for elucidating the sources of sulfur in hydrothermal fluids and ore-forming processes of Sb deposits.8,9Conventional techniques for obtaining sulfur isotope ratios mainly refer to solution nebulizer multi-collector inductively coupled plasma mass spectrometry (SN-MC-ICP-MS), multi-collector thermal ionization mass spectrometry (MC-TIMS) and gas-source mass spectrometry (GS-MS).10,11,16–21 These methods possess an absolute advantage in achieving higher precision determination of sulfur isotope ratios (∼0.1–0.25‰) compared to other measurements, such as SIMS and ICP-SF-MS. Meanwhile, their characteristics of bulk-rock analysis are destined with the drawback of complex and time-consuming sample preparation, as well as losing the spatial information.12–15 In comparison, laser ablation multi-collector inductively coupled plasma mass spectrometry (LA-MC-ICP-MS) is more valued by geologists due to its superior spatial resolution at the micrometer scale. Additionally, it offers advantages such as low contamination, affordability, high efficiency, and minimal water-related spectral interference.22,23 However, the applications of LA-MC-ICP-MS are significantly limited by matrix effects and fractionation effects arising from variations in the crater depth, signal intensity, aerosol size distribution, vaporization, and ionization of the ablated particles within ICP.24 The accuracy and precision of the analysis are also compromised by isotopic fractionation and spectrum interference. Therefore, numerous efforts have been made to enhance the accuracy and precision of measurements, including simulating isotopic fractionation behavior, mitigating interfering substances, and developing matrix-matched reference materials.25–30 Among them, the inclusion of a matrix-matched reference material is imperative to enhance the accuracy and precision of measurements pertaining to sulfur isotope ratios.
The current certified solid sulfide standards for sulfur isotopes include the IAEA series (Ag2S powder) and NBS123 (ZnS). With the advancement of in situ microanalysis, natural minerals, compressed powder tablets, and artificial solid samples have been utilized as calibrated materials for S isotope analysis in a wide range of sulfide minerals, including pyrite, pentlandite, pyrrhotite, sphalerite, and chalcopyrite.22,24,31–38 The noteworthy point is that IRMS is a more prevalent approach for determining S isotopes in stibnite, owing to its independence of matrix-matched reference materials.39–41 The IAEA series has traditionally been employed as standard materials for in situ S isotope microanalysis.42,43 For example, the sulfur isotope ratios in stibnite from the Xikuangshan Sb deposit were determined using LA-MC-ICP-MS with IAEA-S-1 as the calibrator and the in-house standard Cpy-1/GC as a quality control, as reported by Fu et al. (2020).9 Other materials, such as sphalerite (NBS123), chalcopyrite (Cpy-1) and galena (CBI-3), were also utilized for S isotope analysis of stibnite.44–46
Notably, the presence of matrix effects would induce substantial instrumental mass bias, thereby compromising the accuracy and precision of measurements. For example,22 Chen et al. (2017) proposed that the deviation of δ34S was less than 0.3‰ resulting from Cu and Fe, but increased to 0.7‰ as a result of Zn when the solution contained an equal concentration of matrix elements and sulfur. Therefore, the availability of isotopically homogeneous and well-characterized mineral standards that are matrix-matched is crucial for accurately determining the sulfur ratio using LA-MC-ICP-MS. This study proposes using natural stibnite (BJ-Snt) as a potential standard reference material for determining S isotopes in stibnite through LA-MC-ICP-MS analysis. Extensive data indicate that BJ-Snt exhibits consistent chemical characteristics, including homogenous S isotope compositions, concise mineral phases, and simple element compositions.
2. Experimental methods
2.1 Sample description and preparation
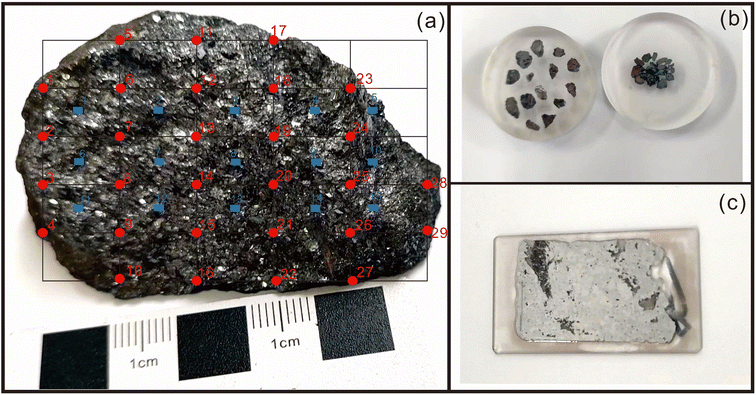
A total of twenty-nine fragments were micro-drilled from the surface of the stibnite hand specimen BJ-Snt for LA-MC-ICP-MS analysis. The micro-drilled positions were distributed on the nodes of the matrix, as depicted in Fig. 1a and b, with a vertical interval of 1 cm and a horizontal interval of 0.6 cm. Furthermore, a total of 15 positions were meticulously chosen for IRMS, ensuring an even distribution across the entire specimen (indicated by the blue boxes in Fig. 1a). Approximately 5 mg of powders from each position was promptly collected and immediately transferred to a clean sample bag. The sampling procedure employed a micro-drill with a diameter of 2.0 mm, specifically excluding the use of quartz and calcite. The drill bit was thoroughly cleansed using dust-free paper and anhydrous ethanol three times prior to drilling each position.
The entire sample was subsequently divided into two equal parts and then affixed onto a thin section (Fig. 1c). The epoxy mounts and the thin section were meticulously polished multiple times until achieving a flat and smooth surface devoid of any discernible scratches.
2.2 Analytical techniques
| LA-ICP-MS at IGCAS | ||
|---|---|---|
| ICP-MS | Agilent 7700x | |
| Forward power | 1400 | W |
| Carrier gas (Ar) | 0.9 | l min−1 |
| Oxide rate (Tho/Th) | <0.3 | % |
| Doubly charged formation rate (Ca2+) | <0.3 | % |
| Plasma condition (U/Th) | 0.95–1.05 | |
![[thin space (1/6-em)]](https://www.rsc.org/images/entities/char_2009.gif) |
||
| Laser ablation | Resolution-LR-S155 | |
| Wavelength | 193 | nm |
| Pulse length | 5–10 | ns |
| Energy density on the sample | 2 | J cm−2 |
| Pulse frequency | 5 | Hz |
| Spot size | 26 | μm |
| Carrier gas (He) | 350 | ml min−1 |
| LA-MC-ICP-MS at IGCAS | ||
|---|---|---|
| MC-ICP-MS | Nu plasma Ш | |
| Forward power | 1400 | W |
| Carrier gas (Ar) | 0.85 | l min−1 |
| Integration time | 0.4 | s per cycle |
| Faraday cup configuration | H6–34S; Ax–33S; L5–32S | |
| Mass resolution | Medium resolution | |
![[thin space (1/6-em)]](https://www.rsc.org/images/entities/char_2009.gif) |
||
| Laser ablation | Resolution-LR-S155 | |
| Wavelength | 193 | nm |
| Pulse length | 5–10 | ns |
| Energy density on the sample | 2 | J cm−2 |
| Pulse frequency | 5 | Hz |
| Spot size | 60 | μm |
| Carrier gas (He) | 200 | ml min−1 |
The pressed powder tablet YS14 was employed to correct instrumental drift and mass bias for S isotope analysis by LA-MC-ICP-MS. The reasons mainly relied on: (1) some studies suggested that pressed powder tablets were perfect as bracketing calibrators;31 (2) the S isotope compositions of YS14 were homogeneous, as determined by IRMS. All of the data were reported relative to (34S/32S)V-CDT. The measured 34S/32S ratios were convenient to convert as a per mil (‰) variation relative to VCDT:
3. Results
3.1 Mineral analysis
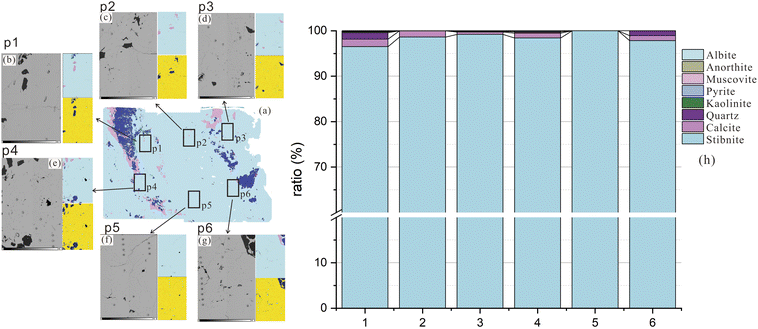
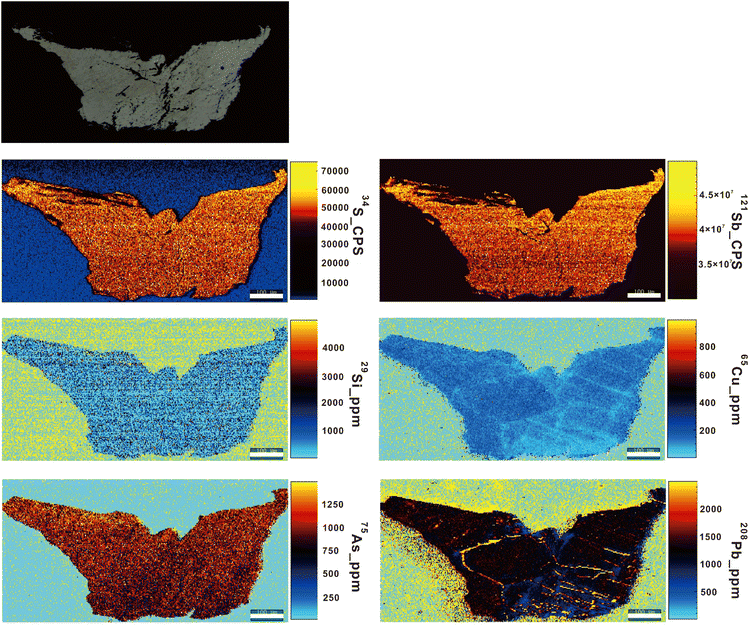
The principal metallic minerals found in the ore bodies of the Baiji deposit include stibnite, zinkenite, sphalerite, and tetrahedrite. Additionally, there are minor occurrences of galena and cinnabar. The gangue minerals present are primarily calcite with minor amounts of quartz and siderite.47 The BJ-Snt sample is predominantly composed of stibnite (87.59%), with minor occurrences of quartz (6.91%), calcite (4.13%), kaolinite (0.61%), pyrite (0.24%), and albite (0.15%) as revealed by the Panoramic BSE and TIMA mineral phases map in Fig. 3. The consistency was demonstrated based on the BSE maps and S distributions observed in the thin section (Fig. 4). The subsequent step involved the random selection of a stibnite particle for quantitative analysis, specifically focusing on mapping and element concentrations (Table 2 and Fig. 5). The results demonstrated that the sample solely consisted of consistent major elements (Sb ranging from 71.20 to 71.53 wt% and S ranging from 28.1 to 28.24 wt%) and hundreds to thousands of ppm for trace elements (Si, Cu, As, and Pb). The difference in optical properties observed in the microscope can potentially be attributed to the presence of Cu and Pb. As a result, the BJ-Snt stibnite exhibits relatively homogeneous chemical compositions.| Sample | S (wt%) | Sb (wt%) | Si (ppm) | Cu (ppm) | As (ppm) | Pb (ppm) |
|---|---|---|---|---|---|---|
| BJ-1 | 28.18 | 71.35 | 908.08 | 364.33 | 701.44 | 1615.82 |
| BJ-2 | 28.14 | 71.23 | 1276.73 | 407.72 | 685.32 | 1559.24 |
| BJ-3 | 28.16 | 71.32 | 957.84 | 449.23 | 989.97 | 1649.44 |
| BJ-4 | 28.16 | 71.31 | 930.55 | 447.67 | 975.80 | 1786.04 |
| BJ-5 | 28.24 | 71.49 | — | 392.23 | 690.27 | 1645.97 |
| BJ-6 | 28.19 | 71.39 | 940.83 | 298.01 | 703.07 | 1216.53 |
| BJ-7 | 28.17 | 71.35 | 698.74 | 279.30 | 735.82 | 1116.50 |
| BJ-8 | 28.24 | 71.53 | — | 327.57 | 751.62 | 1163.64 |
| BJ-9 | 28.21 | 71.46 | — | 444.96 | 1210.78 | 1592.28 |
| BJ-10 | 28.14 | 71.29 | 1176.94 | 396.95 | 1177.87 | 1613.62 |
| BJ-11 | 28.20 | 71.40 | 418.51 | 266.11 | 871.18 | 1881.84 |
| BJ-12 | 28.23 | 71.48 | — | 398.71 | 932.55 | 1614.91 |
| BJ-13 | 28.19 | 71.39 | 861.18 | 304.53 | 732.09 | 1263.63 |
| BJ-14 | 28.19 | 71.38 | 921.39 | 338.69 | 685.50 | 1280.07 |
| BJ-15 | 28.20 | 71.39 | 636.97 | 394.22 | 809.29 | 1541.74 |
| BJ-16 | 28.19 | 71.39 | 717.63 | 341.09 | 773.37 | 1540.37 |
| BJ-17 | 28.21 | 71.48 | — | 240.58 | 1062.64 | 1464.38 |
| BJ-18 | 28.19 | 71.38 | 676.48 | 423.69 | 852.40 | 1581.89 |
| BJ-20 | 28.19 | 71.38 | 721.49 | 423.49 | 821.79 | 1538.62 |
| BJ-21 | 28.13 | 71.26 | 654.61 | 272.31 | 873.40 | 1336.53 |
| BJ-22 | 28.14 | 71.27 | 647.86 | 190.66 | 664.36 | 1371.25 |
| BJ-23 | 28.12 | 71.23 | 654.91 | 312.83 | 944.56 | 1332.43 |
| BJ-24 | 28.11 | 71.21 | 669.52 | 371.88 | 1195.05 | 1354.94 |
| BJ-25 | 28.13 | 71.24 | 671.49 | 298.98 | 690.65 | 1286.70 |
| BJ-26 | 28.12 | 71.21 | 725.58 | 380.00 | 886.34 | 1420.73 |
| BJ-27 | 28.13 | 71.24 | 672.32 | 356.15 | 827.80 | 1370.93 |
| BJ-28 | 28.12 | 71.20 | 714.26 | 409.03 | 955.00 | 1576.76 |
| BJ-29 | 28.14 | 71.26 | 629.53 | 363.12 | 791.93 | 1392.07 |
| BJ-30 | 28.13 | 71.25 | 640.45 | 375.80 | 853.09 | 1364.71 |
| BJ-31 | 28.14 | 71.24 | 649.50 | 419.97 | 747.25 | 1525.58 |
3.2 IRMS measurement
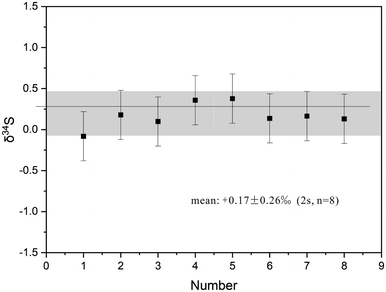
Fifteen stibnite fragments of BJ-Snt were selected and analyzed by IRMS. δ34S values ranged from −1.00‰ to −0.46‰ with a mean of −0.71 ± 0.32‰ (2 s, n = 15). The measured data are given in Fig. 6. The S isotope ratios of IAEA-S-2 and IAEA-S-3 were +22.3 ± 0.24‰ (2 s, n = 8) and −32.3 ± 0.24‰ (2 s, n = 8), respectively, which align perfectly with the published values. The credibility of the value determined by IRMS was ensured when it exhibited consistent S isotope compositions.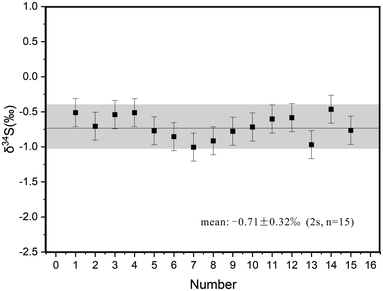 | ||
| Fig. 6 δ34S values of BJ-Snt stibnite determined by IRMS. Error bars are determined by repeated measurements of IAEA reference materials as the unknowns. | ||
3.3 LA-MC-ICP-MS measurement results
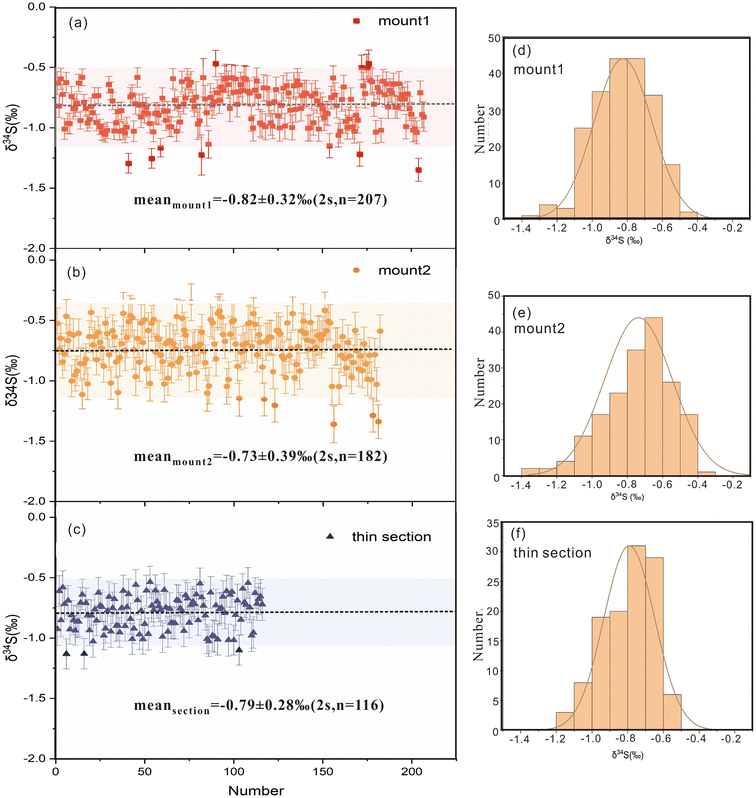
A total of 505 δ34S spot values were obtained using LA-MC-ICP-MS on two epoxy mounts and a thin section to investigate the isotopic homogeneity of S in BJ-Snt (Fig. 7). Among them, 207 and 182 spots were acquired in mount1 and mount2, which yield δ34S values ranging from −1.34‰ to −0.46‰ and −1.36‰ to −0.35‰, with average values of −0.82 ± 0.32‰ and −0.73 ± 0.39‰, respectively (2 s, Fig. 7a and b). Mineral phases would undergo filtration prior to laser ablation. In the thin section, the mean δ34S was −0.79 ± 0.28‰, which was determined from 116 measurements ranging from −1.13‰ to −0.53‰ (Fig. 7c). The values of the dataset followed a Gaussian distribution, resulting in an average value of −0.78 ± 0.34‰ (2 s, n = 505, Fig. 7d–f). This average value was found to be consistent with the values obtained through IRMS (−0.71 ± 0.32‰) within a 2 s analytical uncertainty. Furthermore, the result also demonstrated that the difference resulting from physical characteristics between powder pressed pellets and natural crystals can be ignored, consisted with Chen et al. (2017).22 It means that the in-house stibnite material (YS14) is viable as the bracketing calibrator based on the homogenous S isotope compositions.3.4 Differences caused by different matrices
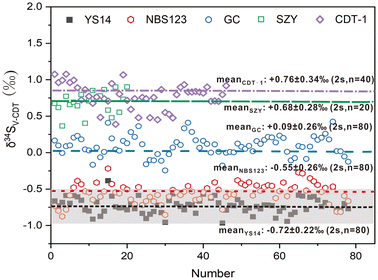
The differences in sulfur isotope microanalysis between the standard and sample may be attributed to variations in the sulfur concentration, chemical composition, and physical structure.22 In this study, the disparities in stibnite sulfur isotopic analysis were assessed through comparisons of various calibration materials, including stibnite (YS14), sphalerite (NBS123), chalcopyrite (GC), pyrite (SZY) and troilite (CDT-1). All adopted standard materials were natural crystals (except for YS14) to exclude the interference of the physical structure. The calibrated object was the S isotope compositions of BJ-Snt, which are listed in Fig. 8 and Table 3. Calibrated using the standard materials YS14, NBS123, GC, and CDT-1 with approximate S concentrations, the mean δ34S values obtained for BJ-Snt were −0.72 ± 0.22‰ (2 s, n = 80), −0.55 ± 0.26‰ (2 s, n = 80), +0.09 ± 0.26‰ (2 s, n = 80), and +0.76 ± 0.34‰ (2 s, n = 40). Notably, the S isotope ratios were approximately 1.40‰ higher when CDT-1 was used as the calibrator. Comparably, NBS123 can be considered as a secondary option for calibrating the S isotopes of stibnite. Additionally, approximate δ34S values were obtained when using SZY and CDT-1 as bracketing calibrators, which corresponded to distinct S contents (53.45 wt% of SZY and 34.47 wt% of CDT-1). As such, the S concentration is evidently not a determining factor for assessing the suitability of the bracketing calibrator. In contrast, the chemical composition is the primary factor that can potentially influence variations in the ablated mass, aerosol size distribution, vaporization, and ionization regions of particles within the ICP. Therefore, it is essential to employ matrix matching materials when conducting S isotope microanalysis of stibnite.| Mineral | Chemical formula | Composition (wt%) | Cell dimensions | δ34SV-CDT (‰) | ||||
|---|---|---|---|---|---|---|---|---|
| S | Sb | Zn | Fe | Cu | ||||
| Stibnite (YS14) | Sb2S3 | 28.32 | 71.68 | a = 11.229 nm, b = 11.31 nm, c = 3.893 nm, Z = 4 | −0.72 ± 0.22 | |||
| Sphalerite (NBS123) | (Zn,Fe)S | 33.06 | 64.06 | 2.88 | a = 5.406 nm, Z = 4 | −0.55 ± 0.26 | ||
| Chalcopyrite (GC) | CuFeS2 | 34.94 | 30.43 | 34.63 | a = 5.28 nm, c = 10.41 nm, Z = 4 | +0.09 ± 0.26 | ||
| Pyrite (SZY) | FeS2 | 53.45 | 46.55 | a = 5.417 nm, Z = 4 | +0.68 ± 0.28 | |||
| Troilite (CDT-1) | FeS | 34.47 | 63.53 | a = 3.452 nm, c = 5.762 nm, Z = 2 | +0.76 ± 0.34 | |||
3.5 Reproducibility of δ34S values
The standard deviation (SD) was commonly employed to quantify the variability of δ34S values. The data acquired in two mounts and a thin section were mathematically summarized, yielding a double-SD of 0.32‰, 0.39‰ and 0.28‰, respectively. These findings indicate a high level of homogeneity in S isotope compositions for the entire sample of stibnite BJ-Snt (Fig. 7). In addition, even when calibrated using different standard materials (Fig. 8), the precision remained excellent, ranging from 0.26‰ to 0.34‰.Intercomparison among participating laboratories is essential to validate the accuracy of our findings. Two stibnite grains were randomly selected and independently analysed at two laboratories. The obtained δ34S values of BJ-Snt were −0.78 ± 0.14‰ (2 s, n = 18, LA-MC-ICP-MS, Nanjing FocuMS Technology Co. Ltd, China) and −0.90 ± 0.16‰ (2 s, n = 19, LA-MC-ICP-MS, State Key Laboratory of Continental Dynamics, Department of Geology, Northwest University), resulting in an optimistic outcome. The external precision (0.14 to 0.16‰) demonstrates the homogeneity of S isotope compositions in the stibnite BJ-Snt, thereby confirming its suitability as a standard calibrator for S isotope analysis using LA-MC-ICP-MS.
4. Applications
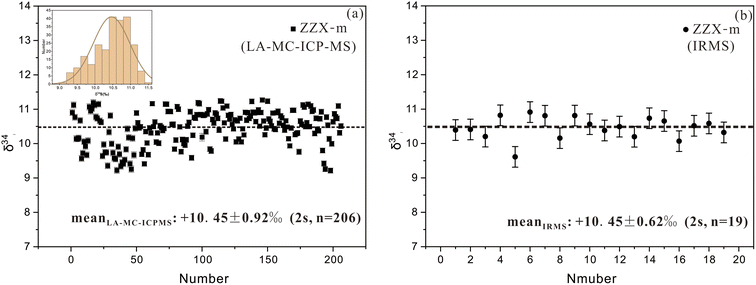
Primary utilization of the stibnite BJ-Snt was conducted in this study. The stibnite crystal, with dimensions of approximately 200 mm length, 150 mm width, and 50 mm height, was extracted from the sample ZZX-1 within the Zhazixi Sb-W deposit located in the central part of the Xuefeng uplift in South China. Antimony orebodies of the Zhazixi deposit are primarily hosted in the tuffaceous slate and tuffaceous sandstone, characterized by a simple mineral assemblage primarily composed of stibnite and quartz, with trace amounts of arsenopyrite. The principal sulfide in the orebodies of the Zhazixi deposit is stibnite, with negligible amounts of other sulfides and sulfates. Therefore, the δ34S values of stibnite can accurately represent the total sulfur content in the ore fluids of this deposit.A random cross section was split and fixed in a thin section for in situ analysis of LA-MC-ICP-MS, and 19 fragments were selected for the analysis by IRMS. BJ-Snt was applied as a bracketing calibrator for the δ34S ratios, matched with the SSB method. The δ34S results analysed in the thin section suggest that the δ34S values were concentrated in a narrow range (+9.22‰ to +11.16‰, Fig. 9a), following a Gaussian distribution with a mean value of +10.45 ± 0.92‰ (2 s, n = 206, Fig. 9c). These values are highly consistent with the approximate value (+10.45 ± 0.62‰, 2 s, n = 19) obtained by IRMS (Fig. 9b). The homogeneous and high δ34S values indicate that the sulfur in ore fluids may have exclusively been derived from a common origin (e.g., neoproterozoic basement) without significant involvement of magmatic sulfur.9,48
We discovered that δ34S values were also consistent on a small scale in the thin section of ZZX-m. To confirm the appearance, the whole specimen was crushed into dozens of fragments, in which 13 fragments were selected randomly for LA-MC-ICP-MS. Calibrated by BJ-Snt, a total of 390 δ34S values in 13 fragments were obtained (Table 4). The standard deviation (SD) concurrently with the mean can be used to accurately estimate the variation in normally distributed data. The range of two standard deviations from the mean is expected to encompass approximately 95% of the observed individuals. Herein the two SDs of δ34S values in 13 fragments are concentrated in the narrow range of 0.33 to 0.49‰, suggesting that the S isotope ratios were also homogeneous in a single crystal. The average value of +10.6‰ was the central tendency for the 13 fragments, which agrees well with that in the thin section. In addition, a few fragments were centered at + 9.8‰ and + 10.2‰. The consistent S isotope composition in the single crystal of the sample ZZX-m makes it a promising reference material that might be employed for quality control and method validation for LA-MC-ICP-MS.
| Average value | 2 SDs | Number | Range | |
|---|---|---|---|---|
| Fragment1 | 9.98 | 0.33 | 30 | 9.59–10.31 |
| Fragment2 | 10.35 | 0.39 | 30 | 10.12–10.81 |
| Fragment3 | 10.63 | 0.33 | 30 | 10.21–10.88 |
| Fragment4 | 10.69 | 0.47 | 30 | 10.01–10.99 |
| Fragment5 | 10.70 | 0.35 | 30 | 10.22–10.95 |
| Fragment6 | 9.73 | 0.41 | 30 | 9.44–10.15 |
| Fragment7 | 10.25 | 0.40 | 30 | 9.82–10.58 |
| Fragment8 | 9.72 | 0.39 | 30 | 9.36–10.08 |
| Fragment9 | 10.56 | 0.47 | 30 | 10.20–10.96 |
| Fragment10 | 10.97 | 0.37 | 30 | 10.44–11.25 |
| Fragment11 | 10.64 | 0.33 | 30 | 10.32–10.97 |
| Fragment12 | 10.52 | 0.42 | 30 | 10.15–11.00 |
| Fragment13 | 9.84 | 0.49 | 30 | 9.36–0.07 |
The method validity of BJ-Snt was confirmed by conducting interlaboratory comparisons on three randomly selected stibnite fragments from ZZX-m. The δ34S values of the samples were initially determined in our laboratory using BJ-Snt as a standard calibrator. Subsequently, the δ34S values were independently measured at three other laboratories using YS14 for calibrations ((1) Nanjing FocuMS Technology Co. Ltd, China, (2) State Key Laboratory of Continental Dynamics, Department of Geology, Northwest University, and (3) Institute of Mineral Resources, Chinese Academy of Geological Sciences). The results of different laboratory analyses using YS14 and BJ-Snt as calibrators are listed in Fig. 10 and Table 5. The highly consistent results of the analysis further clarify that BJ-Snt is a suitable standard reference material for in situ S isotope measurement of LA-MC-ICP-MS.
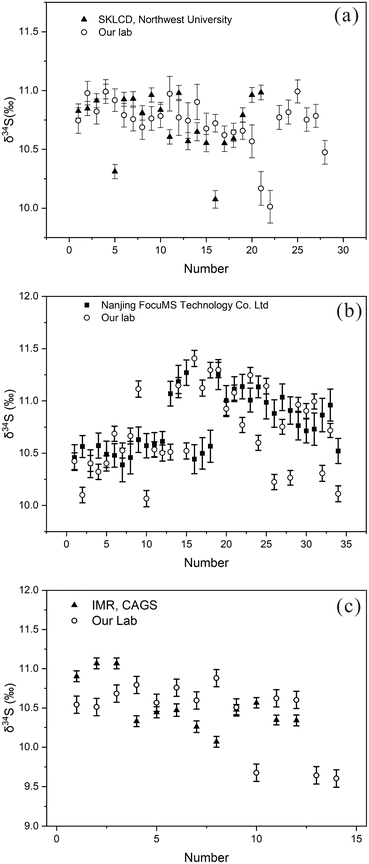 | ||
| Fig. 10 Intercomparison of δ34S values calibrated with YS14 and BJ-Snt in different laboratories for three fragments. (a)–(c) Three stibnite fragments. | ||
| Means (‰) | 2 SDs (‰) | n | Instrument | Calibrator | ||
|---|---|---|---|---|---|---|
| Fragment1 | SKLCD, Northwest University | 10.75 | 0.48 | 21 | Nu 1700 + CompexPro 102 | YS14 |
| Our lab | 10.72 | 0.43 | 28 | Nu plasma Ш+ resolution-LR | BJ-Snt | |
| Fragment2 | Nanjing, FoucuMS | 10.77 | 0.55 | 34 | Nu plasma II + resolution-LR | YS14 |
| Our lab | 10.71 | 0.76 | 34 | Nu plasma Ш + resolution-LR | BJ-Snt | |
| Fragment3 | Institute of mineral resources, CAGS | 10.52 | 0.60 | 12 | Finnigan Neptune + resolution-LR | YS14 |
| Our lab | 10.42 | 0.67 | 14 | Nu plasma Ш + resolution-LR | BJ-Snt |
5. Conclusions
The BJ-Snt hand specimen investigated in this study is composed of concise mineral phases and simple element compositions. A large amount of data demonstrated that the BJ-Snt grain has relatively homogeneous S isotope compositions determined by IRMS and LA-MC-ICP-MS. Hence, the stibnite BJ-Snt is a suitable natural reference material for in situ S isotope measurements of stibnite by LA-MC-ICP-MS. −0.71 ± 0.32‰ (2 s, n = 15) determined by IRMS is the recommended δ34S value for the BJ-Snt stibnite.Author contributions
Zhihui Dai and Shanling Fu: conceptualization, methodology, formal analysis, data curation, writing – original draft, writing-review & editing, and funding acquisition; Yuefu Liu and Yumiao Meng: resources, sample collection and writing-review & editing. Zhian Bao and Kejun Hou: methodology, data curation and writing-review & editing; Tingguang Lan: methodology, supervision, and writing-review & editing.Conflicts of interest
The authors declare that they have no known competing financial interests or personal relationships that could have appeared to influence the work reported in this paper.Acknowledgements
We thank Dr Liang Li for the LA-MC-ICP-MS analysis, Dr Jing Gu for the IRMS analysis, and Chao Wang for the TIMA analysis. This study was financially supported by the projects of the National Key Research and Development Program of China (2023YFC2906801), Natural Science Foundation of China (42273083 and 42077313), Guizhou Provincial 2020 Science and Technology Subsidies (No. GZ2020SIG) and Special Fund of the State Key Laboratory of Ore Deposit Geochemistry (202303).References
- J. Ding, Y. Yang and F. Deng, Geol. China, 2013, 40, 846–858 Search PubMed.
- J. Ding, Y. Zhang, Y. Ma, Y. Wang, J. Zhang and T. Zhang, J. Geochem. Explor., 2021, 230, 1–22 CrossRef.
- Y. Wang, Y. Chen, D. Wang, J. Xu, Z. Chen and T. Liang, Geol. China, 2013, 40, 1366–1378 CAS.
- A. E. WilliamsJones and C. Normand, Econ. Geol. Bull. Soc. Econ. Geol., 1997, 92, 308–324 CrossRef CAS.
- A. Kyono, A. Hayakawa and M. Horiki, Phys. Chem. Miner., 2015, 42, 475–490 CrossRef.
- H. G. Dill, J. South Am. Earth Sci., 2003, 16, 301–320 CrossRef.
- J. T. Peng, R. Z. Hu, J. H. Zhao and Y. Z. Fu, Bull. Mineral., Petrol. Geochem., 2003, 22, 193–196 Search PubMed.
- P. R. Craddock, O. J. Rouxel, L. A. Ball and W. Bach, Chem. Geol., 2008, 253, 102–113 CrossRef.
- S. L. Fu, R. Z. Hu, R. S. Yin, J. Yan, X. F. Mi, Z. C. Song and N. A. Sullivan, Miner. Deposita, 2020, 55, 1353–1364 CrossRef.
- M. Yun, M. A. Wadleigh and A. Pye, Chem. Geol., 2004, 204, 369–376 CrossRef.
- A. Studley, E. M. Ripley, E. R. Elswick, M. J. Dorais, J. Fong, D. Finkelstein and L. M. Pratt, Chem. Geol., 2002, 192, 141–148 CrossRef.
- G. Thode, J. Monster and H. B. Dunford, Geochim. Cosmochim. Acta, 1961, 25, 159–174 CrossRef.
- P. Fritz, R. J. Drimmie and V. K. Nowicki, Anal. Chem., 1974, 46, 164–166 CrossRef.
- B. W. Robinson and M. Kusakabe, Anal. Chem., 1975, 47, 1179–1181 CrossRef.
- H. P. Qi and T. B. Coplen, Chem. Geol., 2003, 199, 183–187 CrossRef.
- A. Imai, N. Shikazono, M. Shimizu and H. Shimazaki, Resour. Geol., 2006, 56, 37–48 CrossRef.
- Z. Y. Long, K. F. Qiu, M. Santosh, H. C. Yu, X. Y. Jiang, L. Q. Zou and D. W. Tang, Geol. Soc. Am. Bull., 2023, 135, 286–294 CrossRef.
- J. L. Mann and W. R. Kelly, Rapid Commun. Mass Spectrom., 2005, 19, 3429–3441 CrossRef.
- R. Clough, P. Evans, T. Catterick and E. H. Evans, Anal. Chem., 2006, 78, 6126–6132 CrossRef.
- F. Albarede and B. Beard, Geochemistry of Non-Traditional Stable Isotopes, ed. C. M. Johnson, B. L. Beard and F. Albarede, 2004, pp. 113–152 Search PubMed.
- A. D. Anbar and O. Rouxel, Annu. Rev. Earth Planet. Sci., 2007, 35, 717–746 CrossRef.
- L. Chen, K. Y. Chen, Z. A. Bao, P. Liang, T. T. Sun and H. L. Yuan, J. Anal. At. Spectrom., 2017, 32, 107–116 RSC.
- Y. Fang, H. M. Yu, L. W. Xie, S. B. Fang, F. Huang and W. Y. Li, J. Anal. At. Spectrom., 2023, 38, 1626–1633 RSC.
- Z. A. Bao, K. Y. Chen, C. L. Zong and H. L. Yuan, J. Anal. At. Spectrom., 2021, 36, 1657–1665 RSC.
- W. Zhang and Z. C. Hu, Spectrochim. Acta, Part B, 2020, 171, 1–15 CrossRef.
- Z. Y. Zhu, S. Y. Jiang, C. L. Ciobanu, T. Yang and N. J. Cook, Chem. Geol., 2017, 450, 223–234 CrossRef.
- D. S. Yang, M. Shimizu, H. Shimazaki, X. H. Li and Q. L. Xie, Resour. Geol., 2006, 56, 385–396 CrossRef.
- T. Ushikubo, K. H. Williford, J. Farquhar, D. T. Johnston, M. J. Van Kranendonk and J. W. Valley, Chem. Geol., 2014, 383, 86–99 CrossRef.
- M. J. Pribil, W. I. Ridley and P. Emsbo, Chem. Geol., 2015, 412, 99–106 CrossRef.
- J. Mikova, J. Kosler and M. Wiedenbeck, J. Anal. At. Spectrom., 2014, 29, 903–914 RSC.
- Z. A. Bao, L. Chen, C. L. Zong, H. L. Yuan, K. Y. Chen and M. N. Dai, Int. J. Mass Spectrom., 2017, 421, 255–262 CrossRef.
- K. Y. Chen, Z. A. Bao, P. Liang, X. Nie, C. L. Zong and H. L. Yuan, Spectrochim. Acta, Part B, 2022, 188, 1–10 CrossRef.
- L. Chen, Y. Liu, Y. Li, Q. L. Li and X. H. Li, J. Anal. At. Spectrom., 2021, 36, 1431–1440 RSC.
- Y. T. Feng, W. Zhang, Z. C. Hu, T. Luo, M. Li, Y. S. Liu, H. Liu and Q. L. Li, J. Anal. At. Spectrom., 2022, 37, 551–562 RSC.
- R. C. Li, X. P. Xia, H. Y. Chen, N. P. Wu, T. P. Zhao, C. Lai, Q. Yang and Y. Q. Zhang, Geostand. Geoanal. Res., 2020, 44, 485–500 CrossRef.
- N. Lv, Z. A. Bao, K. Y. Chen, C. L. Zong, Y. Zhang and H. L. Yuan, Geostand. Geoanal. Res., 2022, 46, 451–463 CrossRef.
- X. Nie, Z. A. Bao, C. L. Zong, N. Lv, K. Y. Chen and H. L. Yuan, J. Anal. At. Spectrom., 2023, 38, 1065–1075 RSC.
- Z. K. Zhou, H. Li, Y. Kotaro, A. Imai and T. Tindell, J. Geochem. Explor., 2023, 247, 107–177 CrossRef.
- J. Chen, R. D. Yang, J. B. Gao, L. L. Zheng, L. J. Du, M. G. Yuan and H. R. Wei, Acta Geochim., 2017, 36, 339–352 CrossRef CAS.
- A. Zhaanbaeva, K. Peng, A. Oyebamiji and K. Asilbekov, Acta Geochim., 2021, 40, 659–675 CrossRef CAS.
- Z. Y. Song, Y. C. Yang, S. J. Han, B. Y. Li, Z. J. Zeng and T. W. Chen, J. Geochem. Explor., 2023, 249, 107–217 CrossRef.
- S. L. Fu, T. X. Wang, J. Yan, L. C. Pan, L. M. Wei, Q. Lan and S. Y. Fu, Ore Geol. Rev., 2022, 146, 104949 CrossRef.
- X. F. Song, J. Q. Lai, J. W. Xu, X. H. Liu, B. Li, H. S. He, Y. H. Wang, J. Shi, C. Wang and C. Wen, J. Geochem. Explor., 2022, 12, 1407 CAS.
- J. Chen, Z. L. Huang, R. D. Yang, L. J. Du and M. Y. Liao, Geosci. Front., 2021, 12, 605–623 CrossRef CAS.
- J. Chen, X. R. Ni, L. J. Du, J. B. Gao, Z. F. Yang, L. L. Liu, Y. B. Ji and R. D. Yang, Ore Geol. Rev., 2023, 156, 105397 CrossRef.
- Z. Y. Zhang, G. Q. Xie and P. Olin, Ore Geol. Rev., 2022, 143, 104781 CrossRef.
- Y. F. Liu, H. W. Qi, X. W. Bi, R. Z. Hu, L. K. Qi, R. S. Yin and Y. Y. Tang, Ore Geol. Rev., 2021, 131, 104016 CrossRef.
- G. P. Zeng, Y. J. Gong, Z. F. Wang, X. L. Hu and S. F. Xiong, J. Geochem. Explor., 2017, 182, 10–21 CrossRef CAS.
- L. Danyushevsky, P. Robinson, G. Sarah, M. Norman, L. Ross, P. McGoldrick and S. Michael, Geochem.: Explor., Environ., Anal., 2011, 11, 51–60 CrossRef CAS.
- C. E. McEwing, C. E. Rees and H. G. Thode, Meteoritics, 1983, 3, 171–178 CrossRef.
- M. A. Millet, J. A. Baker and C. E. Payne, J. Geochem. Explor., 2017, 182, 10–21 CrossRef.
- Y. S. Liu, Z. C. Hu, S. Gao, D. Guenther, J. Xu, C. G. Gao and H. H. Chen, Chem. Geol., 2008, 257, 34–43 CrossRef CAS.
- M. H. He, S. D. Zhang, L. Zhang, F. Yang, Y. Q. Zhang, X. L. Huang and G. J. Wei, Am. Mineral., 2022, 107, 432–442 CrossRef.
| This journal is © The Royal Society of Chemistry 2024 |

