 Open Access Article
Fundamental studies of laser ablation ICPMS using a nitrogen plasma source and helium, argon and nitrogen as carrier gas†
Dylan
Käser
 a,
Ralf
Kägi
 b,
Bodo
Hattendorf
 a and
Detlef
Günther
 *a
*a
aLaboratory of Inorganic Chemistry, Department of Chemistry and Applied Biosciences, ETH Zürich, Vladimir-Prelog-Weg 1, 8093 Zurich, Switzerland. E-mail: guenther@inorg.chem.ethz.ch
bEawag, Department of Process Engineering, Überlandstrasse 133, 8600 Dübendorf, Switzerland
First published on 26th October 2024
Abstract
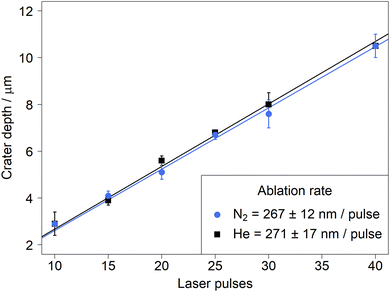
Laser-generated aerosols in helium, argon and nitrogen were directly compared using a nitrogen microwave inductively coupled plasma in combination with a mass spectrometer. An increased surface darkening of the sample was observed during ablation in nitrogen, suggesting a more pronounced particle deposition in comparison to helium, but only 30% lower sensitivities were obtained for nitrogen. Crater depth measurements proved that these variations were not the consequence of a difference in ablation rate (271 ± 17 nm per pulse for He vs. 267 ± 12 nm per pulse for N2). Particle size measurements and electron microscopy images indicated that the aerosol generated in nitrogen or argon tends to form smaller agglomerates in comparison to helium. This dependence in agglomeration however appeared to be dependent on the ablation cell used. Furthermore, the fluence of the 193 nm laser system used for the experiments significantly influenced the temporal stability of the signals (e.g.238U+/232Th+). Finally, the quantification capabilities of nitrogen as an ablation environment and carrier gas were studied and compared to helium generated aerosols transported in nitrogen. A selection of samples (NIST SRM 612, USGS BCR-2G, USGS GSD-1G and GSE-1G) were quantified using NIST SRM 610 as an external standard. The potential of nitrogen as an alternative carrier gas was highlighted with deviations from the reference values calculated between −13% and +16% in comparison to the deviations between −15% and +17% obtained with helium in a cylindrical ablation cell for most elements in the different reference materials analyzed.
Introduction
Laser ablation (LA) for direct solid sampling coupled to an inductively coupled plasma mass spectrometer (ICPMS) was introduced decades ago.1 During this period, the method has been established for a wide range of applications such as quantitative mineral analysis in geology,2–5 high-resolution material characterization in materials sciences6 and various tissue analyses in biomedicine.7 Over the years, different key aspects related to the most suitable experimental conditions have been characterized starting with the wavelength of the laser source8–14 as well as its pulse duration.15–20 These fundamental studies were focused on the fractionation effects related to the ablation process. In addition, some improvements in transport efficiency have been achieved by changing the ablation environment from argon to helium in combination with an ArF excimer laser with a wavelength of 193 nm.21 The increase in sensitivity observed in helium was explained by the decrease of material deposited in the vicinity of the crater and smaller aerosol particles and agglomerates, which can be vaporized, atomized and ionized more efficiently when compared to argon and thereby improving the limits of detection (LODs) in direct solid analysis by ICPMS.22Besides many successful applications using LA-ICPMS, research related to an alternative plasma source has been ongoing since the beginning of ICP mass spectrometry.23 Already in 1987, a nitrogen plasma source was proposed for elemental analysis to allow more freedom from argon-based interferences and reduce the operating costs.24 Despite the simplicity of this design and lower cost related to its operation, the limited power led to performances below those achieved using an argon ICP. A few years later, Okamoto and co-workers achieved similar performances as the argon ICPs using a high-power atmospheric pressure nitrogen microwave-induced plasma mass spectrometer (N2 MIPMS).25 Later designs of a nitrogen plasma were proposed for optical emission spectroscopy such as the Hammer cavity26 and the Microwave Inductively Coupled Atmospheric-Pressure Plasma (MICAP).27,28 Given the compatibility of the latest design with a conventional ICPMS interface, a comparative study between the N2-MICAP and a conventional Ar-ICP ion source was performed on the same mass spectrometer prototype.29 Not only similar LODs and sensitivities were obtained but avoiding argon-based interferences also enabled the access to some isotopes difficult to measure with an ICPMS without MS/MS capabilities such as 75As+ mainly due to the absence of 40Ar35Cl+ interference among others. However, the nitrogen plasma gas also forms some interferences mainly below mass-to-charge (m/z) 60 which have been described previously.29
The recently reported combination of LA with the N2-MICAPMS and the similar figures of merit reported for this instrumental configuration in comparison to an argon ICPMS30 stimulated the interest to investigate the new capabilities of a nitrogen plasma. The vast majority of the experiments reported in the last 3 decades have been conducted under argon and later, dominantly using helium as ablation environment.21,22,31 However, the nitrogen plasma allows the introduction of helium, argon and air at higher flow rates than commonly used as mixed gas additions.27 This wider tolerance towards gas mixtures opens extended possibilities to investigate different ablation environments with respect to particle formation, particle size distribution (PSD) and deposition on the sample surface as well as transport efficiency and particle vaporization within the nitrogen plasma source based on the measured sensitivities. The influence of the carrier gas on the laser-generated aerosol has been studied in the past but this was limited to argon and mixtures of argon and helium, and argon and neon, respectively.32 The gas environment in combination with the laser wavelength were found to be responsible for the PSD and the sensitivity observed in the ICPMS.33 The use of wavelengths above 213 nm was correlated with more pronounced matrix effects (depending on the material of interest) mainly caused by the lower absorption behavior, favoring the generation of larger particles in comparison to 193 nm lasers. Therefore, the present study is focusing on nitrogen as ablation environment, carrier gas and plasma gas. Previous studies related to the PSD and structure of the laser-induced aerosols formed in distinct ablation environments33 were extended by studying nitrogen as a potential alternative for aerosol carrier in combination with nitrogen plasmas such as the MICAP design. In this study, results obtained using helium were used as benchmarks in comparison to nitrogen and argon as carrier gases. The characteristics of the three gas environments were evaluated in detail with respect to transient signals, sensitivities, LODs, mass removal measurements as well as PSDs and transmission electron microscopy (TEM) images of aerosols collected using electrostatic precipitation. To demonstrate the capabilities of nitrogen as carrier gas, commonly used reference materials, mainly NIST SRM 610 and NIST SRM 612, were used for all experiments reported here. In addition, quantitative results were acquired for basalt glasses namely USGS BCR-2G, USGS GSD-1G and USGS GSE-1G.
Experimental
Instrumentation
Laser ablation for PSD and MS experiments was conducted with a homogenized laser beam generated by an argon-fluoride (ArF) excimer laser system (193 nm, GeoLas C, Lambda Physik, Germany). A similar excimer laser system (193 nm, GeoLas Q, Lambda Physik, Germany) was used for the collection of the aerosol particles on filters. For the MICAPMS experiments, the laser-generated aerosol was directly introduced into a prototype instrument consisting of a MICAP (Radom Corporation™, USA) plasma source coupled to the interface and mass analyzer of a commercial ELAN 6100 DRCplus (PerkinElmer SCIEX, USA) ICPMS equipped with an inhouse machined aluminum sampler cone. Laser light scattering was used for the PSD measurements using the UHSAS optical particle counter (OPC) (Droplet Measurement Technologies, USA). It should be noted that the OPC data represents the scattering intensity of spheres of equivalent size, which are not generally present in laser-generated aerosols due to agglomeration. Because of this, OPC data were considered qualitative rather than their absolute numbers. Microscopy measurements for depth profiling were conducted at the ScopeM facility of the ETH Zurich using a LSM 780 confocal microscope (Zeiss, Germany) and an Aberration Corrected Scanning Transmission Electron Microscope (STEM) HD-2700 (Hitachi High-Technologies Corporation, Japan) was used for the particle imaging to complement the OPC's measurements. The particle sampling was performed via electrostatic deposition using the partectorTEM aerosol dosimeter (Naneos Particle Solution GmbH, Switzerland) designed for the sampling of airborne particles on TEM grids. In this case 3.05 mm Cu 200 grids with Formvar®/carbon films (Quantifoil Micro Tools GmbH, Germany) were used. A liquid N2 Dewar (>99.99%, PanGas AG, Switzerland) was used to supply the nitrogen used to sustain the plasma and as carrier gas for the LA experiment. Other ablation environments were helium (99.999%, PanGas AG, Switzerland) and argon (99.999%, PanGas AG, Switzerland). Due to the difference in thermal conductivity, the gas flow settings of the mass flow controllers were calibrated against a bubble flowmeter (Fisher Bioblock Scientific, France). The majority of the experiments were conducted using a cylindrical ablation cell with a volume of 30 cm3 and equipped with a jet nozzle inlet as previously described.17 Additionally, experiments were compared to those obtained using the modified parallel flow ablation cell (MPFAC).34 The latter is a two-volume ablation cell with an effective aerosol expansion volume of approximately 0.1 cm3, designed for low dispersion laser ablation for greater spot sizes up to 90 μm.34Samples
The performance achieved for the different carrier gases was evaluated using the glass reference materials NIST SRM 610, NIST SRM 612, USGS GSD-1G, USGS GSE-1G and USGS BCR-2G. The reference mass fractions were obtained from the preferred values available on the GeoReM database.35,36 The transient signals were recorded for more than two minutes, including 60 s of background, 60 s of signal and the washout to avoid signal overlapping. Parameter optimization was performed daily while ablating NIST SRM 610 to achieve maximum signal for 238U+ while keeping the 238U+/232Th+ intensity ratio at 1.0 and a 232Th16O+/232Th+ rate lower than 0.5%. The detailed operating conditions, including the range for the gas flows used for the different carrier gases can be found in Table 1.| a The fluence was varied for the different experiments as specified in the text. b Optimized on a daily basis. | |
|---|---|
| Laser ablation | |
| Wavelength | 193 nm |
| Fluencea | 5–30 J cm−2 |
| Laser frequency | 10 Hz |
| Spot size | 90 μm |
| Ablation mode | Hole drilling |
| Ablation cells | Cylindrical17 & MPFAC34 |
![[thin space (1/6-em)]](https://www.rsc.org/images/entities/char_2009.gif) |
|
| MICAPMS | |
| Plasma power | 1450 W |
| Sampler cone (Al) | 1.1 mm |
| Skimmer cone (Al) | 0.8 mm |
| Make-up gas flow rate (N2)b | 0.7–1.0 L min−1 |
| Carrier gas flow rate (N2)b | 0.6–0.7 L min−1 |
| Carrier gas flow rate (He)b | 0.8–1.0 L min−1 |
| Carrier gas flow rate (Ar)b | 0.6–0.9 L min−1 |
Data evaluation
All the data processing was performed using in-house written scripts for R.37,38 The results of the quantification experiments were obtained according to the established protocol39 using 40Ca+ as internal standard apart from measurements performed with argon where 44Ca+ was used. 42Ca+ was not used because of the intense 14N3+ background signal. Despite the presence of 14N216O+, 44Ca+ was preferred to 42Ca+ and 43Ca+ due to its higher isotopic abundance and lower background signal intensity. The signals considered for the quantification were 50 seconds long after a delay of 10 seconds from the beginning of the ablation. The background was measured for 60 seconds and integrated from the start of the measurement until 5 seconds before the detection of the first laser-generated signal.Results and discussion
Observations during ablation in nitrogen
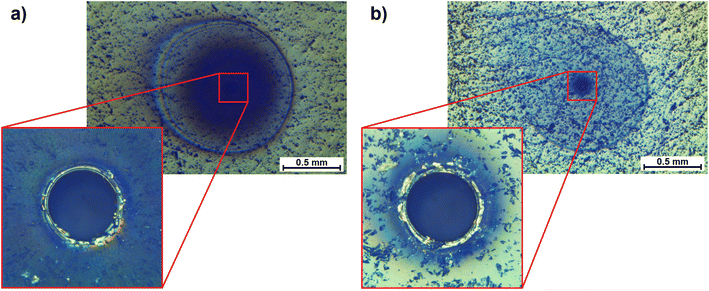
The first immediate observation during ablation in nitrogen was the rapid surface darkening during single spot analyses (Fig. 1a). The overview of the crater indicates different areas affected the surroundings of the ablation spot. A dark circular zone was observed with a radius of approximately 0.4 mm, followed by a lighter region and terminated by a sharper ring at ca. 0.6 mm from the center. The comparison to a crater formed by the same laser settings in helium showed a similarly wide outer rim but a comparably dark region was only observed within some tens of micrometers near the crater rim (Fig. 1b). For both gases, the circular shape of the outer pattern was partly distorted towards the direction of the carrier gas flow.This seemed to resemble the observations made previously, when changing the ablation environment from argon to helium, where a much darker and larger area was affected in argon.21 Increased deposition in argon compared to helium was also described in a similar study and the higher signal intensities measured in helium (up to a factor of 3) in comparison to argon were ascribed to improved aerosol transport.22
Analytical figures of merit
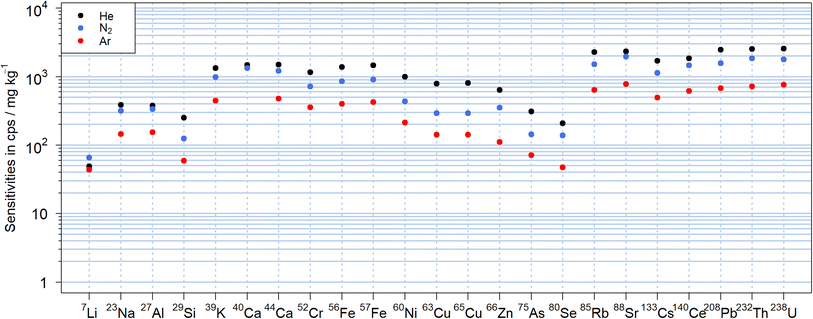
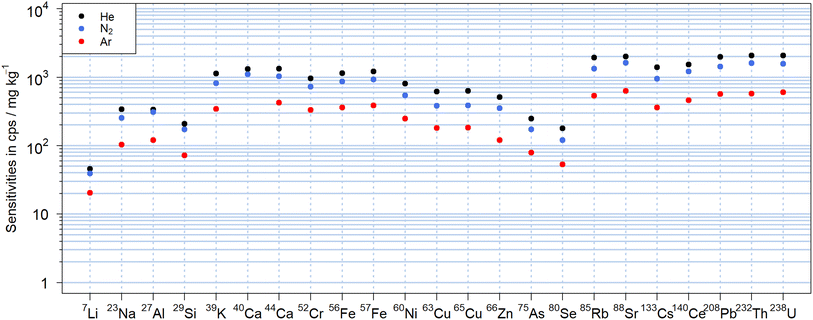
The N2-MICAPMS allows the use of different carrier gases and thus comparing figures of merit including their sensitivities as illustrated in Fig. 2 for NIST SRM 610. The abundance normalized sensitivities obtained with nitrogen were between −64% and +34% compared to those using helium as carrier gas. In particular, the sensitivity of lighter isotopes as 7Li+ appeared suppressed to a lesser extent, which may indicate a reduction in the magnitude of mass discrimination. However, the sensitivities of several elements with isotopes of similar m/z showed significant differences between helium and nitrogen and cannot be explained at this stage. For instance, sensitivity of 85Rb+ was 33% lower in nitrogen than when using helium as carrier gas, while 88Sr+ was only 16% lower. Similar trends were also observed between 65Cu+ (63% lower signal in N2) and 66Zn+ (44%) or between 133Cs+ (33%) and 140Ce+ (21%). The lowest sensitivities were obtained in argon, where sensitivities were lower by up to a factor of 5 compared to helium but also with an apparently reduced mass discrimination for 7Li+. When using argon as carrier gas, the background signal at m/z 40 was getting too high (>5 × 10⁷ cps for Ar vs. < 3 × 10⁵ cps for N2) to make use of 40Ca+ for analysis.The LODs can be found in Fig. S1† and were calculated according to Longerich et al.39 from the sensitivities displayed in Fig. 2. There was no substantial difference from the trends observed with the sensitivities with He typically leading to lower values due to the higher sensitivities. For high m/z isotopes with low instrumental background signals, the LODs were in the single digit μg kg−1 range, while most isotopes showed LODs in a range between 0.1 and 10 mg kg−1 for a 90 μm crater diameter and a fluence of 19 J cm−2. Only for 29Si+, due to the high background signals caused by 14N15N+, the LOD was almost 0.1% wt. In this case, an increase in the background signals up to a factor of three was observed when He was used in comparison to N2, leading to about twofold higher LODs for 29Si+. The background signal on 56Fe+, caused by the 14N4+ molecular ion, was observed with all carrier gases but most prominent when using helium. For these experiments, nitride species were also observed in the nitrogen plasma and the formation rate for example for 232Th14N+/232Th+ was found to be between 0.15% and 0.21% in N2, between 0.20% and 0.22% in He and between 0.09% and 0.18% in Ar respectively. These values were higher than the respective 232Th16O+/232Th+ intensity ratio of 0.06–0.09% in N2, 0.05–0.08% in He and 0.06–0.08% in Ar. It should also be noted that unassigned signals were previously observed at m/z 80, 82, 108 and 110 using a dry nitrogen plasma source.30 These peaks were reduced to the instrumental background by changing the sampler and skimmer cone material from platinum to aluminum. Given the widespread use of platinum in catalysis,40 the origin of the ions detected might be related to a chemical reaction involving the plasma species and the Pt-cone surface. Alternatively, the lower thermal conductivity of platinum leads to higher temperatures on the cones' surfaces41 and thermal processes also need to be considered. Nickel cones supported these hypotheses as they showed a similar reduction of these unassigned signals. The nickel skimmer cone was found unsuitable in these experiments as a deep blue coloration was observed (Fig. S2†). More importantly, an increase in 60Ni+ background signal and a widening of the cone orifice occurred. These effects were strongest when helium was used as carrier gas. The sampler cone orifice, on the other hand, did not show visual degradation. A previous evaluation study on a nitrogen plasma source already indicated 15 times higher LODs for nickel in solutions when using a nickel skimmer cone,42 suggesting erosion of the skimmer cone by the nitrogen plasma for wet and dry conditions.
Quantification capabilities in nitrogen and comparison to helium and argon
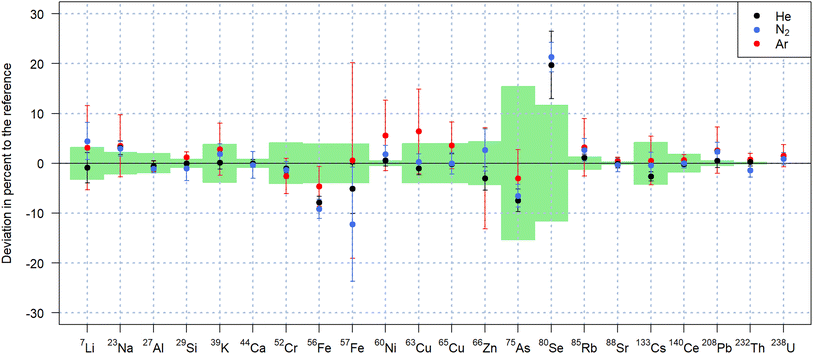
As previously reported,29 replacing an argon-based plasma source by one operating with nitrogen, mitigates argon-based interferences such as 40Ar+, 40Ar16O+, 40Ar2+, facilitating access to the most abundant isotopes 40Ca+, 56Fe+ and 80Se+ of the respective elements. However, the nitrogen plasma source leads to the formation of nitrogen-based molecular ions, affecting the determination of element isotopes due to N+ and N2+, NO+, NOH+, N3+ and N4+. These molecular ions affect the detection of Si, P, and Fe in particular, while Ca may be affected by N3+, N2O+ and NO2+. Argon impurities in the nitrogen supply additionally affect the attainable LODs for 40Ca+. For the quantification of the samples analyzed in this study, 40Ca+ was thus used as internal standard when nitrogen and helium were used as carrier gases and compared to 44Ca+ quantification when argon was used as carrier gas.The quantification results for NIST SRM 612 using NIST SRM 610 as matrix-matched calibration standard and presented in Fig. 3, showed comparable accuracy using all three carrier gases. Using nitrogen as carrier gas, 17 out of 20 elements were quantified within one standard deviation of the preferred values according to the GeoRem database.35,36 The values obtained for 75As+ and 56Fe+ were found to be approximately 8% lower than the reference both for helium and nitrogen. In the same experiments, 80Se+ was found 20% above the reference, which is, however consistent with previous experiments using helium as carrier gas with the N2-MICAP in our laboratory.30
For the measurements performed with argon, 80Se+ was below the LOD due to the high 40Ar2+ background. In addition to the lower sensitivities,21 ablation in argon led to additional argon-based interferences. The more pronounced offset of 63Cu+ for instance (Fig. 3) is considered to be caused by the 40Ar23Na+ molecular ion and the higher ratio of Na/Cu mass fraction in NIST SRM 612. The basalt glass reference materials were also quantified with similar results in nitrogen and in helium as listed in Table 2 for USGS BCR-2G and USGS GSD-1G. Quantification results of USGS GSE-1G can be found in Table S1 of the ESI† and also indicate that comparable accuracies were achieved with both N2 and He. Smaller deviations from the reference values were observed with helium and nitrogen for USGS GSD-1G in comparison to USGS GSE-1G despite the latter having mass fractions closer to those of the calibration standard. This fact, combined with the higher uncertainties of the reference values for USGS GSE-1G, seems to indicate that the sample is not as homogeneous as USGS GSD-1G.36
| USGS BCR-2G | USGS GSD-1G | |||||||||||||||
|---|---|---|---|---|---|---|---|---|---|---|---|---|---|---|---|---|
| Nitrogen | Helium | Nitrogen | Helium | |||||||||||||
| Ref. | SD | Meas | SD | Dev | Meas | SD | Dev | Ref. | SD | Meas | SD | Dev | Meas | SD | Dev | |
| 7Li | 9 | 1 | 10.3 | 1.4 | 14 | 7.7 | 0.8 | −15 | 43 | 6 | 47.6 | 1.6 | 11 | 44.3 | 2.2 | 3 |
| 23Na | 23![[thin space (1/6-em)]](https://www.rsc.org/images/entities/char_2009.gif) 965 965 |
519 | 24![[thin space (1/6-em)]](https://www.rsc.org/images/entities/char_2009.gif) 500 500 |
700 | 2.4 | 23![[thin space (1/6-em)]](https://www.rsc.org/images/entities/char_2009.gif) 796 796 |
800 | −0.7 | 26![[thin space (1/6-em)]](https://www.rsc.org/images/entities/char_2009.gif) 710 710 |
1![[thin space (1/6-em)]](https://www.rsc.org/images/entities/char_2009.gif) 484 484 |
27![[thin space (1/6-em)]](https://www.rsc.org/images/entities/char_2009.gif) 200 200 |
290 | 1.9 | 27![[thin space (1/6-em)]](https://www.rsc.org/images/entities/char_2009.gif) 240 240 |
110 | 2.0 |
| 27Al | 70![[thin space (1/6-em)]](https://www.rsc.org/images/entities/char_2009.gif) 941 941 |
2![[thin space (1/6-em)]](https://www.rsc.org/images/entities/char_2009.gif) 118 118 |
78![[thin space (1/6-em)]](https://www.rsc.org/images/entities/char_2009.gif) 200 200 |
700 | 10 | 71![[thin space (1/6-em)]](https://www.rsc.org/images/entities/char_2009.gif) 490 490 |
1![[thin space (1/6-em)]](https://www.rsc.org/images/entities/char_2009.gif) 100 100 |
0.8 | 70![[thin space (1/6-em)]](https://www.rsc.org/images/entities/char_2009.gif) 941 941 |
1![[thin space (1/6-em)]](https://www.rsc.org/images/entities/char_2009.gif) 588 588 |
79![[thin space (1/6-em)]](https://www.rsc.org/images/entities/char_2009.gif) 220 220 |
290 | 12 | 73![[thin space (1/6-em)]](https://www.rsc.org/images/entities/char_2009.gif) 230 230 |
170 | 3 |
| 29Si | 253![[thin space (1/6-em)]](https://www.rsc.org/images/entities/char_2009.gif) 867 867 |
1![[thin space (1/6-em)]](https://www.rsc.org/images/entities/char_2009.gif) 867 867 |
260![[thin space (1/6-em)]](https://www.rsc.org/images/entities/char_2009.gif) 800 800 |
1![[thin space (1/6-em)]](https://www.rsc.org/images/entities/char_2009.gif) 700 700 |
2.7 | 280![[thin space (1/6-em)]](https://www.rsc.org/images/entities/char_2009.gif) 000 000 |
13![[thin space (1/6-em)]](https://www.rsc.org/images/entities/char_2009.gif) 000 000 |
10 | 248![[thin space (1/6-em)]](https://www.rsc.org/images/entities/char_2009.gif) 267 267 |
3![[thin space (1/6-em)]](https://www.rsc.org/images/entities/char_2009.gif) 733 733 |
259![[thin space (1/6-em)]](https://www.rsc.org/images/entities/char_2009.gif) 700 700 |
2300 | 5 | 270![[thin space (1/6-em)]](https://www.rsc.org/images/entities/char_2009.gif) 000 000 |
2![[thin space (1/6-em)]](https://www.rsc.org/images/entities/char_2009.gif) 200 200 |
9 |
| 39K | 14![[thin space (1/6-em)]](https://www.rsc.org/images/entities/char_2009.gif) 438 438 |
332 | 16![[thin space (1/6-em)]](https://www.rsc.org/images/entities/char_2009.gif) 800 800 |
300 | 16 | 16![[thin space (1/6-em)]](https://www.rsc.org/images/entities/char_2009.gif) 800 800 |
400 | 16 | 24![[thin space (1/6-em)]](https://www.rsc.org/images/entities/char_2009.gif) 894 894 |
830 | 28![[thin space (1/6-em)]](https://www.rsc.org/images/entities/char_2009.gif) 070 070 |
290 | 13 | 28![[thin space (1/6-em)]](https://www.rsc.org/images/entities/char_2009.gif) 590 590 |
90 | 15 |
| 40Ca | 50![[thin space (1/6-em)]](https://www.rsc.org/images/entities/char_2009.gif) 429 429 |
786 | IS | IS | 51![[thin space (1/6-em)]](https://www.rsc.org/images/entities/char_2009.gif) 429 429 |
714 | IS | IS | ||||||||
| 44Ca | 50![[thin space (1/6-em)]](https://www.rsc.org/images/entities/char_2009.gif) 429 429 |
786 | 48![[thin space (1/6-em)]](https://www.rsc.org/images/entities/char_2009.gif) 600 600 |
300 | −4 | 47800 | 600 | −5 | 51![[thin space (1/6-em)]](https://www.rsc.org/images/entities/char_2009.gif) 429 429 |
714 | 49![[thin space (1/6-em)]](https://www.rsc.org/images/entities/char_2009.gif) 800 800 |
400 | −3 | 48900 | 400 | −5 |
| 52Cr | 17 | 2 | 15.86 | 0.13 | −7 | 15.5 | 0.27 | −9 | 42 | 3 | 43.9 | 0.4 | 4 | 43.1 | 0.4 | 2.7 |
| 56Fe | 96![[thin space (1/6-em)]](https://www.rsc.org/images/entities/char_2009.gif) 368 368 |
2![[thin space (1/6-em)]](https://www.rsc.org/images/entities/char_2009.gif) 331 331 |
103![[thin space (1/6-em)]](https://www.rsc.org/images/entities/char_2009.gif) 300 300 |
1![[thin space (1/6-em)]](https://www.rsc.org/images/entities/char_2009.gif) 400 400 |
7 | 101![[thin space (1/6-em)]](https://www.rsc.org/images/entities/char_2009.gif) 800 800 |
900 | 6 | 103![[thin space (1/6-em)]](https://www.rsc.org/images/entities/char_2009.gif) 362 362 |
777 | 107![[thin space (1/6-em)]](https://www.rsc.org/images/entities/char_2009.gif) 300 300 |
800 | 4 | 107![[thin space (1/6-em)]](https://www.rsc.org/images/entities/char_2009.gif) 000 000 |
500 | 4 |
| 57Fe | 96![[thin space (1/6-em)]](https://www.rsc.org/images/entities/char_2009.gif) 368 368 |
2![[thin space (1/6-em)]](https://www.rsc.org/images/entities/char_2009.gif) 331 331 |
100![[thin space (1/6-em)]](https://www.rsc.org/images/entities/char_2009.gif) 000 000 |
800 | 4 | 98![[thin space (1/6-em)]](https://www.rsc.org/images/entities/char_2009.gif) 100 100 |
800 | 1.8 | 103![[thin space (1/6-em)]](https://www.rsc.org/images/entities/char_2009.gif) 362 362 |
777 | 104![[thin space (1/6-em)]](https://www.rsc.org/images/entities/char_2009.gif) 600 600 |
900 | 1.2 | 102![[thin space (1/6-em)]](https://www.rsc.org/images/entities/char_2009.gif) 700 700 |
400 | −0.6 |
| 60Ni | 13 | 2 | 14.0 | 0.6 | 8 | 13.3 | 0.5 | 3 | 58 | 4 | 62.1 | 0.5 | 7 | 61.1 | 1.1 | 5 |
| 63Cu | 21 | 5 | 19.18 | 0.21 | −9 | 18.5 | 0.6 | −12 | 42 | 2 | 44.01 | 0.09 | 5 | 42.07 | 0.09 | 0.18 |
| 65Cu | 21 | 5 | 18.21 | 0.09 | −13 | 18.4 | 0.6 | −12 | 42 | 2 | 42.4 | 0.4 | 0.9 | 42.1 | 1.6 | 0.25 |
| 66Zn | 125 | 5 | 122 | 3 | −2.5 | 143 | 3 | 14 | 54 | 2 | 47.7 | 1.5 | −12 | 51.4 | 0.9 | −5 |
| 75As | NA | 1.21 | 0.16 | 1.0 | 0.3 | 27 | 8 | 36.5 | 1.8 | 35 | 35.59 | 0.27 | 30 | |||
| 80Se | NA | < 0.6 | < 0.3 | 2 | 1 | < 0.6 | < 0.3 | |||||||||
| 85Rb | 47 | 0.5 | 50.7 | 0.8 | 8 | 49.7 | 1.3 | 6 | 37.3 | 0.4 | 40.0 | 0.7 | 7 | 38.8 | 0.4 | 4 |
| 60Sr | 342 | 4 | 344.4 | 2.1 | 0.7 | 339.2 | 2.6 | −0.8 | 69.4 | 0.7 | 72.13 | 0.07 | 4 | 69.8 | 0.5 | 1 |
| 133Cs | 1.16 | 0.07 | 1.13 | 0.10 | −2.9 | 1.20 | 0.15 | 4 | 32 | 2 | 32.5 | 0.4 | 1.5 | 31.0 | 0.4 | −3 |
| 140Ce | 53.3 | 0.5 | 55.29 | 0.11 | 4 | 52.2 | 0.3 | −2.1 | 41.4 | 0.4 | 43.7 | 0.9 | 5 | 41.3 | 0.4 | −0.13 |
| 208Pb | 11 | 1 | 10.61 | 0.20 | −4 | 11.1 | 0.4 | 1.0 | 50 | 2 | 50.21 | 0.27 | 0.4 | 49.6 | 1.1 | −0.7 |
| 232Th | 5.9 | 0.3 | 6.01 | 0.17 | 1.9 | 5.69 | 0.07 | −4 | 41 | 2 | 44.8 | 0.7 | 9 | 44 | 3 | 7 |
| 238U | 1.69 | 0.12 | 1.77 | 0.09 | 5 | 1.66 | 0.06 | −1.5 | 41 | 2 | 44.4 | 0.9 | 8 | 41.63 | 0.20 | 1.5 |
A characterization including the USGS GSD-1G and USGS GSE-1G reference materials already indicated issues regarding the homogeneity of selenium.43 This may explain deviations from the reference values measured for these reference materials for Se and possibly also for As. However, the similar results obtained with the various carrier gases as well as the accessibility of main isotopes allowed by the nitrogen plasma source, highlight the potential of nitrogen as an alternative to helium.
Transient signal structure
A comparison of the transient signal structures obtained for the different carrier gases and laser fluences is shown in Fig. 4 using 238U+ as a representative example. The signals are characterized by an initial rise of approx. 10 seconds, followed by a stable second period with low noise and steadily increasing or decreasing signal intensity over 50 s, and the final washout. It appears, however, that the initial rise of the signal is longer when N2 was used in comparison to He and Ar. For N2 and Ar as carrier gases, a fluence of 30 J cm−2 caused a steady increase by a factor of approx. 2 within the second period, while less than 30% increase was observed for helium. Reducing the fluence in all cases caused a reduction or inversion of the signals' slopes. For nitrogen as carrier gas and using 8 J cm−2 however, the signal initially was practically constant at the beginning of the second period but increased again after approximately 400 laser pulses.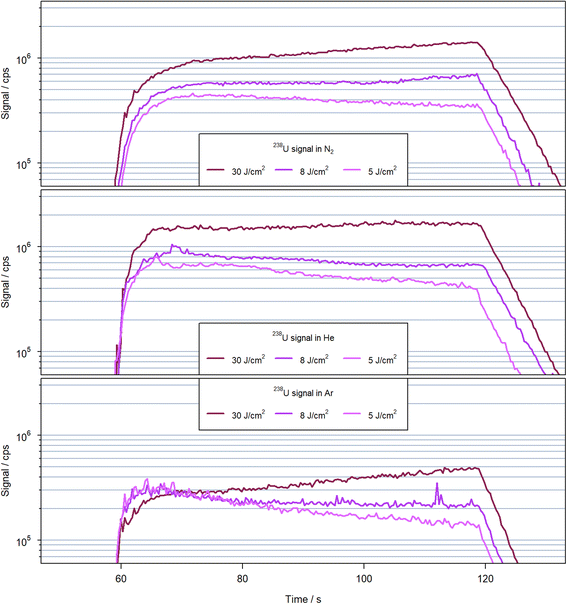 | ||
| Fig. 4 Transient signal 238U+ observed for 600 laser pulses at 10 Hz with a spot size of 90 μm on NIST SRM 610 in helium (top), nitrogen (middle) and argon (bottom) with various fluences. | ||
Since the ablation rates for helium and nitrogen were very similar (see below), the differences in the signal structure could be related either to difference in particle removal out of the crater, transport in the gas or particle vaporization within the N2-MICAP. However, to separate these different processes, further investigations are necessary. Due to the differences in signal evolution between the different carrier gases, an unambiguous comparison is difficult. The sensitivities using nitrogen appear to approach those in helium for extended ablation periods, but the origin of this trend is not yet clear. It is thus depending not only on the gas used but also on the specific ablation conditions in terms of number of pulses and fluence that affect the respective sensitivities between helium and nitrogen. For argon, on the other hand the sensitivities were always below those for helium and nitrogen.
Elemental fractionation for these experiments was assessed via the 238U+/232Th+ intensity ratios, which are plotted in Fig. 5 for experiments with a fluence of 30 J cm−2. For completeness, Fig. S3 and S4† contain the results acquired for all three carrier gases using 8 J cm−2 and 5 J cm−2, respectively. The 238U+/232Th+ sensitivity ratio was previously reported to describe plasma processes related to the particle sizes generated during LA,44 and was also proposed as suitable indicator for plasma induced fractionation. The intensity ratios for all three gases remained comparable within the second period of the ablation in He and Ar at all fluences with average values at 1.01 and 1.05–1.06, respectively. The standard deviation was similar in helium for all fluences (around 0.03). Using argon, the lower signal intensities combined with a spike caused higher standard deviation between 0.03 for the highest fluence and 0.08 due to the spike at 112 s in Fig. 4 for 8 J cm−2. However, there was a notable change when using nitrogen as carrier gas. The intensity ratio at the highest fluence was stable with a value of 0.95 and a standard deviation below 0.02. When using 5 J cm−2, the ratio was also stable with a standard deviation of 0.03 but the mean value increased to 0.99. These average values and standard deviations were lower than those obtained in helium but with 8 J cm−2 the ratio was found to increase after approximately 400 pulses i.e. when the ion signals started to increase as well (Fig. 4). The 238U+/232Th+ intensity ratio evolved between 0.95 and 1.1 leading to an average ratio of 1.00 but a standard deviation 50% higher than in helium above 0.4.
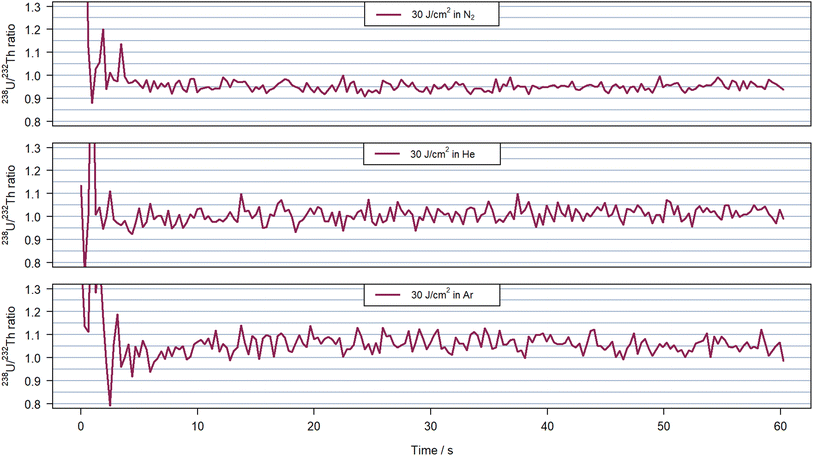 | ||
| Fig. 5 238U+/232Th+ ratio measured for 30 J cm−2 in nitrogen at 0.951(18) on average (top), helium at 1.01(3) (middle) and argon at 1.06(3) (bottom) with 600 pulses at 10 Hz on NIST SRM 610. The time window illustrates the 60 s of ablation without background nor washout time. The 238U+ transient signal corresponding to the experiment presented here can be visualize in Fig. 4 at the corresponding fluence and carrier gas. | ||
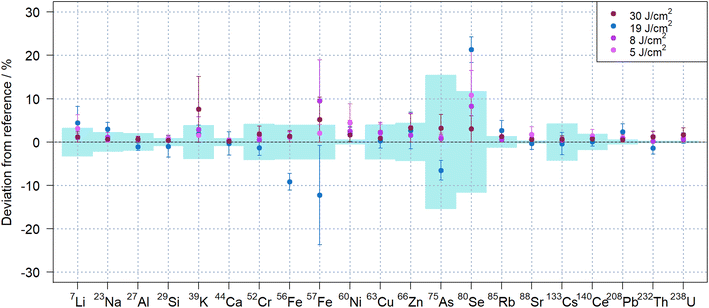
Despite the apparent changes in the temporal signal structure observed during ablation in N2 with different laser fluence (see Fig. 5, S3 and S4†), there was no obvious effect on the quantitative results when using matrix-matched quantification of NIST SRM 612. Fig. 6 compares the results obtained with the different fluences in N2, indicating that very similar results could be obtained for all isotopes investigated. Lowering the fluence, however, reduced the sensitivities, which impaired the repeatability in particular for isotopes with lower sensitivity like 80Se+.
Substantial deviations for iron, arsenic and selenium were observed for the data acquired with 19 J cm−2, which were obtained on a different day. These elements were previously found to exhibit notable heterogeneity with variations above 10% in the NIST SRM glasses,45 which may explain these results.
Ablation rates in helium and nitrogen
The darker surface was initially interpreted as a substantial increase in material deposition next to the ablation crater. Yet, due to the fact that similar ion signals intensities were recorded in helium and in nitrogen, the material removal upon LA in both carrier gases was investigated. The depth of the ablation craters was measured for a laser fluence of 18 J cm−2. The results showed a linear relationship (R2 > 0.999 in all experiments) with no significant difference between the different gases (Fig. 7).The equivalence in material removal between nitrogen and helium is in line with previous studies comparing ablation in argon and helium for various matrices.46 Another study47 compared experimental results and numerical modeling and concluded that the ablation environment had no impact during the first 100 ns of the ablation process,48 which is longer than the pulse length (14 ns) of the laser used in this study. The similar sensitivities between helium and nitrogen observed here thus did not originate from a higher ablation rate, which compensated for losses by deposition near the crater.
Assessment of the particle size and structure
A comparison of the laser-generated particle sizes in nitrogen, helium and argon, as determined by OPC, is shown in Fig. 8. Differences in the PSDs were observed for the different ablation environments. Ablation in argon and nitrogen appeared to produce predominantly particles that are recorded as sizes below 150 nm in diameter, while the distribution observed in helium was found to expand over a much broader range that exceeded the upper size limit used for the OPC. It should be noted however that ablation in argon was reported to produce a substantial fraction of μm-sized particles,32,33 which could not be detected with the UHSAS used here. The maxima of the recorded distributions for Ar and N2 were apparently below 50 nm, while in He the largest fraction of particles was observed in a size range of 70 nm to 80 nm.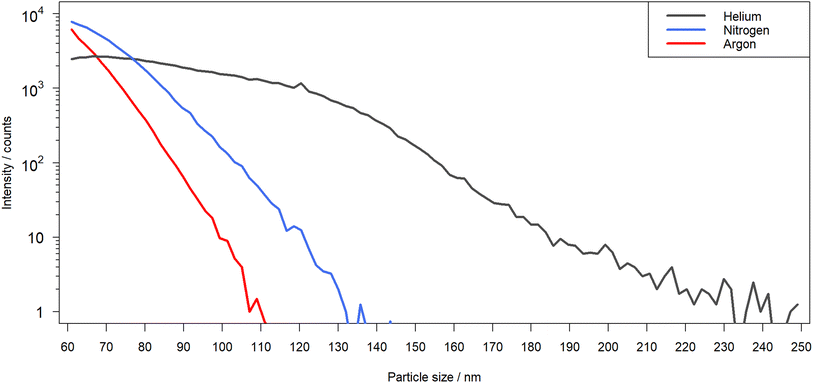 | ||
| Fig. 8 Particle size distribution measured over 4 replicates for the laser-generated aerosol formed in helium (black), nitrogen (blue) and argon (red) by OPC. | ||
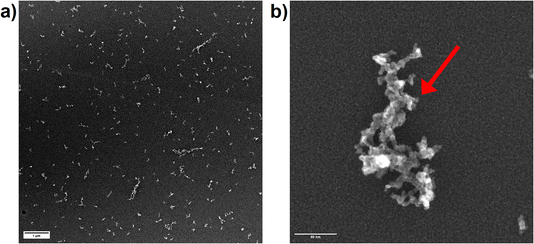
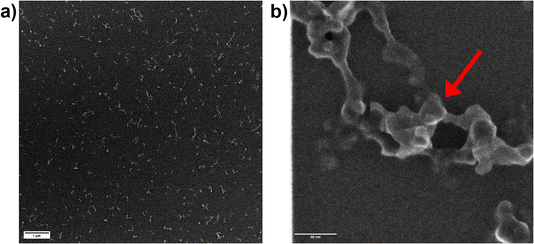
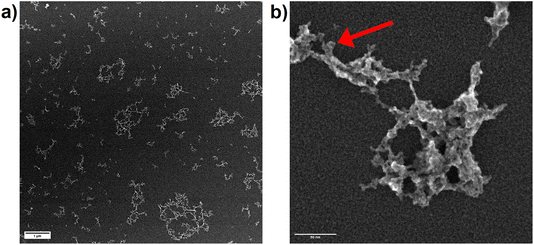
Since OPC data only represents the equivalent spherical size of the particles which are present in the aerosol as agglomerates, secondary electron images of particles, collected on TEM grids, were recorded. The collection of the particles using the Partector™ allowed to adjust the number of particles deposited and thus, to avoid the formation of particle aggregates on the TEM grids. Aerosols collected after ablation in nitrogen (Fig. 9a) and argon (Fig. 10a) contained dominantly agglomerates below 1 μm. The agglomerates consisted of primary particles that formed from droplet condensation and agglomerated into fractal-like structures. These droplets appeared to be larger (approx. 10 nm) and more irregularly shaped for ablation in Ar (Fig. 10b) than in N2 (Fig. 9b). In He on the other hand, large agglomerates were observed (Fig. 11a), which had grown to several μm in size. They exhibited a more complex geometry, and the size of the primary particles seemed to be smaller while their shape appeared more irregular than in nitrogen.
A previous study compared the aerosol generated in helium and argon after collection on filters and visualization by electron microscopy.33 By using OPC complemented by the electrostatic sampling approach, the correlation between the gases' thermal conductivities and the particle growth for the primary particles was similar as previously suggested.32 The larger agglomerates observed in helium on the other hand would indicate that this gas allows for a wider distribution of the primary particles in the ablation cell. An entrapment in the vortexes in the large cylindrical cell17 may then provide a sufficiently long residence time for the agglomerates to grow larger.
Effects of the ablation cell on the laser aerosol formation
To reduce the effect of the residence time in the large cylindrical ablation cell,48 experiments were carried out to investigate analyte sensitivity and aerosol structure by using the two-volume MPFAC LA cell34 with all three carrier gases. As illustrated in Fig. 12, the sensitivity ratios for argon and nitrogen vs. helium were not substantially different from those recorded with the large cylindrical cell (Fig. 2) with a similar drop in sensitivities of less than 40% for all elements in N2. Overall, the reduction for N2vs. He appeared more uniform and Si, Ni, Cu and As in this case had similar sensitivities as nearby m/z. Li on the other hand did not exhibit higher sensitivity anymore. Quantification of NIST SRM 612 and the basalt glasses also indicated that the ablation cell did not affect the results when comparing helium and nitrogen as aerosol carrier. As illustrated in Fig. S5 and S6,† the mass fractions obtained for both gases were generally comparable to those obtained in the large cylindrical cell. Deviations from the reference values e.g. for Se and As were of similar magnitude and their origin needs to be studied in more detail.While the sensitivities and quantification did not reveal significant differences between the ablation cells, the MPFAC caused a substantial change in the aerosol structure for the ablation in He as depicted in Fig. 13. The secondary electron images for the aerosols formed in nitrogen and argon appeared very similar to those collected after the cylindrical ablation cell. However, agglomerates as large as seen in the cylindrical single volume ablation cell were not observed anymore for the MPFAC when ablating in helium. Next to the similar aggregation states, the primary particles produced in the MPFAC appeared similar for all three gases (Fig. S8†).
These results support a previous suggestion, that the residence time of the particles in the ablation cell is responsible for the increase in the agglomerates' size distribution in the aerosol.48 The smaller primary particles observed in argon for the two-volume cell suggest however that a faster aerosol removal from the ablation region also affects the initial particle growth. Furthermore, the similar change in sensitivities across the whole mass range using the MPFAC supports previous findings that a reduction of elemental fractionation can be obtained with such a type of ablation cell.48 It also suggests that the sensitivities obtained with the different carrier gases are related to transport effects.
Conclusion
The previously demonstrated suitability of a nitrogen plasma source for LA-ICPMS30 was extended by investigating the use of nitrogen as ablation environment and as carrier gas for laser-generated aerosols. Despite an enhanced surface darkening during ablation, the sensitivities obtained after LA in nitrogen were typically 30% lower than those measured using helium. Several elements, however, exhibited a stronger suppression in nitrogen, especially when using the large cylindrical ablation cell. The difference in sensitivity, however, seemed not to be a result of change in material removal because the ablation rates in helium and nitrogen were found to be identical. Nonetheless, distinct differences in the aerosol morphology for N2, He and Ar were determined by STEM for aerosols collected after ablation in a large cylindrical cell.Aerosol visualization showed that agglomeration for the different carrier gases was found to depend strongly on the ablation cell geometry. Using a two-volume ablation cell, the primary particles formed in argon appeared to be smaller and the micrometer-sized agglomerates generated in helium in the large single volume ablation cell were not detected anymore. As such, the primary particles and their agglomerates formed using a two-volume ablation cell were not distinguishable for the different ablation environments. Despite the changes in aerosol structure however, the sensitivity ratios of nitrogen relative to helium did not show significant differences for both ablation cell designs.
Differences in the transient signal structure were observed that manifested in increasing signal intensities for single spot ablation experiments. In particular, when using a high laser fluence (30 J cm−2) the signals were found to increase steadily. This increase was most pronounced for ablation in nitrogen and argon while helium only showed a moderate increase. Ablation at lower laser fluences (5 J cm−2, 8 J cm−2) showed mostly a decrease or a less pronounced increase for the ion signals with time. Elemental fractionation, evaluated via the 238U+/232Th+ sensitivity ratio in NIST SRM 610, was found to be more pronounced in nitrogen at lower laser fluences but became negligible at a high laser fluence.
Yet, the quantification of basalt glass reference materials resulted in comparable values for nitrogen and helium, with deviations of less than 15% for most elements analyzed. As and Se in particular exhibited larger offsets in these analyses with may be attributed to their comparably low mass fraction and possibly heterogeneity of the material.
These results indicate that particle formation and transport of laser generated aerosols in nitrogen as a diatomic gas does not differ substantially from that in helium. Changes in the aerosol structure observed here were stronger for different ablation cell geometries and ablation rates using 193 nm were found to be practically identical. As such it appears as if the higher heat capacity of the diatomic gas has a similar beneficial effect compared to argon like the higher heat conductivity of helium.32
In any case, the MICAPMS configuration provides a unique means to not only use laser ablation sample introduction for quantitative analyses but also to investigate the influence of different ablation environments and carrier gas compositions in greater detail than with an argon-based ICPMS. The results presented here might open the door to novel applications of elemental analyses with atmospheric LA sampling. Related to the MICAPMS operation it was found that Al-cones were better suited for analyses in dry plasma conditions. This material furthermore lowers the operating costs in comparison to the more expensive Pt-cones. In summary, the overall cost reduction for applications of LA-ICPMS in elemental analysis by substituting argon and helium can be considered to be a major advantage in combination with a nitrogen plasma source.
Data availability
The data supporting this article have been included as part of the ESI.†Conflicts of interest
This work has been supported by the manufacturer of the MICAP plasma source, Radom Corporation™.Acknowledgements
The authors gratefully acknowledge the microscopy facility ScopeM and the LAC workshop at ETH Zürich for their support and assistance in this work as well as Radom Corporation™ for the funding and their technical expertise. Additionally, the authors would like to acknowledge the help of Pascal Becker and Tobias Schöberl for proofreading.References
- A. L. Gray, Analyst, 1985, 110, 551–556 RSC.
- M. Burger, A. Gundlach-Graham, S. Allner, G. Schwarz, H. A. O. Wang, L. Gyr, S. Burgener, B. Hattendorf, D. Grolimund and D. Günther, Anal. Chem., 2015, 87, 8259–8267 CrossRef.
- J. Košler, Proc. Geol. Assoc., 2007, 118, 19–24 CrossRef.
- D. Chew, K. Drost, J. H. Marsh and J. A. Petrus, Chem. Geol., 2021, 559, 119917 CrossRef.
- A. Audétat, D. Günther and C. A. Heinrich, Science, 1998, 279, 2091–2094 CrossRef PubMed.
- M. Börner, S. Klamor, B. Hoffmann, M. Schroeder, S. Nowak, A. Würsig, M. Winter and F. M. Schappacher, J. Electrochem. Soc., 2016, 163, A831–A837 CrossRef.
- S. Theiner, S. J. M. Van Malderen, T. Van Acker, A. Legin, B. K. Keppler, F. Vanhaecke and G. Koellensperger, Anal. Chem., 2017, 89, 12641–12645 CrossRef PubMed.
- D. Günther, R. Frischknecht, C. A. Heinrich and H.-J. Kahlert, J. Anal. At. Spectrom., 1997, 12, 939–944 RSC.
- S. E. Jackson, H. P. Longerich, G. R. Dunning and B. J. Fryer, Can. Mineral., 1992, 30, 1049–1064 Search PubMed.
- T. E. Jeffries, S. E. Jackson and H. P. Longerich, J. Anal. At. Spectrom., 1998, 13, 935–940 RSC.
- D. J. Figg, J. B. Cross and C. Brink, Appl. Surf. Sci., 1998, 127–129, 287–291 CrossRef.
- P. Telouk, E. F. Rose-Koga and F. Albarede, Geostand. Newsl., 2003, 27, 5–11 CrossRef.
- S. E. Jackson, N. J. Pearson, W. L. Griffin and E. A. Belousova, Chem. Geol., 2004, 211, 47–69 CrossRef.
- J. Gonzalez, X. L. Mao, J. Roy, S. S. Mao and R. E. Russo, J. Anal. At. Spectrom., 2002, 17, 1108–1113 RSC.
- J. Koch, M. Wälle, J. Pisonero and D. Günther, J. Anal. At. Spectrom., 2006, 21, 932–940 RSC.
- R. E. Russo, X. Mao, J. J. Gonzalez and S. S. Mao, J. Anal. At. Spectrom., 2002, 17, 1072–1075 RSC.
- J. Koch, M. Wälle, R. Dietiker and D. Günther, Anal. Chem., 2008, 80, 915–921 CrossRef.
- I. Horn and F. von Blanckenburg, Spectrochim. Acta, Part B, 2007, 62, 410–422 CrossRef.
- J. Pisonero, E. Avigliano, C. Soto-Gancedo, A. Méndez-Vicente, C. Méndez-López, J. Orejas and N. Bordel, J. Anal. At. Spectrom., 2024, 39, 601–609 RSC.
- C. C. Garcia, H. Lindner, A. Von Bohlen, C. Vadla and K. Niemax, J. Anal. At. Spectrom., 2008, 23, 470–478 RSC.
- S. M. Eggins, L. P. J. Kinsley and J. M. G. Shelley, Appl. Surf. Sci., 1998, 127–129, 278–286 CrossRef.
- D. Günther and C. A. Heinrich, J. Anal. At. Spectrom., 1999, 14, 1363–1368 RSC.
- R. S. Houk, V. A. Fassel, G. D. Flesch, H. J. Svec, A. L. Gray and C. E. Taylor, Anal. Chem., 1980, 52, 2283–2289 CrossRef.
- D. A. Wilson, G. H. Vickers and G. M. Hieftje, Anal. Chem., 1987, 59, 1664–1670 CrossRef CAS.
- Y. Okamoto, J. Anal. At. Spectrom., 1994, 9, 745–749 RSC.
- M. R. Hammer, Spectrochim. Acta, Part B, 2008, 63, 456–464 CrossRef.
- A. J. Schwartz, Y. Cheung, J. Jevtic, V. Pikelja, A. Menon, S. J. Ray and G. M. Hieftje, J. Anal. At. Spectrom., 2016, 31, 440–449 RSC.
- J. Jevtic, A. Menon and V. Pikelja, WO2014/159588, 2014.
- M. Schild, A. Gundlach-Graham, A. Menon, J. Jevtic, V. Pikelja, M. Tanner, B. Hattendorf and D. Günther, Anal. Chem., 2018, 90, 13443–13450 CrossRef CAS PubMed.
- C. Neff, P. Becker, B. Hattendorf and D. Günther, J. Anal. At. Spectrom., 2021, 36, 1750–1757 RSC.
- D. Günther and B. Hattendorf, TrAC, Trends Anal. Chem., 2005, 24, 255–265 CrossRef.
- I. Horn and D. Günther, Appl. Surf. Sci., 2003, 207, 144–157 CrossRef CAS.
- H. R. Kuhn and D. Günther, Anal. Bioanal. Chem., 2005, 383, 434–441 CrossRef CAS PubMed.
- P. Becker and D. Günther, J. Anal. At. Spectrom., 2023, 38, 1704–1712 RSC.
- K. P. Jochum, U. Nohl, K. Herwig, E. Lammel, B. Stoll and A. W. Hofmann, Geostand. Geoanal. Res., 2005, 29, 333–338 CrossRef.
- GeoReM - Database on geochemical, environmental and biological reference materials, http://georem.mpch-mainz.gwdg.de/, (accessed 28 February 2024) Search PubMed.
- R Core Team, R Foundation for Statistical Computing, Vienna, Austria, 2021 Search PubMed.
- RStudio Team, RStudio, PBC, Boston MA, USA, 2024 Search PubMed.
- H. P. Longerich, S. E. Jackson and D. Günther, J. Anal. At. Spectrom., 1996, 11, 899–904 RSC.
- V. W. W. Yam, Nat. Chem., 2010, 2, 790 CrossRef PubMed.
- J. R. Rumble, CRC Handbook of Chemistry and Physics (Internet Version), CRC Press/Taylor & Francis, Boca Raton FL, 104th edn., 2023 Search PubMed.
- Z. You, A. Akkuş, W. Weisheit, T. Giray, S. Penk, S. Buttler, S. Recknagel and C. Abad, J. Anal. At. Spectrom., 2022, 37, 2556–2562 RSC.
- M. Guillong, K. Hametner, E. Reusser, S. A. Wilson and D. Günther, Geostand. Geoanal. Res., 2005, 29, 315–331 CrossRef.
- M. Guillong and D. Günther, J. Anal. At. Spectrom., 2002, 17, 831–837 RSC.
- S. M. Eggins and J. M. G. Shelley, Geostand. Newsl., 2002, 26, 269–286 CrossRef.
- I. Horn, M. Guillong and D. Günther, Appl. Surf. Sci., 2001, 182, 91–102 CrossRef.
- A. Bogaerts, Z. Chen and D. Bleiner, J. Anal. At. Spectrom., 2006, 21, 384–395 RSC.
- P. Becker, J. Koch and D. Günther, J. Anal. At. Spectrom., 2022, 37, 1846–1854 RSC.
Footnote |
| † Electronic supplementary information (ESI) available. See DOI: https://doi.org/10.1039/d4ja00327f |
| This journal is © The Royal Society of Chemistry 2024 |

