 Open Access Article
Creative Commons Attribution 3.0 Unported Licence
A ‘tortuous path’ and ‘protective oxide layer’ work in tandem in unique corrosion-resistant polyetherimide coatings
Kuntal
Sarkar†
ab,
Amerjit†
b,
Rishi
Raj†
b,
Tapan Kumar
Rout
a and
Suryasarathi
Bose
 *b
*b
aResearch and Development Division, Tata Steel, Jamshedpur, 831007, India
bDepartment of Materials Engineering, Indian Institute of Science, Bangalore-560012, India. E-mail: sbose@iisc.ac.in
First published on 23rd April 2024
Abstract
Galvannealed steels are mainly surface treated via chromating and phosphating processes to make their surface more corrosion-resistant and enhance paint adhesion. However, environmental regulations have put a control on the usage of these pretreatments, and these need to be replaced by environment-friendly pretreatment chemicals having similar range of properties. In this regard, a unique polyetherimide-based coating system is proposed herein containing a di-anhydride molecule and two di-amine molecules, which can avoid harsh chromating, phosphating and silane-based pre-treatments and offers properties that are not achieved using conventional routes. CNTs are added to a base pre-polymer (polyamic acid) to offer a tortuous path, whereas polyaniline-coated ceria (PANI@CeO2) is added, prior to imidization, to offer a protective oxide layer, which worked in tandem to offer a corrosion-resistant coating. The base coating shows the lowest corrosion resistance owing to the higher porosity, presence of microcracks and a combination of both the nanoparticles offering higher noble open circuit potentials (OCPs) at all immersion times, indicating prolonged coating stability and less tendency to corrosion. In addition, electrochemical impedance spectroscopy (EIS) study of both CNT and PANI@CeO2 reinforced composite coating shows the highest corrosion resistance and low water uptake with respect to other coating systems evaluated here. The highest corrosion resistance in the composite coatings may be due to the low coating porosity, absence of microcracks, tortuous pathways for corrosive ion movement and ennobling effect due to the presence of PANI@CeO2 and CNTs.
1. Introduction
Galvannealed (GA) steel has experienced a very high demand in the last few decades because of its corrosion resistance, weldability and improved paint adhesion. The galvanized steel obtained from the hot dip process is further heat-treated to form GA steel. This heat treatment in the galvannealing process gives rise to the formation of four different intermetallic phases.1 The eta (η) phase is the most external phase and contains zinc in the highest amount; this phase does not show good weldability or paintability. The second phase is the zeta (ζ) phase, which has a lower amount of zinc. However, this phase promotes cracking in GA coating. The delta (δ) phase has less zinc content than the zeta phase and provides corrosion resistance and ductility. The fourth phase, which is just next to a steel substrate, is the gamma (γ) phase and is the richest in iron and exhibits less resistance to corrosion. The preferred GA coating by automotive steel industry contains more intermetallic delta phases having an iron content of 10 to 12%. The heat treatment and composition of the coating bath (galvanizing bath) have a significant role in the formation of different phases to different extents. GA coating composition, the evolution of various phases and the coating microstructure affect the final properties such as corrosion resistance, paintability, weldability and formability.2–4Galvannealed steel is further surface-treated to enhance corrosion resistance and paintability. The most common surface treatments are chromating and phosphating. However, a chromating bath contains hexavalent chromium, which is highly carcinogenic.5 The phosphating bath also produces lot of toxic waste, which is considered hazardous for the environment and human health.6,7 Organosilane-based pretreatment has gained a lot of research interest in the last few decades due its superior properties in terms of corrosion resistance and acts as a “molecular bridge” between the substrate (e.g., steel and aluminum) and the top paint applied over it. Organosilanes are environment-friendly and do not produce hazardous waste like chromating and phosphating processes.8 There are different oxides like SiO2 and ZrO2 added to the silane coating to further improve the corrosion resistance property. Silanes are also added with rare earth elements like Ce(III) and Ce(IV) ions to enhance the corrosion inhibition. Nanoclays and lanthanides also are added into the silane coating system for increasing the corrosion resistance. Silane coatings have some drawbacks despite being so versatile and having unique properties. The coating made from silane are generally very brittle and cannot provide long term corrosion protection.9 Silanes films also contain lot of pores along with the cracks in the coating. These pores and cracks allow the corrosive environment to find a path and reach the steel substrate, which promotes corrosion.8 The brittle property of silane coating can restrict its formability during the manufacturing process of any product component. Therefore, silane-based coatings are not used for long term corrosion protection on steel due to their brittleness and low coating thickness.9 Epoxy-based coatings are very popular as the coating on metals due to their excellent adhesion, chemical resistance and processability. However, it is reported that the epoxy coating has a significant chance to pick up moisture due to its hydrophilic nature and may cause significant decrease in the corrosion resistance along with the recyclability issues.9,10 Therefore, there is a scope to develop a new type of coating system on metals, which can solve the existing problems of brittleness and water uptake and offer more corrosion resistance, less porosity and high flexibility.
Another popular polymer for anti-corrosion applications is polyetherimide. It is an engineering polymer and is very popular due to its higher mechanical properties, corrosion resistance, thermal stability, chemical and oxidation resistance.11,12 Polyetherimides are mostly used in advanced high performance composite, structural adhesives, electronics application, gas separation membranes and insulation at high temperature.13 However, the development of a corrosion-resistant coating of polyimide polymers on steel is very less explored. The polyimide coating may uptake water over a longer period, and the corrosion resistance may get diminished. Therefore, researchers are developing an electroactive polyimide in combination with different nanoparticles (e.g., TiO2 and SiO2) reinforced coatings to enhance the corrosion resistance. Han et al.14 reported the synthesis of polyimide by reacting amine-quinone diamine with 3,3′,4,4′-benzophenone tetracarboxylic dianhydride (BTDA) to form polyamic acid. This polyamic acid was coated over iron and thermally imidized to obtain the amine-quinone polyimide coating, which shows excellent corrosion resistance. The higher corrosion resistance was attributed to the presence of p-electron and lone pair electron on nitrogen, which could make the co-ordinate bond with the d-orbital of iron. Weng et al.15 showed the synthesis of electroactive polyimide-TiO2 nanocomposite coating. Here, the electroactive polyimide was made by reacting the aniline trimer (AT) with 4,4′-(4,4′-isopropylidenediphenoxy)bis(phthalic anhydride) (BPADA) and TiO2 was added to enhance the corrosion resistance further. The increased corrosion resistance of this coating on cold rolled steel was reported due to the redox catalytic activity of aniline trimer (AT), which can form a passive film on steel and barrier property due to the presence of TiO2. In another work by Huang et al.,16 it has been reported that the electroactive polyimide of aniline trimer (AT) and 4,4′-(4,4′-isopropylidenediphenoxy)bis(phthalic anhydride) (BPADA) could effectively enhanced the corrosion resistance of cold rolled steel. The redox catalytic activity of aniline trimer was held responsible for the enhanced corrosion resistance due to passive oxide film formation. In a very recent work by Saarivirta et al.,17 amine-quinone polyimide coating on galvanized steel was compared with a conventional polyimide coating (on galvanized steel) of pyromellitic dianhydride and 4,4′-oxydianiline. Here, both coatings show excellent corrosion resistance. However, the amine-quinone-based polyimide coating shows slightly inferior corrosion resistance than the conventional polyimide coating, which is in an opposite trend with the observation reported by other research groups explained above. The heterogeneous and discontinuous nature of the amine-quinone-based coating was identified as a possible reason of the lower corrosion resistance than the conventional coating.
In the current study, authors have synthesized a conventional polyimide coating system by combining one dianhydride and two diamines. This type of polyimide has never been explored as a coating on galvannealed (GA) steel as per the author's best knowledge. The effect on the corrosion performance by this polyimide coating system on GA steel is the prime interest of the current work. Furthermore, this polyimide coating is reinforced with different particles like CNT, PANI@CeO2 to understand the effect of reinforcement on corrosion resistance. The coating synthesis, deposition and understanding the corrosion mechanism have been thoroughly discussed in this work.
2. Experimental
2.1 Materials
4,4′-(4,4′-Isopropylidenediphenoxy)bis(phthalic anhydride) (BPADA), 4,4′-oxydianiline (ODA), poly(propylene glycol)bis(2-aminopropylether) (Jeff D-230), ceria nanoparticles, ammonium persulphate and aniline were procured from Sigma Aldrich. BPADA, ODA and Jeff D-230 were used as the starting monomers for polyetherimide polymer synthesis. N-Methyl-2-pyrrolidone (NMP) (anhydrous 99.5%, Sigma Aldrich) was used as a solvent. MWCNT (NC7000, length of 1.5 μm and diameter of 9.5 nm) was procured from Nanocyl SA (Belgium). MWCNT and ceria were used as reinforcement fillers for improving the mechanical and barrier properties. Concentrated H2SO4 and HNO3 (1![[thin space (1/6-em)]](https://www.rsc.org/images/entities/char_2009.gif) :
:![[thin space (1/6-em)]](https://www.rsc.org/images/entities/char_2009.gif) 3 v/v) solution mixture was used for the functionalization of the reinforcement filler (MWCNT) to enhance the polymer–filler interaction. Aniline and ammonium persulphate (works as oxidant) were utilized to make polyaniline (PANI)-coated ceria particles. This PANI-coated ceria was used as another reinforcement into the polyetherimide coating. Galvannealed (GA) steel was used as a substrate for the coating purpose. There were three different composite coating systems prepared by altering the reinforcement particles and compared with the pure polymer coating (without reinforcement). The detailed composition of all four coating systems is listed in Table 1.
3 v/v) solution mixture was used for the functionalization of the reinforcement filler (MWCNT) to enhance the polymer–filler interaction. Aniline and ammonium persulphate (works as oxidant) were utilized to make polyaniline (PANI)-coated ceria particles. This PANI-coated ceria was used as another reinforcement into the polyetherimide coating. Galvannealed (GA) steel was used as a substrate for the coating purpose. There were three different composite coating systems prepared by altering the reinforcement particles and compared with the pure polymer coating (without reinforcement). The detailed composition of all four coating systems is listed in Table 1.
| Sl no. | Sample ID | Monomers | Equivalent | Fillers | Weight fraction (%) |
|---|---|---|---|---|---|
| 1 | BOJ | BPADA | 1 | No fillers | — |
| ODA | 0.7 | ||||
| Jeff amine (D-230) | 0.3 | ||||
| 2 | BOJ-CNT | BPADA | 1 | MWCNT | 0.3 |
| ODA | 0.7 | ||||
| Jeff amine (D-230) | 0.3 | ||||
| 3 | BOJ-PANI@CeO2 | BPADA | 1 | PANI@CeO2 | 2 |
| ODA | 0.7 | ||||
| Jeff amine (D-230) | 0.3 | ||||
| 4 | BOJ-CNT-PANI@CeO2 | BPADA | 1 | MWCNT & PANI@CeO2 | (a) MWCNT = 0.3% |
| ODA | 0.7 | (b) PANI@CeO2 = 2% | |||
| Jeff amine (D-230) | 0.3 |
2.2 Methods
![[thin space (1/6-em)]](https://www.rsc.org/images/entities/char_2009.gif) :
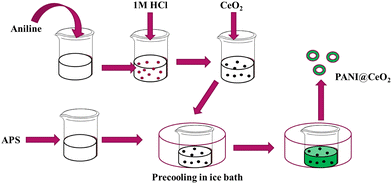
:![[thin space (1/6-em)]](https://www.rsc.org/images/entities/char_2009.gif) 1, and 2 wt% of this PANI@CeO2 was loaded into the polymer coating. The schematic of the synthesis of PANI@CeO2 has been shown in Fig. 1.
1, and 2 wt% of this PANI@CeO2 was loaded into the polymer coating. The schematic of the synthesis of PANI@CeO2 has been shown in Fig. 1.
![[thin space (1/6-em)]](https://www.rsc.org/images/entities/char_2009.gif) :
:![[thin space (1/6-em)]](https://www.rsc.org/images/entities/char_2009.gif) 3 volume ratio. The MWCNT was added in the above-mentioned acid mixture and refluxed for 8 hours at 80 °C temperature. After the completion of reflux, the reaction mixture was diluted many times with distilled water until the pH becomes 7. Thereafter, it was vacuum-filtered and dried at 80 °C for 24 hours to obtain the functionalized MWCNT (f-MWCNT) powder. This f-MWCNT was then added in the coating composition to prepare the composite coating.
3 volume ratio. The MWCNT was added in the above-mentioned acid mixture and refluxed for 8 hours at 80 °C temperature. After the completion of reflux, the reaction mixture was diluted many times with distilled water until the pH becomes 7. Thereafter, it was vacuum-filtered and dried at 80 °C for 24 hours to obtain the functionalized MWCNT (f-MWCNT) powder. This f-MWCNT was then added in the coating composition to prepare the composite coating.
![[thin space (1/6-em)]](https://www.rsc.org/images/entities/char_2009.gif) :
:![[thin space (1/6-em)]](https://www.rsc.org/images/entities/char_2009.gif) 1. The reaction mixture was then kept under stirring condition for 24 hours, and the N2 atmosphere was also maintained throughout the polymerization process to avoid side reactions. The resulting polymer solution is referred to as a polyamic acid (PAA) intermediate.
1. The reaction mixture was then kept under stirring condition for 24 hours, and the N2 atmosphere was also maintained throughout the polymerization process to avoid side reactions. The resulting polymer solution is referred to as a polyamic acid (PAA) intermediate.
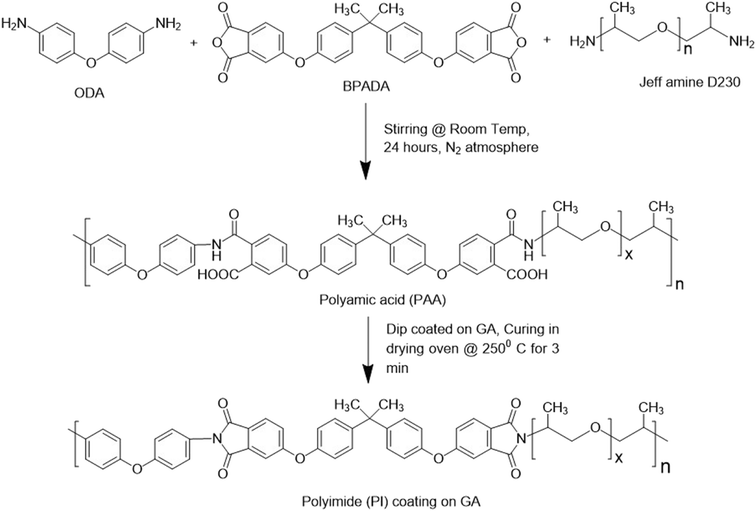
This PAA was used to coat the galvannealed steel (GA) coupons. The degreased GA steel was coated by the manual dip coating method to obtain a layer of PAA over it. This PAA-coated steel was cured at 250 °C for three minutes to obtain the polyetherimide coating. This polyetherimide (PI)-coated steel was used for different structural characterization as well as corrosion performance analysis. The overall polyetherimide polymerization reaction scheme starting from monomers to polymers and the coating process is shown in Fig. 2.
2.3 Characterization
3. Results and discussion
Synthesis of PAA and the hybrid nanoparticles
Fig. 3a is the representative FTIR plot for the polyamic acid (PAA) intermediate and polyetherimide (PI) coating after curing. The peak at 3270 cm−1 indicates the amide absorption band corresponding to N–H stretching. The peaks at 1713, 1647 and 1542 cm−1 are due to the stretching for C![[double bond, length as m-dash]](https://www.rsc.org/images/entities/char_e001.gif) O of carboxylic acid, C
O of carboxylic acid, C![[double bond, length as m-dash]](https://www.rsc.org/images/entities/char_e001.gif) O stretching for amide and N–H bending (of amide), respectively.18 The presence of all these peaks indicates the effective reaction among dianhydride and diamine monomers and formation of PAA. The FTIR spectrum of the polyetherimide coating (Fig. 3a) shows peaks at 1775, 1712, 1372 and 743 cm−1 corresponding to asymmetric C
O stretching for amide and N–H bending (of amide), respectively.18 The presence of all these peaks indicates the effective reaction among dianhydride and diamine monomers and formation of PAA. The FTIR spectrum of the polyetherimide coating (Fig. 3a) shows peaks at 1775, 1712, 1372 and 743 cm−1 corresponding to asymmetric C![[double bond, length as m-dash]](https://www.rsc.org/images/entities/char_e001.gif) O stretching, symmetric C
O stretching, symmetric C![[double bond, length as m-dash]](https://www.rsc.org/images/entities/char_e001.gif) O stretching, C–N stretching and imide ring deformation, respectively.18 It signifies the conversion of PAA to polyetherimide coating.
O stretching, C–N stretching and imide ring deformation, respectively.18 It signifies the conversion of PAA to polyetherimide coating.
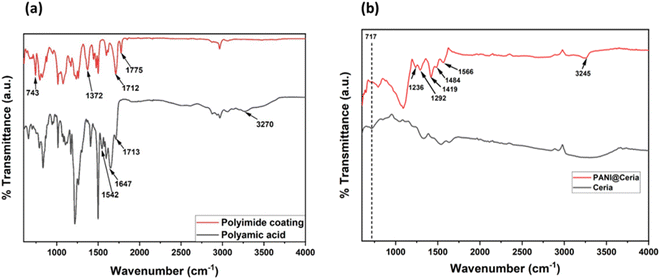 | ||
| Fig. 3 FTIR spectra of (a) the polyamic acid (PAA) intermediate and polyetherimide (PI) coatings after curing. (b) As-received CeO2 and synthesized PANI@CeO2. | ||
The FTIR spectra of the as-received ceria and synthesized PANI@CeO2 are shown in Fig. 3b. The peak at 717 cm−1 represents the Ce–O stretching mode, which is very prominent for the as-received ceria particles. The synthesized PANI@CeO2 shows characteristic peaks at 1566 and 1484 cm−1 for the stretching of the quinoid and benzoid ring, respectively. The peak at 1292 cm−1 is due to C–N![[double bond, length as m-dash]](https://www.rsc.org/images/entities/char_e001.gif) stretching.19,20 The presence of all these peaks signifies the formation of polyaniline (PANI). It is also important to notice that the peak intensity at 717 cm−1 diminishes for PANI-coated ceria (PANI@CeO2) particles, which is the indication of the formation of PANI coating over ceria particles.
stretching.19,20 The presence of all these peaks signifies the formation of polyaniline (PANI). It is also important to notice that the peak intensity at 717 cm−1 diminishes for PANI-coated ceria (PANI@CeO2) particles, which is the indication of the formation of PANI coating over ceria particles.
SEM of PANI@CeO2
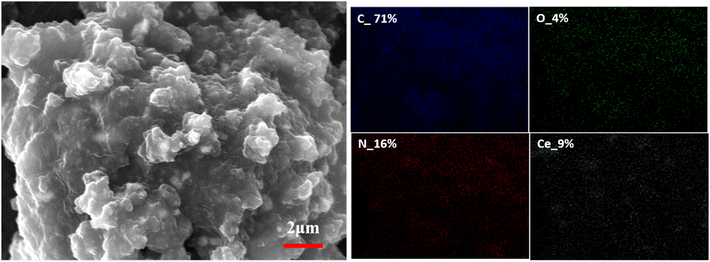
The SEM image of PANI@CeO2 (Fig. 4) shows the spherical ceria particles coated with PANI. The particle size of ceria particles is in the range of 300–400 nm. The EDS mapping of the agglomerates confirm the coating of PANI over ceria.SEM of coating surface and coating cross section
Fig. 5 depicts the surface SEM image and corresponding EDS mapping for all the as-prepared four coating systems. It is evident from the image that only the BOJ coating surface (Fig. 5a and a′) has a lot of microcracks. The EDS map indicates the presence of C, N and O elements, which confirms the presence of polyether imide coating on the steel surface. The BOJ-CNT coating surface (Fig. 5b and b′) is rougher and free from any cracks. Also, the agglomerated particles (indicated by red color arrows) indicate the presence of CNTs, which is distributed in most of the coating surface areas. However, the agglomeration indicates that the dispersion of CNTs was not very uniform throughout the coating matrix. The BOJ-PANI@CeO2 (Fig. 5c and c′) and BOJ-CNT-PANI@CeO2 (Fig. 5d and d′) coating also shows a rougher surface appearance, and the reinforced particles are little agglomerated in very small islands (indicated by red color arrows). This indicates the presence of reinforcement particles (CNT & PANI@CeO2) in agglomerated islands everywhere in the coating matrix. The corresponding EDS maps for BOJ-CNT, BOJ-PANI@CeO2 and BOJ-CNT-PANI@CeO2 confirms the presence of C, N and O elements, which is due the presence of major polyetherimide coating matrix. The presence of negligible percentage of cerium (Ce) in EDS maps for BOJ-PANI@CeO2 and BOJ-CNT-PANI@CeO2 coatings is due to the very less concentration of the reinforced particle with respect to the polyetherimide coating matrix. There was no presence of cracks on the BOJ-PANI@CeO2 and BOJ-CNT-PANI@CeO2 coating surface. The absence of cracks in all three composite coatings may be attributed to the presence of reinforced particles like CNT and PANI@CeO2, which could make an effective interface between the polymer matrix and them.21 The presence of reinforcing particles and the absence of microcracks in all three composite coatings has a significant impact on the visible differences in the corrosion resistance property with respect to the only BOJ coating, which has been explained in subsequent sections.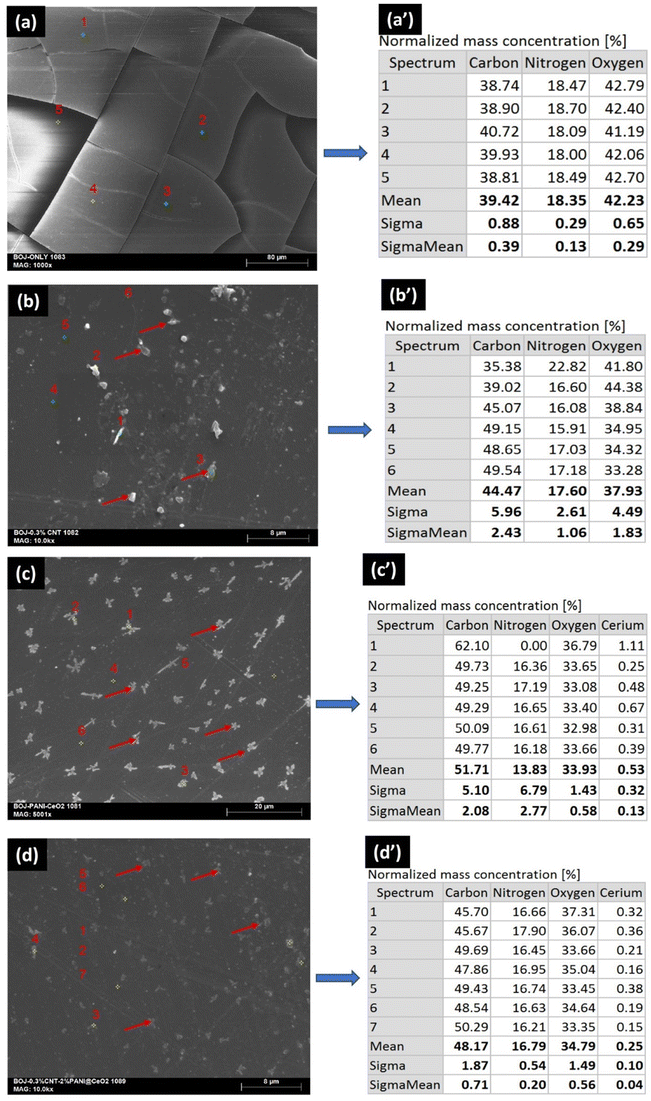 | ||
| Fig. 5 SEM surface images and EDS mapping of the as-prepared coatings (a and a′) only BOJ, (b and b′) BOJ-CNT, (c and c′) BOJ-PANI@CeO2 and (d and d′) BOJ-CNT-PANI@CeO2. | ||
Fig. 6 shows the SEM surface images and corresponding EDS maps after the completion of time-dependent EIS test for 300 hours. There were many microcracks observed over the only BOJ coating surface after the corrosion (EIS) test, which was also observed before the tests. However, the number and size of microcracks are higher on the surface after the corrosion test with respect to the surface before the test. There were no cracks observed on the surface of the rest three composite coatings even after the time-dependent corrosion (EIS) test. The presence of a higher elemental concentration of iron, zinc (from EDS map) for only the BOJ coating with respect to the rest of the three composite coatings indicates more corrosion of only the BOJ coating with respect to others, which exposed the GA metallic coating underlayer.
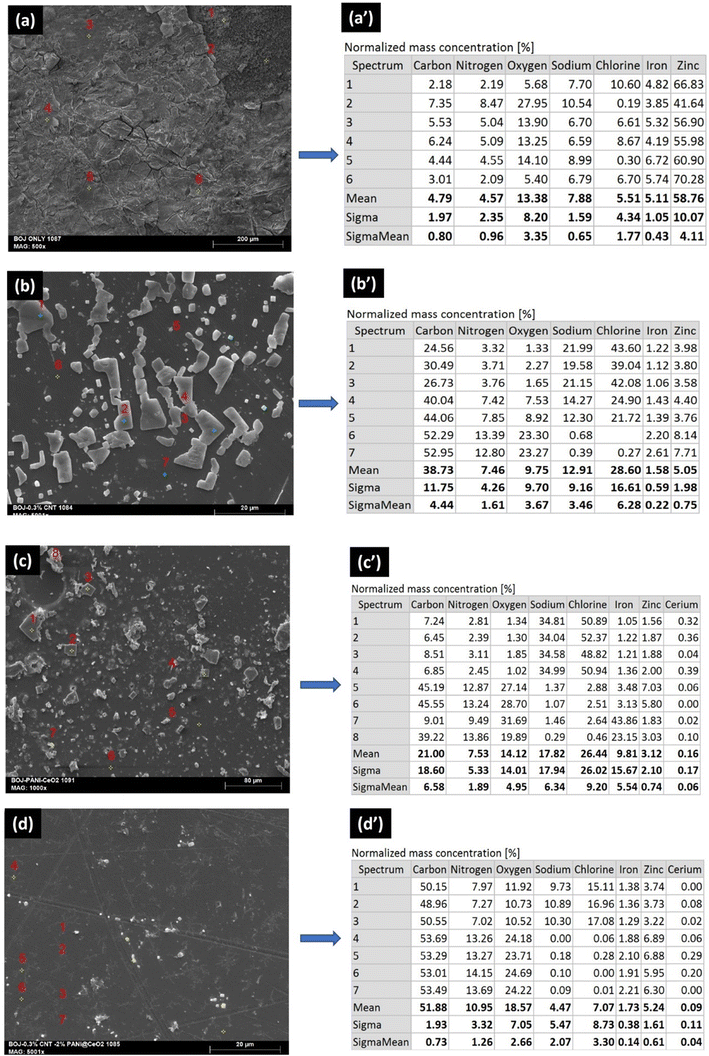 | ||
| Fig. 6 SEM surface images and EDS mapping of (a and a′) only BOJ, (b and b′) BOJ-CNT, (c and c′) BOJ-PANI@CeO2 and (d and d′) BOJ-CNT-PANI@CeO2 coatings after the corrosion test. | ||
Fig. 7 shows the cross-sectional coating morphology for all the four coating systems. The polyetherimide coating layer and GA metallic coating layer is clearly visible over the base steel substrate. The average coating thickness for all four polyetherimide coatings is in the range of 43 to 45 micron. The microcracks throughout the coating thickness are present for only the BOJ coating. There was very few microcracks observed throughout the coating cross-section in the case of BOJ-CNT, and no “through microcracks” were observed for the BOJ-PANI@CeO2 coating with respect to only the BOJ coating. The BOJ-CNT-PANI@CeO2 coating also shows integrated coating cross-sectional microstructure, which is devoid of any microcracks.
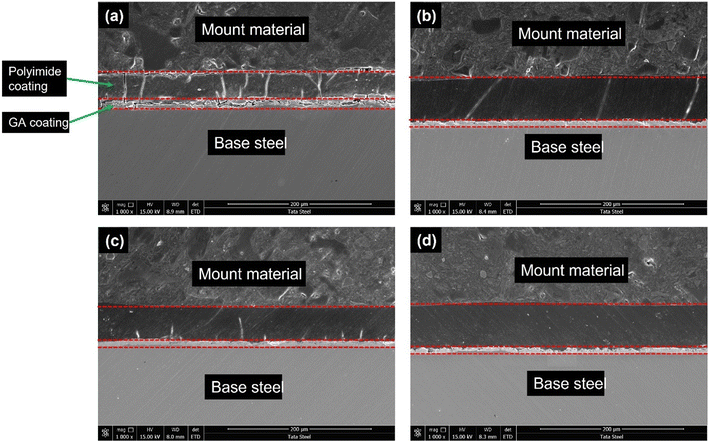 | ||
| Fig. 7 SEM cross-section images of the as-prepared coatings: (a) only BOJ, (b) BOJ-CNT, (c) BOJ-PANI@CeO2 and (d) BOJ-CNT-PANI@CeO2. | ||
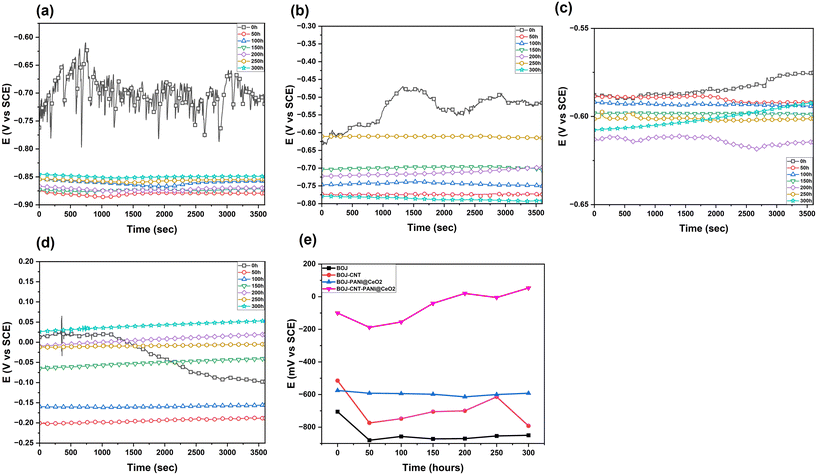
Open circuit potential (OCP) in the composite coating
Fig. 8 represents the OCP behavior (stabilized for 1 hour) of all the coated GA steel at different immersion times. The OCP vs. time plot provides an idea of stability of the coating at different immersion times and tendency of corrosion. The OCP of the only BOJ coating is the lowest among all the coatings at all immersion times. The OCP value of the BOJ coating drops to more negative values after 0 h of immersion and it get stabilizes almost at similar OCP values (about −900 mV) from 50 h to 300 h of immersion. This drop of OCP from 0 h towards more negative value is the indication of the onset of corrosion through the coating pores, microcracks or pin holes.22 The CNT-containing coatings stabilizes its OCP at more positive values compared to the OCPs of only the base (BOJ) coating. It also reveals that the OCPs of BOJ-CNT never fall below the OCPs of only the BOJ coating at any immersion period. Therefore, it can be explained that the addition of CNT increases the coating stability (compared to only BOJ) by providing a barrier towards corrosive ion permeation through the BOJ-CNT composite coating. The increased OCP values indicates the more nobler coating surface and lesser tendency of corrosion.23 The incorporation of PANI@CeO2 (in BOJ-PANI@CeO2 coating) also shows more nobler OCPs at all immersion times (except 0 h) compared to only BOJ and BOJ-CNT coatings. Therefore, it can be said that the incorporation of PANI@CeO2 has a much higher effect than CNT to increase the OCP towards more noble potential and thus increasing the barrier property more than only the BOJ and BOJ-CNT coating. The OCPs here are very stabilized at about −600 mV and do not fall at any immersion time. This stabilized OCP can be related to the long-term barrier protection, which is not affected after prolonged immersion. It is also worth noting that the difference of stabilized OCP between only BOJ and BOJ-PANI@CeO2 is almost 300 mV whether the difference of OCP between BOJ-CNT and only BOJ is hardly 100 mV at all immersion times. It indicates that the PANI@CeO2 particles have more ennobling activity than CNT. PANI@CeO2 could lead to passive film formation on steel by the “ennobling mechanism” due to its conductive nature. This formation of the passive film leads to more corrosion resistance. In case of the addition of both CNT as well as PANI@CeO2 together for the composite coating BOJ-CNT-PANI@CeO2, the OCP stabilizes at a very high noble potential (about 50 mV at 300 h of immersion). The difference of the OCP is very high with other coating systems. This can be attributed to the synergistic effect of addition of CNT and CNT-PANI@CeO2, which may cause the greater ennobling of steel than other coatings. This ennobling of steel could form a more protective corrosion film (passive film), which leads to OCP stabilization at more noble potentials.22 The OCP stabilizes at more noble potentials and never falls at any immersion time. This indicates the highest barrier resistance among all the coatings and prolonged barrier resistance property for the BOJ-CNT-PANI@CeO2 coating.24Electrochemical impedance spectroscopy (EIS) analysis
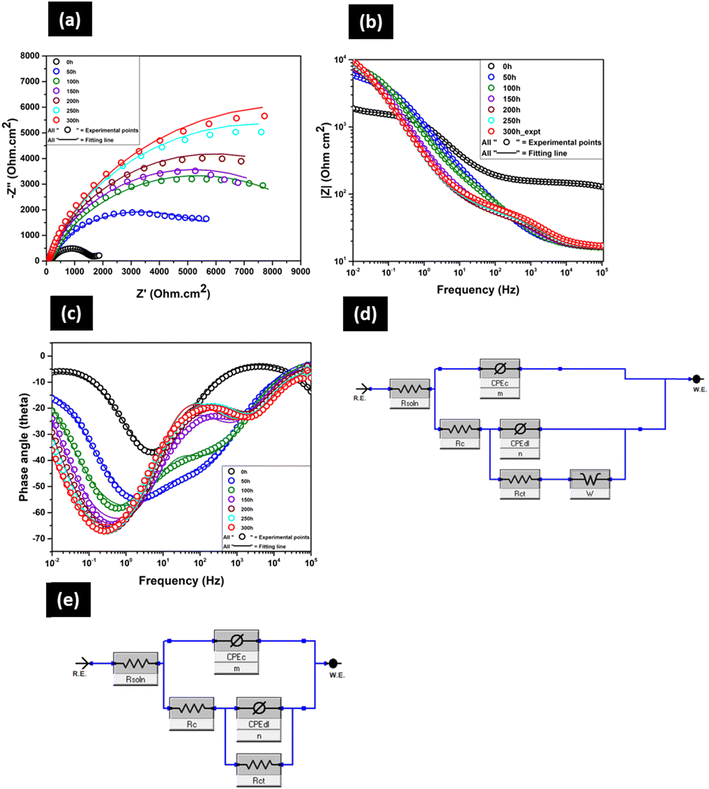
EIS tests were performed to compare the resistance towards corrosion of all the coated GA steel samples. EIS was also used as a tool to understand the corrosion mechanisms of different coating systems by performing time-dependent EIS tests. The change in different electrochemical parameters helps to understand the mechanisms of corrosive ions penetration through different coating systems with prolonged immersion time. Time-dependent EIS plots (Nyquist, Bode impedance and phase) of only BOJ coating are shown in Fig. 9. There was no visual evidence of red or white rust (corrosion) formation even after 300 hours of immersion. All the Nyquist plots (Fig. 9(a)) consist of two capacitive loops, where the high frequency loop arises due to the contribution from the polymer coating (BOJ) and the low frequency loop represents the corrosion process of coated GA steel over immersion time. However, the presence of both loops is not very prominent, and it is difficult to distinguish between the two loops. It happens mainly due to the very less corrosion reaction area at the metal–coating interface at the beginning of immersion, which causes the overlapping of time relaxation of electrochemical reaction impedance at the metal–coating interface and impedance of coating.25 It is evident that the radius of the semicircle of the capacitive loop at the starting of immersion (0 h) is the lowest and increases with immersion time. It signifies that the barrier resistance (corrosion resistance) of the BOJ coating increased with immersion time and a decrease in permeation of corrosive ions through the coating.26Bode impedance plot (Fig. 9(b)) at 0 h reveals the resistive behavior at high frequency range (105 to 102 Hz) and capacitive behavior at an intermediate short range of frequency (102 to 1 Hz), which is again followed by the resistive behavior in the lowest frequency range (1 to 10−2 Hz). However, all other impedance plots from 50 h to 300 h immersion show a very short-range resistant behavior at high frequency from 105 to 104 Hz, which is followed by capacitive behavior for a long range of frequency from 104 to 10−2 Hz. It also reveals that the impedance at the lowest frequency (at 10−2 Hz) is higher at immersion time 50 h to 300 h with respect to the impedance at 0 h. This indicates that the coating has a higher barrier (corrosion resistance) property at a longer immersion time than the initial.
The presence of microcracks on the surface of the BOJ coating makes the impedance, i.e., the corrosion resistance, lowest at 0 h of immersion, which may cause the ingress of corrosive ions through the coating microcracks over prolonged immersion time and reach the steel surface underneath and can initiate the corrosion of steel. The higher impedance at longer immersion times could be attributed to the formation of protective corrosion oxide/hydroxide layer on steel, which may decrease the through coating microcrack channels and porous pathways for corrosive ions.27,28 This oxide/hydroxide could effectively block the pores/microcracks of BOJ coatings, impede the access of corrosive ions to steel surface and enhance the overall impedance of the BOJ coating with immersion time.
The phase angle of the BOJ coating is 37° at the start of immersion (0 h), which increases gradually from 54° to 67° for 50 h to 300 h immersion time (Fig. 9c). This gradual increase in the phase angle indicates a higher resistance to corrosion with increasing immersion time.26 The EIS data till 50 h of immersion has been fitted by equivalent electrical circuit (EEC) shown in Fig. 9d, which consists of Rs(CPEcRc) combined with the (CPEdlRct) elements. Warburg impedance has also been introduced into the EEC to fit the very small tail at the lowest frequency, which is visible till 50 h of immersion. This Warburg impedance usually represents the impedance arising due to the diffusion-limited reaction of water or oxygen at the coating and substrate interface.29,30 However, this Warburg impedance vanishes after 50 h of immersion, and the EIS data from 100 h to 300 h has been fitted by the EEC of Fig. 9e, where the Rs(CPEcRc) elements combined with the (CPEdlRct) elements. The combination of (CPEcRc) represents the processes happening for the coating layer, and (CPEdlRct) combination represents the corrosion process happening at the steel–coating interface. Here, Rs, Rc, and Rct are solution resistance, coating resistance and charge transfer resistance, respectively. CPEc and CPEdl are the constant phase elements at the coating solution interface and coating–steel interface, respectively. The inhomogeneous physical property of the BOJ coating and the steel surface causes a deviation from ideal capacitor, which is defined by the constant phase element (CPE). The impedance of CPE (ZCPE) is given by eqn (1) as follows.28
 | (1) |
 and n is exponent (0 ≤ n ≤ 1). The capacitance value corresponding to each CPE has been obtained by the formula of eqn (2).28
 | (2) |
| BOJ | R soln (Ohm) | R c (Ohm) | CPEc (F cm−2) | m | R ct | CPEdl (F cm−2) | n | R t = Rc + Rct (Ohm) | W (S × s(1/2)) | Chi sq |
|---|---|---|---|---|---|---|---|---|---|---|
| 0 h | 11 | 141 | 2.5 × 10⁻⁹ | 0.66 | 1502 | 9.8 × 10⁻⁵ | 0.7 | 1643 | 1.9 × 10⁻² | 2.79 × 10⁻⁴ |
| 50 h | 16 | 440 | 5.7 × 10⁻⁵ | 0.66 | 5630 | 3.4 × 10⁻⁵ | 0.87 | 6070 | 4.46 × 10⁻³ | 6.73 × 10⁻⁴ |
| 100 h | 16 | 244 | 3.8 × 10⁻⁵ | 0.65 | 10![[thin space (1/6-em)]](https://www.rsc.org/images/entities/char_2009.gif) 610 610 |
1.4 × 10⁻⁴ | 0.83 | 10![[thin space (1/6-em)]](https://www.rsc.org/images/entities/char_2009.gif) 854 854 |
— | 1.03 × 10⁻³ |
| 150 h | 16 | 62 | 1.1 × 10⁻⁵ | 0.68 | 10![[thin space (1/6-em)]](https://www.rsc.org/images/entities/char_2009.gif) 330 330 |
5.3 × 10⁻⁴ | 0.8 | 10![[thin space (1/6-em)]](https://www.rsc.org/images/entities/char_2009.gif) 392 392 |
— | 2.09 × 10⁻³ |
| 200 h | 16 | 56 | 9.4 × 10⁻⁶ | 0.66 | 11![[thin space (1/6-em)]](https://www.rsc.org/images/entities/char_2009.gif) 920 920 |
6.6 × 10⁻⁴ | 0.83 | 11![[thin space (1/6-em)]](https://www.rsc.org/images/entities/char_2009.gif) 976 976 |
— | 2.19 × 10⁻³ |
| 250 h | 16 | 65 | 7.9 × 10⁻⁶ | 0.64 | 15![[thin space (1/6-em)]](https://www.rsc.org/images/entities/char_2009.gif) 370 370 |
7.2 × 10⁻⁴ | 0.83 | 15![[thin space (1/6-em)]](https://www.rsc.org/images/entities/char_2009.gif) 435 435 |
— | 2.41 × 10⁻³ |
| 300 h | 16 | 71 | 8.3 × 10⁻⁶ | 0.63 | 17![[thin space (1/6-em)]](https://www.rsc.org/images/entities/char_2009.gif) 730 730 |
7.2 × 10⁻⁴ | 0.83 | 17![[thin space (1/6-em)]](https://www.rsc.org/images/entities/char_2009.gif) 801 801 |
— | 2.28 × 10⁻³ |
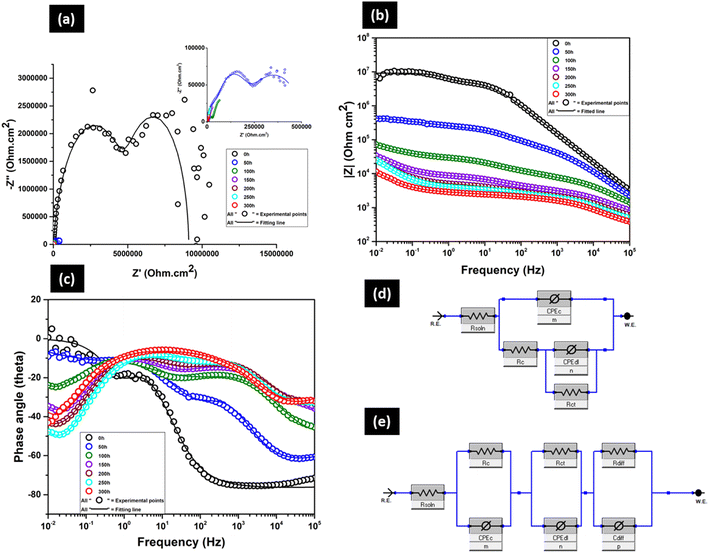
The Nyquist plot (Fig. 10a) of the BOJ-CNT coating shows the presence of two prominent capacitive loops (at 0 h) where the high frequency loop arises due to the contribution from the polymer coating (BOJ-0.3% CNT) and the low frequency loop represents the corrosion process of GA steel over immersion time. Here, the radius of semicircles is much higher with respect to only the BOJ coating at all immersion times. It indicates that the BOJ-CNT coating has a higher barrier or corrosion resistance than only the BOJ coating even after prolonged immersion. However, the radius of semicircles decreases over the immersion time, which is an opposite trend with respect to only the BOJ coating where we saw some insignificant increase in impedance with immersion. There was no visual presence of white rust or red rust even after 300 hours of immersion. The gradual decrease in the radius of the semicircle indicates the decrease in the barrier (corrosion) resistance as more amount of corrosive ions permeate through the BOJ-CNT coating over time. It is also important to observe that the Nyquist plots at higher immersion time (from 50 h to 300 h as shown in the inset of Fig. 10a) consisted of three capacitive loops instead of two capacitive loops at 0 h. The introduction of a third interface arises due to the significant accumulation of corrosion products at the metal–coating interface over a longer immersion time. Here, in most of the cases, all three capacitive loops are difficult to distinguish, which can be attributed to the overlapping of impedances of all the processes happening.
The Bode impedance plot (Fig. 10b) shows capacitive the behaviour from 105 to 102 Hz at 0 h of immersion, which is followed by resistive behaviour till 10−2 Hz. However, the capacitive behaviour is very short and not so prominent in the frequency region from 105 to 104 Hz at higher immersion times from 50 h to 300 h. This is followed by resistive behaviour from 104 to 10−1 Hz. The capacitive behaviour is again observed at the lowest frequency region from 10−1 to 10−2 Hz, especially for 150 to 300 h of immersion. It also reveals that the impedance at the lowest frequency (at 10−2 Hz) is the highest at 0 h of immersion, and it gradually decreases over immersion time. This can be attributed to the permeation of corrosive ions over prolonged immersion times, which causes continuous corrosion of the GA substrate. It is also very important to note that the impedance of the CNT-reinforced coating (BOJ-CNT) at 0 h is significantly higher than only the BOJ coating. Moreover, the impedance of the CNT-reinforced coating at all immersion times is higher than only the BOJ coating. The higher impedance of the CNT-reinforced coating is attributed to the higher barrier property offered by CNT by decreasing the permeation of corrosive ions like water through the coating.31,32 CNT acts as a second phase material in the coating matrix, which effectively decreases the porosity of coating and also increases the tortuous pathways for corrosive agents.33 Also, there was no presence of microcracks on the coating surface, and the presence of very few “through coating microcracks” (shown in SEM cross section of coatings) ensures very little paths for the corrosive media to pass through the BOJ-CNT coating layer with respect to the only the BOJ coating. Thereby, the addition of CNT decreases the permeation of corrosive agents and increases the barrier property or corrosion resistance.33–35 The phase angle (Fig. 10c) at higher frequency region (at about 104 Hz) and lower frequency region (at about 10−1 to 10−2 Hz) gradually decreases with immersion time, which could attributed to the gradual decrease in the coating resistance for prolonged immersion.26 The EIS data at 0 h has been fitted with EEC of two time constants (Fig. 10d), where Rs(CPEcRc) combined with the (CPEdlRct) elements. Here, (CPEcRc) represents the electrochemical processes for the coating layer and (CPEdlRct) combination represents the corrosion process happening at the steel–coating interface. The EIS data at longer immersion time (50 h to 300 h) can no longer be fitted with the above mentioned two interface EEC. Therefore, a third circuit element has been introduced, which could effectively fit the EIS data. This third interface arises due to the accumulation of corrosion products at the coating–steel interface over longer immersion. Here, it can be considered that the coating shows barrier effect against the diffusion of the accumulated corrosion products towards coating from the coating–metal interface.25,36 This diffusion process may have a controlling factor on the faradic process. Therefore, the EEC model of Fig. 10e, where the third interface is a combination of diffusion resistance (Rdiff) and diffusion capacitance (Cdiff), has been used to fit those EIS data from 50 h to 300 h of immersion.37 All the electrochemical parameters and their values obtained by fitting with EECs have been shown in Table 3.
| BOJ-CNT | R soln (Ohm) | R c (Ohm) | CPEc (F) | m | R ct | CPEdl (F) | n | R diff | CPEdiff (F) | p | R t = Rc + Rct + Rdiff (Ohm) | Chi sq |
|---|---|---|---|---|---|---|---|---|---|---|---|---|
| 0 h | 15 | 5.40 × 10⁶ | 1.95 × 10⁻⁹ | 0.85 | 3.71 × 10⁶ | 6.92 × 10⁻⁸ | 1 | 9.11 × 10⁶ | 1.16 × 10⁻² | |||
| 50 h | 15 | 1.49 × 10⁵ | 3.95 × 10⁻⁸ | 0.74 | 3.98 × 10⁴ | 2.88 × 10⁻⁹ | 0.8 | 3.44 × 10⁵ | 7.6 × 10⁻⁶ | 0.44 | 5.32 × 10⁵ | 5.84 × 10⁻⁴ |
| 100 h | 15 | 3.25 × 10⁴ | 8.1 × 10⁻⁷ | 0.44 | 5325 | 3.41 × 10⁻⁹ | 0.67 | 8.34 × 10⁴ | 2.9 × 10⁻⁴ | 0.79 | 1.21 × 10⁵ | 4.49 × 10⁻⁴ |
| 150 h | 1 | 4034 | 8.08 × 10⁻⁹ | 0.49 | 4508 | 2.4 × 10⁻⁶ | 0.68 | 7.14 × 10⁴ | 5.9 × 10⁻⁴ | 0.73 | 8.0 × 10⁴ | 9.61 × 10⁻⁵ |
| 200 h | 187 | 3216 | 2.04 × 10⁻⁶ | 0.5 | 1831 | 8.38 × 10⁻⁹ | 0.61 | 6.74 × 10⁴ | 8.6 × 10⁻⁴ | 0.77 | 7.3 × 10⁴ | 2.24 × 10⁻⁴ |
| 250 h | 103 | 3002 | 7.3 × 10⁻⁶ | 0.35 | 1751 | 1.67 × 10⁻⁸ | 0.58 | 6.46 × 10⁴ | 7.3 × 10⁻⁴ | 0.84 | 7.0 × 10⁴ | 3.99 × 10⁻⁴ |
| 300 h | 87.35 | 2021 | 1.9 × 10⁻⁵ | 0.27 | 1500 | 2.91 × 10⁻⁸ | 0.62 | 2.16 × 10⁴ | 1.8 × 10⁻³ | 0.81 | 2.5 × 10⁴ | 5.65 × 10⁻⁴ |
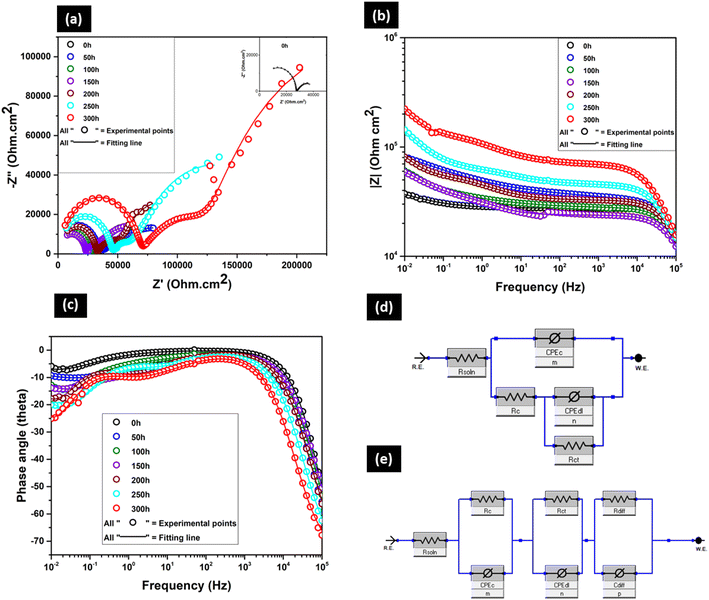
Fig. 11a–c shows the time-dependent Nyquist, Bode impedance and Bode phase angle plot of the BOJ-PANI@CeO2 coating, respectively. There was no visual red rust formation even after 300 hours of immersion. The Nyquist plot (Fig. 11a) shows two capacitive loops at 0 h of immersion (inset graph). The high frequency loop corresponds to the electrochemical processes happening on the coating layer, whereas the low frequency loop represents the corrosion process happening at the coating–steel interface. It is important to note that the radius of the semicircle is increasing with prolonged immersion time till 300 h. This trend is similar with the trend observed for only the BOJ coating and opposite to the trend for the BOJ-CNT coating (as explained in the earlier section). This increase in the radius of the semicircle for the BOJ-PANI@CeO2 coating is directly related to increasing barrier resistance and thus the increasing corrosion resistance over prolonged immersion. It is also worth noting that the Nyquist plot consists of three prominent capacitive loops from 50 h to 300 h of immersion instead of two capacitive loops at 0 h. The presence of a third capacitive loop can be dedicated to the formation of the corrosion oxide at the coating–steel interface over prolonged immersion.
Fig. 11b shows the Bode impedance plot, which has a very short capacitive behaviour at the highest (105 to 104 Hz) and lowest frequency ranges (10−1 to 10−2 Hz) at all immersion times. The intermediate frequency range (104 to 10−1 Hz) shows resistive behaviour at all immersion times. It is also evident that the impedance at the lowest frequency (10−2 Hz) is the lowest at 0 h, which increased gradually with prolonged immersion till 300 h. This increase in impedance is attributed to the formation of corrosion product at the steel–coating interface, which enhances the impedance and resistance to corrosion. It is also important to note that the impedance of BOJ-PANI@CeO2 is much higher than only the BOJ coating at all immersion times. The presence of PANI@CeO2 particles and integrated coating microstructure (devoid of microcracks) slows down the permeation of the corrosive environment and increases the impedance with respect to only the BOJ coating.22 However, the impedance of BOJ-PANI@CeO2 is lower compared to BOJ-CNT at the initial immersion period from 0 h to 100 h. The impedance at 150 h is almost similar and thereafter it increases more than that for BOJ-CNT from 200 h to 300 h. This initial (0 h to 100 h) lower impedance of the BOJ-PANI@CeO2 coating can be attributed to the less barrier effect provided by the PANI@CeO2 particles with respect to CNT in the BOJ-CNT coating. However, the increase in the impedance of BOJ-PANI@CeO2 (with respect to the BOJ-CNT coating) after 150 h can be related to the formation of a more protective corrosion oxide layer at the steel–coating interface due to the ennobling effect provided by PANI@CeO2 particles. The “ennobling effect” may get triggered due to the presence of the conducting PANI layer over ceria particles, which could effectively cover the steel surface with a protective passive film at a longer immersion time.22 The phase angle plot (Fig. 11c) reveals that the phase angle at all frequencies increases to a little extent with increasing immersion time. This increase in the phase angle value indicates increasing barrier (corrosion) resistance with prolonged immersion time.
The EIS data at 0 h immersion has been fitted with the EEC of Fig. 11d, and the rest of the data has been fitted with the EEC of Fig. 11e. These circuit elements and their combinations are the same as the EECs used to fit the EIS data of the BOJ-CNT coating. The EIS data at 0 h is fitted by the EEC of two interfaces, where (CPEcRc) represents the electrochemical processes for the coating layer and (CPEdlRct) combination represents the corrosion process happening at the steel–coating interface. However, the EIS at higher immersion times (50 h to 300 h) cannot be fitted properly by this two-interface circuit, and a three-interface circuit is required, where the introduction of a third interface (RdiffCPEdiff) was done to fit the EIS data properly. As explained in the earlier section, this third interface arises due to the formation of corrosion products at the steel–coating interface. The values of all electrochemical parameters obtained by fitting the EIS plots are shown in Table 4.
| BOJ-PANI@CeO2 | R soln (Ohm) | R c (Ohm) | CPEc (F) | m | R ct | CPEdl (F) | n | R diff (Ohm) | CPEdiff (F) | p | R t = Rc + Rct + Rdiff (Ohm) | Chi sq |
|---|---|---|---|---|---|---|---|---|---|---|---|---|
| 0 h | 10 | 2.7 × 10⁴ | 7.15 × 10⁻¹¹ | 0.96 | 1.85 × 10⁴ | 9.4 × 10⁻⁴ | 0.57 | 4.61 × 10⁴ | 3.43 × 10⁻⁵ | |||
| 50 h | 6 | 3.22 × 10⁴ | 1.02 × 10⁻¹⁰ | 0.92 | 8.66 × 10⁴ | 2.2 × 10⁻⁴ | 0.38 | 6.10 × 10³ | 9.12 × 10⁻⁸ | 0.35 | 1.25 × 10⁵ | 3.97 × 10⁻⁵ |
| 100 h | 24.5 | 2.76 × 10⁴ | 9.18 × 10⁻¹¹ | 0.91 | 2.89 × 10⁴ | 3.9 × 10⁻⁴ | 0.86 | 1.76 × 10⁴ | 4.5 × 10⁻⁵ | 0.38 | 7.41 × 10⁴ | 3.32 × 10⁻⁵ |
| 150 h | 21 | 9.59 × 10³ | 1 × 10⁻⁵ | 0.75 | 4.54 × 10⁴ | 3.0 × 10⁻⁴ | 0.66 | 2.38 × 10⁴ | 1.1 × 10⁻¹⁰ | 0.9 | 7.9 × 10⁴ | 5.77 × 10⁻⁴ |
| 200 h | 4 | 6.49 × 10⁴ | 3.7 × 10⁻⁴ | 0.84 | 2.27 × 10⁴ | 6.6 × 10⁻⁶ | 0.61 | 3.26 × 10⁴ | 1.06 × 10⁻¹⁰ | 0.9 | 1.2 × 10⁵ | 6.28 × 10⁻⁵ |
| 250 h | 5 | 2.34 × 10⁴ | 2.1 × 10⁻⁶ | 0.52 | 1.26 × 10⁵ | 1.24 × 10⁻⁴ | 0.78 | 4.49 × 10⁴ | 1.17 × 10⁻¹⁰ | 0.9 | 1.94 × 10⁵ | 1.02 × 10⁻⁴ |
| 300 h | 6 | 6.53 × 10⁴ | 1.9 × 10⁻⁶ | 0.55 | 2.57 × 10⁵ | 1.2 × 10⁻⁴ | 0.86 | 6.89 × 10⁴ | 1.18 × 10⁻¹⁰ | 0.88 | 3.91 × 10⁵ | 2.55 × 10⁻⁴ |
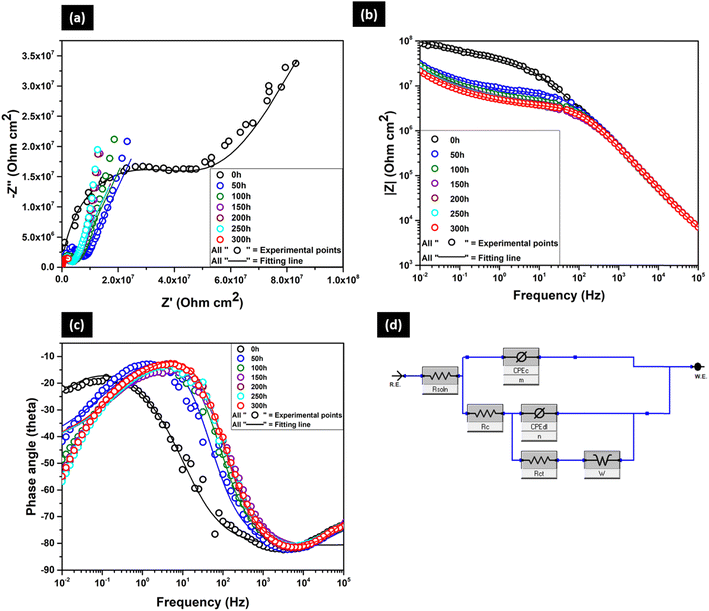
The Nyquist plot (Fig. 12a) of the BOJ-CNT-PANI-CeO2 coating shows two capacitive loops at all immersion hours. The higher frequency loop represents the electrochemical process of coating, and the lower frequency loop corresponds to the corrosion process on steel surface. However, a line at 45° angle with the real axis appears at the lower frequency of the Nyquist plot. It indicates the diffusion-controlled reaction process of corrosive agents like water and oxygen at the steel–coating interface. This diffusion-controlled phenomena is represented by the Warburg element, which could effectively fit all the Nyquist plots having a tail (of 45°) at the lowest frequency.30 The Nyquist plot reveals that the radius of the semi-circle diminishes over prolonged time. However, this decrease in radius is not very high even after 300 h of immersion. This trend is similar with the observed trend of the BOJ-CNT coating and opposite with the trend of only the BOJ and BOJ-PANI@CeO2 coating. In the case of the BOJ-CNT coating, the decrease rate of the radius of the semi-circle is very high and diminishes to very low values compared to that of the BOJ-CNT-PANI-CeO2 coating. It indicates that the BOJ-CNT-PANI@CeO2 coating is very stable and resistant to corrosion even after prolonged immersion time. The observation of stabilization of OCPs at higher noble potential also supports the reason of longer stability and corrosion resistance of this coating than others. It is also evident that the radius of the semicircle is higher than any other coatings at all immersion times. The presence of both CNT and PANI@CeO2 may have a mutual reinforcing effect in enhancing the barrier resistance by providing tortuous pathways, compact coating microstructure (free from microcracks) for corrosion ion movement and ennobling of steel.
Fig. 12b is the Bode impedance plot, where we can observe a very prominent capacitive behaviour in the frequency range from 105 to 102 Hz, which is followed by resistant behaviour till 10−2 Hz at all immersion times. The impedance (|Z|) at the lowest frequency (10−2 Hz) is the highest at 0 h of immersion (about 108 Ohm cm2). The |Z| value decreases and get stabilized at about 107 Ohm cm2, which does not change much even after prolonged immersion. It is also very important to note that the impedance at all immersion times is higher than any other coating systems. The higher impedance represents the higher corrosion resistance of this coating than the others. The presence of both CNT and PANI@CeO2 particles may mutually aid in increasing the impedance value by offering tortuous pathways, lower porosity/microcracks of coating and making a protective corrosion oxide layer on the steel surface (ennobling). The phase angle plot (Fig. 12c) reveals a very little decrease in the phase angle. The phase angle does not change much even with increasing immersion times, and it is very stable to a similar value. This shows that the BOJ-CNT-PANI-CeO2 coating does not change its characteristics much over prolonged immersion time. The stability of the phase angle plot indicates a very stable and long-term corrosion ion-protective coating characteristic.
All the EIS data is fitted with the equivalent circuit shown in Fig. 12d. This is the same circuit utilized in fitting the EIS plots of only the BOJ coating till 50 h of immersion. The electrochemical parameters obtained after fitting are represented in Table 5.
| BOJ-CNT- PANI@CeO2 | R soln (Ohm) | R c (Ohm) | CPEc (F) | m | R ct | CPEdl (F) | n | R t = Rpore + Rct (Ohm) | W (S × s(1/2)) | Chi sq |
|---|---|---|---|---|---|---|---|---|---|---|
| 0 h | 15 | 1.99 × 10⁷ | 6.04 × 10⁻¹⁰ | 0.9 | 4.78 × 10⁷ | 4.78 × 10⁻⁹ | 0.48 | 6.77 × 10⁷ | 6.83 × 10⁻⁸ | 3.61 × 10⁻³ |
| 50 h | 13 | 3.35 × 10⁴ | 2.3 × 10⁻¹⁰ | 0.89 | 6.73 × 10⁶ | 4.59 × 10⁻¹¹ | 1 | 6.76 × 10⁶ | 1.58 × 10⁻⁷ | 3.94 × 10⁻³ |
| 100 h | 14 | 1.79 × 10⁴ | 2 × 10⁻¹⁰ | 0.89 | 4.29 × 10⁶ | 7.74 × 10⁻¹¹ | 0.99 | 4.3 × 10⁶ | 1.72 × 10⁻⁷ | 2.50 × 10⁻³ |
| 150 h | 16 | 1.55 × 10³ | 2.02 × 10⁻¹³ | 0.57 | 3.58 × 10⁶ | 3.5 × 10⁻¹⁰ | 0.94 | 3.6 × 10⁶ | 2.03 × 10⁻⁷ | 4.04 × 10⁻³ |
| 200 h | 14 | 2.36 × 10⁴ | 2.04 × 10⁻¹⁰ | 0.9 | 3.50 × 10⁶ | 7.46 × 10⁻¹¹ | 1 | 3.5 × 10⁶ | 2.17 × 10⁻⁷ | 4.88 × 10⁻³ |
| 250 h | 11 | 2.66 × 10⁴ | 2.26 × 10⁻¹⁰ | 0.89 | 3.38 × 10⁶ | 7.01 × 10⁻¹¹ | 1 | 3.41 × 10⁶ | 2.12 × 10⁻⁷ | 5.32 × 10⁻³ |
| 300 h | 16 | 2.19 × 10⁴ | 1.91 × 10⁻¹⁰ | 0.89 | 3.38 × 10⁶ | 7.4 × 10⁻¹¹ | 1 | 3.4 × 10⁶ | 2.28 × 10⁻⁷ | 4.22 × 10⁻³ |
Discussion
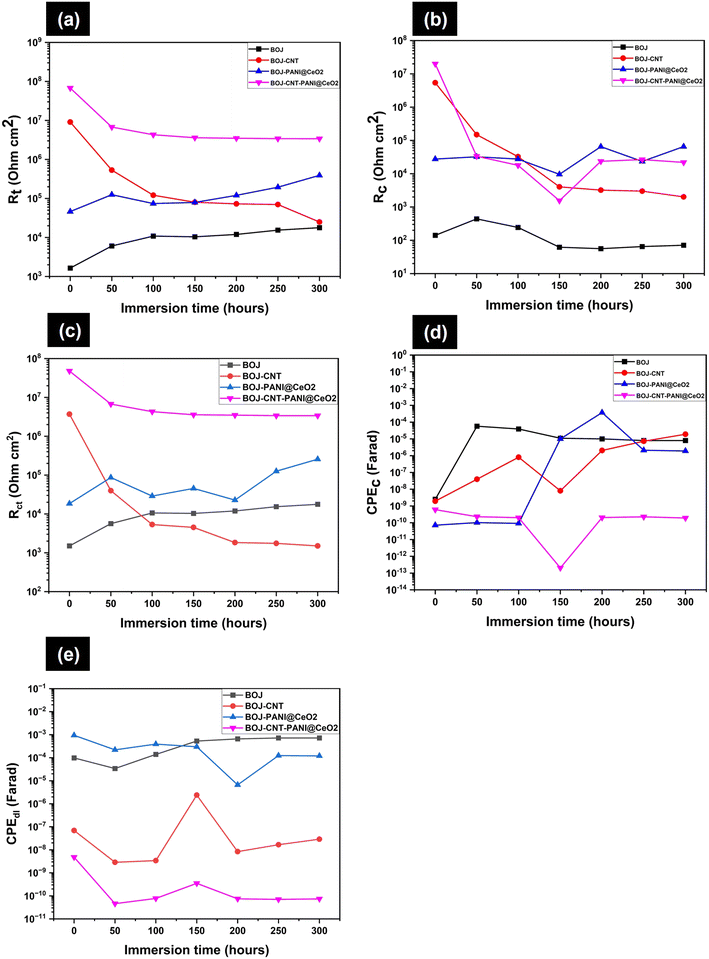
The coating resistance (Rc) of the BOJ coating at all immersion times is very less (Fig. 13b), which indicates that the coating is porous and filled with microcracks (confirmed by the SEM analysis of coating), which provides enough paths for corrosive environment to move through it. It is also evident that the coating resistance is lower at all immersion times with respect to other composite coating systems. However, there is an increase in the charge transfer resistance (Rct) (Fig. 13c) with increasing immersion time, which effectively increases the total resistance (Rt = Rc + Rct) with immersion time (Fig. 13a). The increase in the charge transfer resistance (Rct) as well as the total resistance to corrosion with immersion time can be attributed to the formation of the oxide/hydroxide layer at the steel surface due to the penetration of water and other corrosive species through the microcracks or pores, which enhances corrosion resistance. However, the total resistance to the corrosion of the BOJ coating is the lowest with respect to other composite coatings at all immersion times, which may be due to the presence of more microcracks and pores. It can also be observed that the value of coating capacitance (CPEc) has increased (Fig. 13d) with immersion time with respect to the capacitance at the start of immersion (at 0 h). This indicates the penetration of water through the microcracks/pores of the coating. Since water has higher dielectric constant than the polymer coating, therefore, the absorption of water always enhances the capacitance of the coating ©.38 This can be understood from the formula of coating capacitance, as mentioned in eqn (3).39 | (3) |
In case of the BOJ-CNT coating, it is evident that the coating resistance (Rc) was initially (at 0 h) very high (5.4 × 10⁶ Ohm) with respect to only the BOJ coating (Fig. 13b). This can be attributed to the presence of a lower amount of pores, negligible microcracks and higher tortuous path for corrosive ions movement, which effectively increases the coating resistance for the BOJ-CNT coating. However, this Rc value decreased dramatically till 150 hours of immersion and, thereafter, it is almost stable at similar Rc values till 300 h of immersion. It indicates that the permeation of corrosive species increases with prolonged immersion and therefore shows decreasing trend in Rc values.40 The charge transfer resistance (Rct) as well as total resistance to corrosion (Rt) (Fig. 13c and a, respectively) also diminishes in a similar fashion like Rc, which indicates a gradual decrease in the coating corrosion resistance over prolonged immersion time due to the permeation of corrosive species.40 It is also observed that the coating capacitance (CPEc) and double layer capacitance (CPEdl) (Fig. 13d and e, respectively) show an increasing trend over longer immersion times, which signifies that water permeates through the coating over prolonged immersion and enhances the capacitance value.
The coating resistance (Rc) of the BOJ-PANI@CeO2 coating is always higher than the only the BOJ coating at all immersion times (Fig. 13b). This is related to the presence of PANI@CeO2 reinforcement, which effectively diminishes the permeation of corrosive agents and increases the barrier property. However, it is important to note that the coating resistance is lower than that of the BOJ-CNT coating till 100 h of immersion and thereafter it increases more than that of the BOJ-CNT coating. The ennobling of steel by PANI@CeO2 and formation of a protective passive film could be the reason of increasing Rc values at longer immersion. It is also observed that the charge transfer resistance (Rct) is always higher than only the BOJ coating. The Rct is lower at the initial immersion period, which is followed by an increasing trend at higher immersion (Fig. 13c) when compared with the BOJ-CNT coating. The formation of a protective oxide layer could be the reason of the increasing Rct value at longer immersion times than the BOJ-CNT coating. Effectively, the total resistance (Rt) to corrosion also follows a similar trend, where it reveals lower Rt value till 100 h, followed by increasing value with respect to the BOJ-CNT coating (Fig. 13a). The “ennobling mechanism” and subsequent formation of a protective corrosion layer could be the underlying mechanism of it. The coating capacitance (CPEc) is relatively lower till 100 h of immersion and then it increases with respect to the BOJ-CNT coating (Fig. 13d). This is the indication of the lower permeation of water at the start of immersion and it increases at prolonged immersion. However, the double layer capacitance (CPEdl) is always higher than the BOJ-CNT coating. This means that the access of water at the steel–coating interface is always higher than that at the BOJ-CNT coating at all immersion times. The availability of more water at the steel–coating interface could effectively take part in the formation of protective oxide layer, which effectively enhances the resistance to corrosion (Rt) with respect to the BOJ-CNT coating at higher immersion hours.
The BOJ-CNT-PANI@CeO2 coating has a higher coating resistance (Rc) than only the BOJ coating at all immersion times (Fig. 13b). However, Rc is almost similar to other coating systems at all immersion times. The higher Rc value indicates less coating porosity, no microcracks and more tortuous pathways, which causes the slower ingress of corrosive ions. It is also observed that the charge transfer resistance (Rct) is higher than that of all other coating systems at all immersion times. The higher charge transfer resistance can be attributed to the formation of a protective corrosion oxide layer at the steel–coating interface due to the “ennobling mechanism”, which effectively decreases the faradic (corrosion) reaction process at the steel–coating interface. Therefore, the total resistance to corrosion (Rt) is always higher than the other coating systems. The lower coating pores, compact coating microstructure (free from microcracks), tortuous pathways for corrosive agents and the ennobling effect could be the main reason of the higher corrosion resistance (Rt) than all other coating systems. It is also very important to note that the coating capacitance (CPEc) is lower than most of the other coating systems (except BOJ-PANI@CeO2 coating) during the initial immersion period till 100 h (Fig. 13d). Thereafter, the CPEc is always lower than any other coating systems till 300 h of immersion. The lower CPEc values indicate that the extent of water permeation is lower than that in any other coating systems. Fig. 13e shows a remarkable decrease in the double layer capacitance (CPEdl), which is lower than that of all other coating systems at all immersion times. The lower permeation of water decreases the CPEdl values and thereby enhances the corrosion resistance.
4. Conclusion
In this study, a unique polyetherimide-based coating was developed using one dianhydride (BPADA) and two diamines ODA and Jeff D-230. The intermediate, polyamic acid (PAA), was first synthesized and then coated over galvannealed steel, followed by thermal curing to imidize PAA into PEI. In order to provide a ‘tortuous path’, CNTs were added to PAA prior to imidization, and a combination of CNT and PANI-coated ceria particles were added to render a protective oxide layer. The open circuit polarization (OCP) study shows that the composite coating has more noble OCP at all immersion times than the only base coating. The PANI@CeO2-reinforced coating shows more noble OCPs than the CNT-reinforced composite coating due to the ennobling effect, which causes the formation of protective corrosion oxide layer over GA steel. The BOJ-CNT-PANI-CeO2 coating shows the most noble OCPs among all the coating systems and shows long term stability and barrier resistance of the coating. The EIS test confirms that only the BOJ coating has a very low coating resistance (Rc) and high coating capacitance (CPEc), which may be due to the presence of microcracks and pores through which electrolyte and water can pass. However, the increase in charge transfer resistance (Rct) and total resistance to corrosion (Rt) is attributed to the formation of a corrosion oxide/hydroxide layer at the steel–coating interface, which protects steel from further corrosion. The composite coatings show higher coating resistance (Rc), charge transfer resistance (Rct) and total resistance to corrosion (Rt) compared to only the BOJ coating. In case of the BOJ-CNT coating, the higher resistance to corrosion is due to the presence of tortuous paths offered by CNTs and compact coating microstructure. The initial lower corrosion resistance of the BOJ-PANI@CeO2 coating compared with BOJ-CNT is attributed to the lower coating resistance; thereafter, the increase in corrosion resistance can be attributed to the ennobling effect and the subsequent formation of protective corrosion oxide film at the steel–coating interface. The reason of the most superior corrosion resistance of the BOJ-CNT-PANI-CeO2 coating is dedicated to the combinations of three different effects of lower coating porosity/microcracks, tortuous paths due to reinforcement and ennobling effect due to the presence of PANI@CeO2.Conflicts of interest
There are no conflicts to declare.Acknowledgements
The authors are grateful to Tata Steel limited for the generous funding support and IISc Bangalore for the facilities used in this study.References
- A. Chakraborty and R. Ray, Surf. Coat. Technol., 2009, 203, 1756–1764 CrossRef CAS.
- R. Jain, B. Bhagawati, P. Khandagiri, S. Shamshoddin, M. Bhadu, T. Rout and S. Das, Surf. Eng., 2017, 33, 410–427 CrossRef CAS.
- F. Kao, W. Li, C. Chen, C. Huang, J. Yang and S.-H. Wang, Mater. Sci. Eng., A, 2009, 499, 45–48 CrossRef.
- V. R. Capelossi and I. V. Aoki, Prog. Org. Coat., 2013, 76, 812–820 CrossRef CAS.
- H. Wang and R. Akid, Corros. Sci., 2007, 49, 4491–4503 CrossRef CAS.
- T. Sankara Narayanan, Rev. Adv. Mater. Sci., 2005, 9, 130–177 Search PubMed.
- J. S. Francisco, V. R. Capelossi and I. V. Aoki, Electrochim. Acta, 2014, 124, 128–136 CrossRef CAS.
- R. Z. Zand, K. Verbeken and A. Adriaens, Prog. Org. Coat., 2012, 75, 463–473 CrossRef.
- S. Bera, T. Rout, G. Udayabhanu and R. Narayan, Prog. Org. Coat., 2016, 101, 24–44 CrossRef CAS.
- W.-G. Ji, J.-M. Hu, L. Liu, J.-Q. Zhang and C.-N. Cao, Prog. Org. Coat., 2006, 57, 439–443 CrossRef CAS.
- Y. Ding, H. Hou, Y. Zhao, Z. Zhu and H. Fong, Prog. Polym. Sci., 2016, 61, 67–103 CrossRef CAS.
- D.-J. Liaw, K.-L. Wang, Y.-C. Huang, K.-R. Lee, J.-Y. Lai and C.-S. Ha, Prog. Polym. Sci., 2012, 37, 907–974 CrossRef CAS.
- D. Chao, L. Cui, X. Lu, H. Mao, W. Zhang and Y. Wei, Eur. Polym. J., 2007, 43, 2641–2647 CrossRef CAS.
- M. Han, H. Bie, D. E. Nikles and G. W. Warren, J. Polym. Sci., Part A: Polym. Chem., 2000, 38, 2893–2899 CrossRef CAS.
- C.-J. Weng, J.-Y. Huang, K.-Y. Huang, Y.-S. Jhuo, M.-H. Tsai and J.-M. Yeh, Electrochim. Acta, 2010, 55, 8430–8438 CrossRef CAS.
- K.-Y. Huang, Y.-S. Jhuo, P.-S. Wu, C.-H. Lin, Y.-H. Yu and J.-M. Yeh, Eur. Polym. J., 2009, 45, 485–493 CrossRef CAS.
- E. Huttunen-Saarivirta, V. Yudin, L. Myagkova and V. Svetlichnyi, Prog. Org. Coat., 2011, 72, 269–278 CrossRef CAS.
- M. B. Ahmad, Y. Gharayebi, M. S. Salit, M. Z. Hussein and K. Shameli, Int. J. Mol. Sci., 2011, 12, 6040–6050 CrossRef PubMed.
- T. Rout, G. Jha, A. Singh, N. Bandyopadhyay and O. Mohanty, Surf. Coat. Technol., 2003, 167, 16–24 CrossRef CAS.
- E. Sanches, J. Soares, R. Iost, V. Marangoni, G. Trovati, T. Batista, A. Mafud, V. Zucolotto and Y. Mascarenhas, J. Nanomater., 2011, 2011, 73 Search PubMed.
- B. Ramezanzadeh, G. Bahlakeh and M. Ramezanzadeh, Corros. Sci., 2018, 137, 111–126 CrossRef CAS.
- M. Sababi, J. Pan, P.-E. Augustsson, P.-E. Sundell and P. M. Claesson, Corros. Sci., 2014, 84, 189–197 CrossRef CAS.
- P. H. Suegama, A. A. C. Recco, A. P. Tschiptschin and I. V. Aoki, Prog. Org. Coat., 2007, 60, 90–98 CrossRef CAS.
- B. D. Mert, Corros. Sci., 2016, 103, 88–94 CrossRef.
- D. I. Njoku, M. Cui, H. Xiao, B. Shang and Y. Li, Sci. Rep., 2017, 7, 15597 CrossRef PubMed.
- Y. Zuo, R. Pang, W. Li, J. Xiong and Y. Tang, Corros. Sci., 2008, 50, 3322–3328 CrossRef CAS.
- S. Jafarzadeh, A. Adhikari, P.-E. Sundall and J. Pan, Prog. Org. Coat., 2011, 70, 108–115 CrossRef CAS.
- K. Sarkar, P. Rai, P. K. Katiyar, B. Satapathy, A. S. Pathak, M. Dutta, A. Banerjee and K. Mondal, Surf. Coat. Technol., 2019, 372, 72–83 CrossRef CAS.
- M. Sánchez, J. Gregori, C. Alonso, J. García-Jareño, H. Takenouti and F. Vicente, Electrochim. Acta, 2007, 52, 7634–7641 CrossRef.
- X. Yuan, Z. Yue, X. Chen, S. Wen, L. Li and T. Feng, Prog. Org. Coat., 2015, 86, 41–48 CrossRef CAS.
- A. M. Kumar and Z. M. Gasem, Prog. Org. Coat., 2015, 78, 387–394 CrossRef.
- H. Jeon, J. Park and M. Shon, J. Ind. Eng. Chem., 2013, 19, 849–853 CrossRef CAS.
- S. Pourhashem, E. Ghasemy, A. Rashidi and M. R. Vaezi, J. Coat. Technol. Res., 2020, 17, 19–55 CrossRef CAS.
- A. Radhamani, H. C. Lau and S. Ramakrishna, J. Compos. Mater., 2020, 54, 681–701 CrossRef CAS.
- A. Hosseinpour, M. R. Abadchi, M. Mirzaee, F. A. Tabar and B. Ramezanzadeh, Surf. Interfaces, 2021, 23, 100994 CrossRef CAS.
- J.-T. Zhang, J.-M. Hu, J.-Q. Zhang and C.-N. Cao, Prog. Org. Coat., 2004, 51, 145–151 CrossRef CAS.
- J. Zhang, J. Hu, J. Zhang and C. Cao, Prog. Org. Coat., 2004, 49, 293–301 CrossRef CAS.
- R. Naderi, M. Attar and M. Moayed, Prog. Org. Coat., 2004, 50, 162–165 CrossRef CAS.
- F. Deflorian, L. Fedrizzi, S. Rossi and P. Bonora, Electrochim. Acta, 1999, 44, 4243–4249 CrossRef CAS.
- N. Khun, B. R. Troconis and G. Frankel, Prog. Org. Coat., 2014, 77, 72–80 CrossRef CAS.
Footnote |
| † Equal contribution. |
| This journal is © The Royal Society of Chemistry 2024 |

