 Open Access Article
Utilizing pi-peptide supramolecular polymers to template growth of hybrid organic–inorganic electronic materials†
Grant E. K.
Hall‡
a,
Taein
Lee‡
b,
John D.
Tovar
 a and
Howard E.
Katz
 *ab
*ab
aDepartment of Chemistry, Johns Hopkins University, 3400 North Charles Street, Baltimore, MD 21218, USA. E-mail: hekatz@jhu.edu
bDepartment of Materials Science and Engineering, Johns Hopkins University, 3400 North Charles Street, Baltimore, MD 21218, USA
First published on 23rd April 2024
Abstract
We investigated and compared the growth of three different minerals (KCl, CsCl, and CdS) templated by assemblies of perylene diimide (PDI)-based π-peptides with varying amino acid sequences. KCl and CsCl were chosen since they are single cation-anion minerals with very different cationic radii. Further, KCl is an insulator while CsCl has low ionic conductivity. CdS is a more optoelectronically active material that serves as a prototype for minerals that could form electronically conductive or potentially photoconductive pathways. KCl and CsCl morphologies were dependent on the templating peptide, with varying degrees of density and branching of mineral deposits and polymorphism shown in X-ray diffractograms. The mineralization also affected peptide absorbance spectra, indicating different aggregate electronic arrangements. While KCl under conditions used here formed thick, electrically insulating deposits, CsCl deposits showed peptide-dependent ionic conductivity. CdS templated by one of the π-peptide materials showed less definitive templating, but morphology that was more directional than the non-templated case. Substantial electronic conductivity was measured for this latter case. These results indicate the potential to utilize π-peptide templated growth of minerals to form controllable hybrid organic/inorganic structures for multiple electrical applications.
Introduction
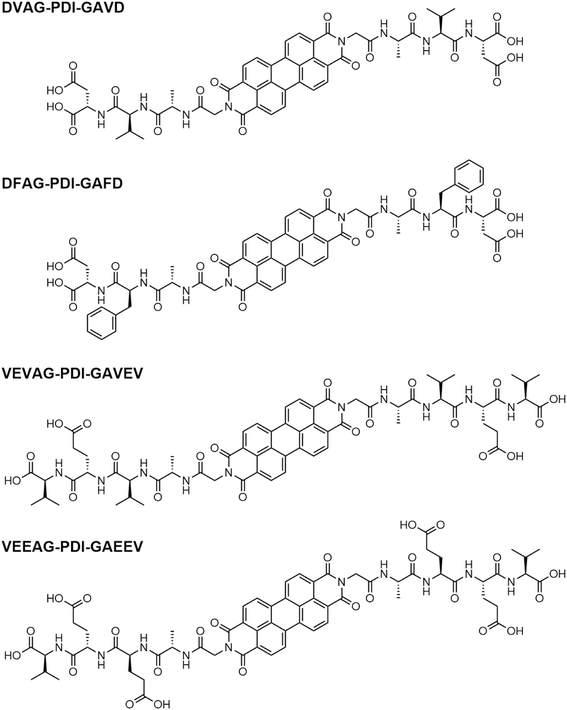
Organic–inorganic hybrid materials have attracted increasing attention due to their wide-ranging applications and relatively mild preparations.1,2 The combination of organic and inorganic materials results in the synthesis of hybrid materials with properties greater than the sum of their individual parts, owing to the formation of a large hybrid interface that opens the door for many innovative applications.1,3 Nature has long utilized organic–inorganic hybrid materials, where organic polymers such as chitin or collagen act as templates for the growth of highly complex mineral structures utilizing silica, magnetite, calcium carbonate, calcium phosphate, and others to form the cell walls of diatoms, the bones and teeth of animals, the shells of marine organisms, and countless other essential biological features throughout the natural world. In fact, optical waveguiding was demonstrated in sea sponge spicules resulting from hierarchically organized silica nanoparticles dispersed in an organic composite material.4,5 Artificial hybrid organic–inorganic materials have subsequently been developed enabling applications such as high solar conversion efficiency perovskite solar cells,6 materials with enhanced surface area for energy storage,7 light harvesting for photocatalyzed hydrogen fuel production,8,9 optical amplification in channel waveguides,10 efficient fluorescent molecular switches for fluorescence microscopy,11 conducting12,13 or semiconducting14–16 materials, flexible materials for piezoelectric mechanical energy harvesting,17 biological applications such as sensors or catalysts,18 and many others.Weak non-covalent supramolecular forces influence the formation of hybrid materials,19–21 drawing many parallels to the general mechanisms of supramolecular organic assemblies driven by electrostatic, van der Waals, and π-interactions, to create complex structures that are highly tunable through careful engineering.22–24 For example, supramolecular materials based on self-assembling peptides are well-documented and have been prepared with a wide range of secondary structures including fibrils, sheets, tubes, and spheres.25–27 To create further functionality, π-conjugated systems can be integrated into supramolecular materials to allow the function of their tunable pi-conjugated nature to be realized within nanoscale architectures of electronically relevant materials.19,28,29 For example, π-peptide amphiphiles can self-assemble into ordered nanostructures, in response to changes in ionic strength or pH.30–32 These materials allow for good electronic conjugation and take advantage of the benefits of a more soluble and easily tunable peptide scaffold.33,34 We previously found that some of these assembled pi-peptides can template the growth of mineral structures to form complex organic–inorganic hybrid materials. Surprisingly, these well-connected dendritic mineralized structures were found to be highly conductive.35 We demonstrated the relationship between the mineralization morphology and the properties of the assembled peptides, where different amino acid residues induced variations in absorbance energy shifts upon self-assembly, subsequently resulting in changes to both the structures of the templated minerals and the electrical properties.36 Here, we investigate templated mineral growth and its influence in hybrid systems of self-assembling π-peptides shown in Scheme 1.
By incorporating aspartic acid or glutamic acid residues into the π-peptide amphiphiles, changes in pH result in changes to the ionization of the carboxylic acid moieties. In acidic solution, hydrogen bonding and other intermolecular forces drive the spontaneous self-assembly of the π-peptide amphiphiles, while in basic conditions the formally charged carboxylate residues are better solvated by water and thus assembly is disrupted.37,38 Fine tuning of parameters such as amino acid sequence, the identity of the π-system and alkyl spacers can be harnessed to engineer different structures.39–43 Solid-phase peptide synthesis (SPPS) can be used to easily change the peptide sequence offering facile tuning of acidity, hydrophobicity, sterics, polarity, π-interactions, etc. within the macromolecule.44,45 Our group used SPPS to perform on-resin dimerizations onto a central chromophore, yielding a unique tri-block peptide where a π-moiety is flanked with symmetrical peptide chains that drive the embedded chromophore into π-stacked configurations.41,46–48
Although small peptides and proteins are well established to foster the growth of a variety of inorganic minerals, in the present work, we further develop the additional functionality of organic semiconductors that could potentially interface with electronically- and energetically-relevant inorganic materials. Unlike our previous work (ESI†) where mineralization served as an indicator of the properties of the underlying peptide assembly, we now focus on the mineral itself as the dominant structure- and property-controlling factor. We consider three different minerals (KCl, CsCl, and (semiconducting) CdS) for perylene diimide (PDI)-based π-peptides with varying amino acid sequences: DVAG-PDI-GAVD, DFAG-PDI-GAFD, VEVAG-PDI-GAVEV, and VEEAG-PDI-GAEEV. KCl and CsCl were chosen since they are single cation–anion minerals with very different cationic radii. Further, KCl is an insulator while CsCl has low ionic conductivity of around 10−7 S cm−1 at room temperature.49 CdS is a more optoelectronically active material that serves as a prototype for minerals that could form electronically conductive and photoconductive pathways.50 The π-peptides were chosen based on previous work that indicated that glycine residues closest to the π-core induced co-facial stacking and more connected dendritic macrostructures, and perylene diimide was chosen as the chromophore because it is a well-established system for charge-transporting π-systems.34,51,52 VEVAG-PDI was chosen as it exhibits co-facial chromophore stacking and connected dendritic macrostructures based on previous work.35,36,43,51,53,54 VEEAG-PDI was selected to observe the effect of an additional glutamic acid residue in the peptide chain because carboxylate-containing sidechains are often found in peptides involved with biomineralization.55,56 DVAG-PDI and DFAG-PDI were chosen to observe the effect of a side chain that contains a moiety that could undergo additional structure-driving π-stacking interactions (phenylalanine) compared to a smaller hydrophobic side chain (valine).57
Experimental methods
Peptide synthesis
DVAG-PDI, DFAG-PDI, VEVAG-PDI, and VEEAG-PDI were prepared according to previously reported protocols using SPPS.51UV-vis spectroscopy
Solid-phase UV-vis absorbance measurements were taken using a Perkin-Elmer Lambda 950 UV-vis–NIR Spectrophotometer. The samples were taped to a metal mounting bracket with a 1 cm diameter aperture, which was aligned with the beam and fixed to the front of the 150 mm integrating sphere.Electrospray ionization mass spectrometry (ESI-MS)
ESI samples were collected using a Thermo LCQ Fleet ion trap mass spectrometer in negative mode. Samples were prepared in a 1![[thin space (1/6-em)]](https://www.rsc.org/images/entities/char_2009.gif) :
:![[thin space (1/6-em)]](https://www.rsc.org/images/entities/char_2009.gif) 1 water
1 water![[thin space (1/6-em)]](https://www.rsc.org/images/entities/char_2009.gif) :
:![[thin space (1/6-em)]](https://www.rsc.org/images/entities/char_2009.gif) 2% ammonium hydroxide in MeOH solution.
2% ammonium hydroxide in MeOH solution.
Solid-state thin film device fabrication
Borosilicate glass (BSG) substrates were cleaned using the following procedures: immersion in piranha solution with 3![[thin space (1/6-em)]](https://www.rsc.org/images/entities/char_2009.gif) :
:![[thin space (1/6-em)]](https://www.rsc.org/images/entities/char_2009.gif) 1 ratio of sulfuric acid to hydrogen peroxide for 1 day (CAUTION—HIGHLY CORROSIVE AND TOXIC), rinsing in DI running water for 10 minutes, sonication in acetone for 10 minutes, rinsing in DI running water for 10 minutes, and sonication in isopropanol for 10 minutes. Peptides were dissolved in solution at a concentration of 1 wt% with base (1 M KOH or CsOH) of 2–3 molar equivalents to π-peptide, drop-cast onto the cleaned substrates, and immediately exposed to HCl vapor in an inverted cylindrical glass beaker for 5 minutes. After HCl vapor chamber exposure, the π-peptide solutions were left to dry into solid-state thin films while undergoing self-assembly and templating mineralization overnight for 1 day. These procedures are outlined in Fig. S1† for top electrode on π-peptide thin films and in Fig. S2† for bottom electrode below π-peptides thin films.
1 ratio of sulfuric acid to hydrogen peroxide for 1 day (CAUTION—HIGHLY CORROSIVE AND TOXIC), rinsing in DI running water for 10 minutes, sonication in acetone for 10 minutes, rinsing in DI running water for 10 minutes, and sonication in isopropanol for 10 minutes. Peptides were dissolved in solution at a concentration of 1 wt% with base (1 M KOH or CsOH) of 2–3 molar equivalents to π-peptide, drop-cast onto the cleaned substrates, and immediately exposed to HCl vapor in an inverted cylindrical glass beaker for 5 minutes. After HCl vapor chamber exposure, the π-peptide solutions were left to dry into solid-state thin films while undergoing self-assembly and templating mineralization overnight for 1 day. These procedures are outlined in Fig. S1† for top electrode on π-peptide thin films and in Fig. S2† for bottom electrode below π-peptides thin films.
Solid-phase UV-vis sample preparation
5 mg mL−1 solutions of each pi-peptide were prepared (∼4 mM), made soluble using 4.4 equivalents of base, added from 0.1 M stock solutions of KOH or CsOH. 100 uL of this basified solution were deposited onto an Ossila ultra-flat 20 nm synthetic quartz coated polished soda lime, float glass substrate. The samples were then immediately put into a chamber of ∼2 L capacity, which contained a full uncapped 20 mL vial of concentrated 12 N HCl, for 5 minutes. After the acid chamber exposure, the samples were removed and left to dry slowly in a partially covered petri dish.CdS sample preparation
Briefly, the DFAG peptide was dissolved in DI water at a concentration of 1 wt% with the minimum amount of added amount of ammonium hydroxide for solubility. 5 μL of this solution was placed on a substrate and 1 molar equivalent of thioacetamide (compared to π-peptide) was added as a source of H2S serving as sulfide and as an acid to initiate self-assembly of the DFAG. Subsequently, 5 μL of aqueous cadmium acetate dihydrate (Cd(OCOCH3)2·(H2O)2, CdA) (0.01 M for electrical experiments and 1 M for XRD) was added into the solution for growth of CdS templated by the self-assembling π-peptides. Both thioacetamide and cadmium acetate were bought from Sigma Aldrich and used as is.In more detail, for CdS samples for spectroscopy, 5 mg mL−1 solutions of pi-peptide were prepared, made soluble using minimal amounts of NH4OH. 100 uL of this solution were deposited onto an Ossila ultra-flat 20 nm synthetic quartz coated polished soda lime, float glass substrate. The samples were then immediately put into a chamber of ∼2 L capacity, which contained a full uncapped 20 mL vial of glacial acetic acid, for 10 minutes. After the acid chamber exposure, the samples were removed and left to dry slowly in a partially covered petri dish. Once the film was fully dry, cadmium acetate solution (50 μL, 0.01 M aqueous), and thioacetamide solution (50 μL, 0.1 M aqueous) were mixed together on a sheet of parafilm on the benchtop and then immediately deposited onto the substrate. The substrate was then left to dry slowly in a humid chamber (2 L capacity, damp Kimwipe added to make it humid).
For CdS samples for electrical measurements, 5 mg mL−1 solutions of pi-peptide were prepared, made soluble using minimal amounts of NH4OH. 100 uL of this solution were deposited onto an Ossila ultra-flat 20 nm synthetic quartz coated polished soda lime, float glass substrate. The samples were then immediately put into a chamber of ∼2 L capacity, which contained a full uncapped 20 mL vial of glacial acetic acid, for 10 minutes. After the acid chamber exposure, the samples were removed and left to dry slowly in a partially covered petri dish. Once the film was fully dry, cadmium acetate solution (100 μL, 0.01 M aqueous) was deposited onto the substrate. While the substrate was still wet, a balloon was filled with H2S gas (∼1 L), and the neck was pinched under the lip of an inverted crystallizing dish (2 L capacity) that housed the substrate. The H2S gas was left to slowly release into the chamber. The balloon was refilled and replaced once, so the volume of H2S gas was approximately 2 L. The sample was left to dry slowly.
Electrical measurements
50 nm of gold was thermally evaporated using an Edwards 306 auto evaporator at a rate of 0.4 Å s−1 over the solid-state thin film using a 200 mesh TEM grid patterned mask, or masks patterned to accommodate four-point conductivity measurements. Resistance was measured using a four-probe method with an Agilent 4155C Semiconductor Parameter Analyzer. Two-terminal measurements were measured in atmosphere (humidity 40–65%) on a probe stage using Keithley 4200 and Agilent 4155C as parameter analyzers. Conductivity values were extracted using eqn (1):| σ = l/(t × w × R) | (1) |
Thin film X-ray diffraction (XRD) characterization
This was performed using a Bruker D8 Focus diffractometer (λ = 1.5424 Å) with a LynxEye detector. Both Cu k-α 1 and 2 were used for the XRD with sample to detector distance 200.5 mm and a linear position-sensitive detector. Scans were performed at 0.1 s per step in 0.01 degrees increments from 5 to 60 2 theta degrees for all XRD measurements.3D laser optical scanning microscopy
All optical, laser, and 3D microscope images as well as roughness profile measurements were acquired using a Keyence VK-X 100 laser microscope.Scanning electron microscopy/energy dispersive X-ray spectroscopy (SEM/EDS)
All samples were coated with 5–7 nm of Cr using a thermal evaporator before SEM/EDS to prevent burning of the organic solid-state thin films from the electron beam in the SEM. All Cr coated samples were observed under a Tescan MIRA 3 GMU for SEM images at 15–20 keV with working distances between 5 and 20 mm. All EDS data were acquired using an AMATEK EDAX Octane Plus.Results and discussion
Guiding summary paragraph
The results are presented according to the information obtained from X-ray diffraction, microscopy, UV-visible absorbance, and conductance measurements. The effects of incorporating different amino acids in the side chains are brought out in each case, especially the consequences of the terminal and near-terminal COOH-containing amino acids D (aspartic acid) and E (glutamic acid). The COOH functional groups likely bind to cations of the mineralizing salts, with mutual influences on morphologies of the peptide assemblies and the minerals grown.X-ray diffraction
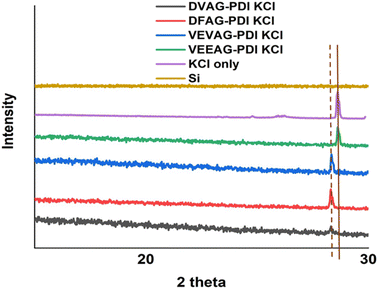
Thin films of hybrid organic/inorganic systems were fabricated on substrates following the procedures outlined in Fig. S1 and S2,† first using KOH base and later CsOH base, and subsequent HCl acid exposure. The molar ratios of KOH base used here to dissolve the π-peptides were intentionally higher than in our previous report36 in order thoroughly investigate the effect of self-assembly on formation of minerals thoroughly. The crystal planes in the KCl films were identified by XRD as shown below (Fig. 1).VEEAG-PDI, which had the largest macrostructures (see below), had KCl peaks almost identical to KCl-only XRD peaks. VEVAG-PDI had the next closest XRD peak to raw KCl, suggesting some degree of straining the KCl to a larger crystal lattice, thus decreasing the 2-theta XRD peak of KCl. The other π-peptides, DVAG, and DFAG-PDI showed shifted KCl peaks to even lower 2-theta degrees, implying larger KCl crystal lattices due to the underlying self-assembling π-peptides, which can induce subsequent mineralization.58 It is possible that intergrowths of the metal halide lattice resulting from the degree of self-assembly that functions as precursors for mineralization causes lattice strain. These observations suggest that the numbers and the relative positions of the acidic side chain residues play a role in influencing the nature of the interfacial mineralization. Thus, the terminal COOH residue D had a greater effect on the KCl lattice than did the VEVAG, with E as the second residue. The EE pair had the least effect, possibly because the adjacent E residues interacted with each other thus tempering strong interactions with KCl.
As shown in Fig. 2, all observed CsCl peaks of peptide self-assembly templated CsCl were slightly shifted to a lower two-theta degree, indicating a larger lattice constant than pure CsCl.58 This influence of CsCl on morphology was less than that of KCl, consistent with the larger Cs+ ion interacting less specifically with small organic residues. The morphologies varied according to the XRD with VEEAG and DFAG-PDI/CsCl, which had the strongest XRD peaks, also exhibiting smaller macrostructures as will be seen later, though it was not possible to assign a systematic reason for this. Similarly, these differences result in differential electrical conductivity of the hybrid macrostructures as will be seen below, where VEEAG and DFAG-PDI/CsCl show lower conductivity compared to VEVAG and DVAG-PDI/CsCl, which had more interconnected CsCl morphologies. It is possible that “pure CsCl” has evidence of a polymorph that is related to the diffraction pattern seen in the templated minerals.
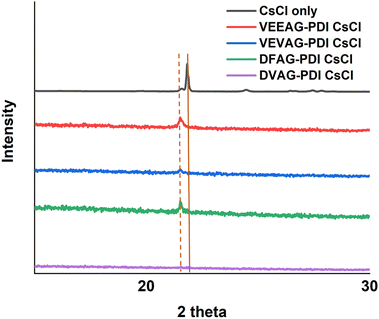 | ||
| Fig. 2 XRD scans show formation of CsCl for π-peptide/CsCl hybrid structures. The peak position is consistent with a published diffractogram.59 | ||
With the experience gained from the KCl and CsCl studies, we attempted the more challenging task of controlled growth of the much less soluble but more optoelectronically active CdS. Using 1 M cadmium acetate (CdA) and with thioacetamide forming excess H2S, sufficient CdS was formed to provide an X-ray diffraction peak corresponding to the widely observed broad (111) diffraction from CuKα radiation as shown in Fig. 3.60–62 A similar peak was observed in the absence of the peptide for CdS-only samples.
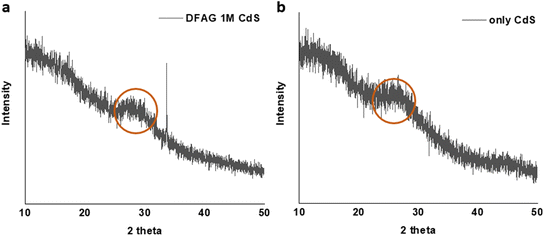 | ||
| Fig. 3 X-ray diffractograms of deposited CdS, with (a) and without (b) peptide. The broad peak is in a typical region for (111) diffraction of this mineral. | ||
Microscopic morphologies and elemental compositions
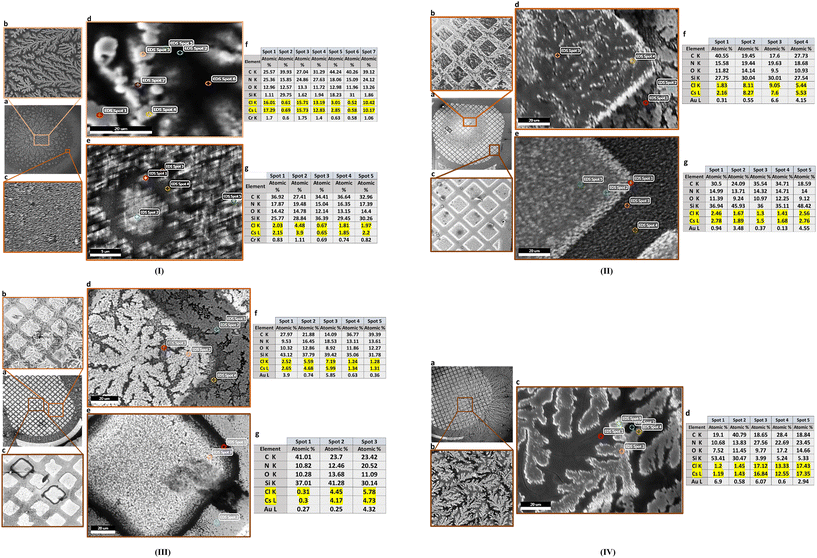
Fig. 4 shows laser micrographs of hybrid DVAG-PDI, DFAG-PDI, VEVAG-PDI, and VEEAG-PDI/KCl systems. Micrographs showing spots for EDS elemental compositional analysis are shown in Fig. 5. EDS analysis indicated KCl in the dendritic macrostructures as shown by higher K and Cl content in EDS spots scanned in dendritic regions for all 4 π-peptides (Fig. 5). Thus, connected dendritic macrostructures were composed of KCl minerals templated by the self-assembling π-peptides, forming hybrid organic/inorganic structures. It is noted that DVAG-PDI and DFAG-PDI have notably fewer branching dendrites from templated growth of KCl, which could again be a manifestation of differential acidic residue presentation (Fig. 4a and b). The terminal D groups again seemed to have the strongest morphology-directing effect, this time enforcing a more linear growth, parallel to peptide assembly strands. VEVAG-PDI and VEEAG-PDI/KCl systems (Fig. 4c and d) showed more regularly branching dendritic macrostructures, with the EE pair allowing the most growth perpendicular to the strand directions, a sign of the least control of the growth morphology, consistent with the XRD observations above.35,36,43,51,53 As the macroscopic dendritic KCl minerals are found on the top of the film, it is likely that there is a Volmer–Weber type growth mode of KCl minerals, where interaction of the mineral ions with the amino acid residues is stronger than the interaction of those ions with the substrate surfaces.63 This may be causing formation of clusters that function as nucleation sites for KCl, templated by the self-assembling π-peptides.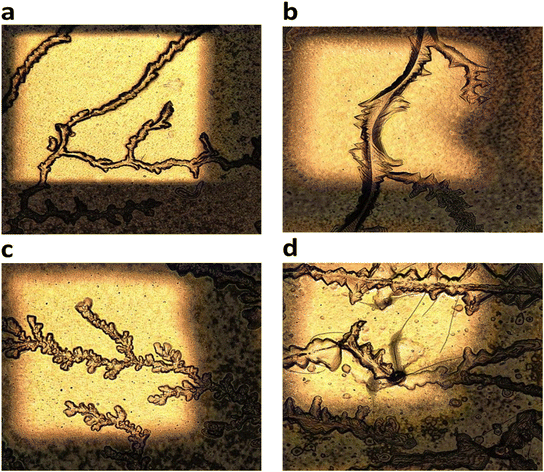 | ||
| Fig. 4 50× laser optical microscope images showing morphology of hybrid organic/inorganic (KCl) thin films and SEM/EDS. (a) DVAG-PDI (b) DFAG-PDI (c) VEVAG-PDI and (d) VEEAG-PDI. | ||
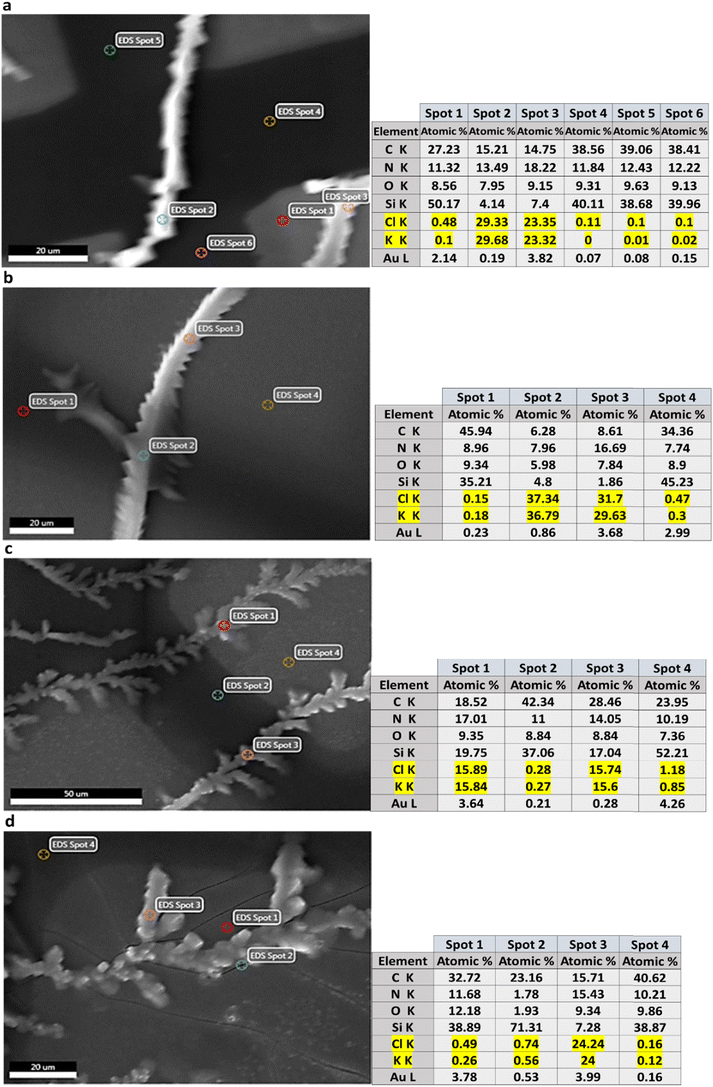 | ||
| Fig. 5 SEM image showing EDS spots and elemental point analysis for (a) DVAG-PDI/KCl (b) DFAG-PDI/KCl (c) VEVAG-PDI/KCl and (d) VEEAG-PDI/KCl. | ||
The dendritic regions of DVAG-PDI/CsCl hybrid nanowires (Fig. 6-I) were not fully connected but consisted of close but separate islands of CsCl. Seemingly empty regions at the edge of the sample were also full of small islands that ranged from hundreds of nanometers to tens of microns. It is likely that there are even smaller islands of tens of nanometer sized hybrid structures towards the edge of the sample. The formation of islands is due to Volmer–Weber type growth, promoting interaction between molecules instead of interfaces. Smaller hybrid aggregates are located at the edge of the sample because it is the part of the sample that dries first, resulting in less time for π-peptide to self-assemble upon re-protonation by acidification, allowing less time for the CsCl crystals to nucleate and grow. Hence, larger hybrid aggregates are found towards the center of the thin film. This is because there was time for self-assembly of π-peptides, nucleation and growth of CsCl, and Ostwald ripening for small hybrid aggregates absorbed into larger aggregates to reach more stable energy states by minimizing surface area.
Morphologies were determined and elemental composition measured for CsCl hybrid structures (Fig. 6-I–IV). One obvious difference was that the size of the dendrite macrostructure was smaller for DFAG-PDI/CsCl compared to DVAG-PDI/CsCl (which did not show an obvious diffraction peak in Fig. 2). SEM/EDS of the highly dendritic regions of VEEAG shows the greatest percentage of N within dendritic macrostructures than any other hybrid structure, implying higher density of π-peptide material within these dendrites (Fig. 6-IV d), which could be attributed in part to the greater density of acidic residues in the underlying pi-peptide nanostructures. VEVAG-PDI/CsCl thin films did not have any seemingly blank regions, only a thick layer of hybrid structures in the middle of the sample (Fig. 6III a). Accordingly, SEM images were also taken for dendritic areas that exhibited similar characteristics as those of DVAG and DFAG-PDI.
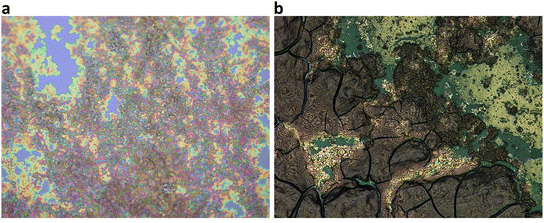
While the morphology of CdS using 1 M cadmium acetate was thick plates as shown in Fig. S3a,† a more finely structured deposit was formed using 0.01 M cadmium acetate as shown in Fig. S3b.† DFAG 0.01 M CdS showed similar finely structured deposits, but with a greater degree of directional segregation due to the template growth of CdS from the self-assembly of DFAG peptides (Fig. 7a), which had been generally observed to interact strongly with the KCl and CsCl deposits. Again, using 1 M cadmium acetate resulted in thick plates, even with the peptide (Fig. 7b).
UV-visible spectroscopy
When mineralized with KCl, three of the peptides displayed qualitatively similar UV-vis absorption spectra (Fig. 8, left).51 Although all four peptides promote strong cofacial pi-stacking (so-called Type I stacking), the nature of the chromophore coupling varied, as evidenced by the subtle peak shifts and intensity changes in the mid-energy visible region.64 VEEAG, with two COOH groups, appears to be an outlier compared to the other three peptides with only one COOH group, in that the 515 nm feature is broadened and enhanced, a sign of a variation in the intramolecular stacking51 that could have also led to the least directionally-selective KCl growth.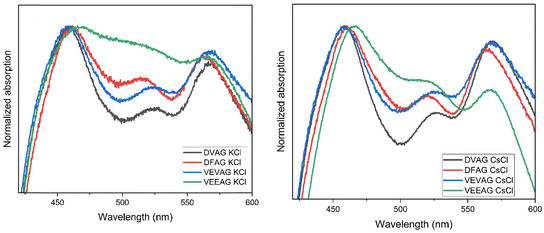 | ||
| Fig. 8 Solid-phase UV-vis absorbance spectra of DVAG-, DFAG-, VEVAG-, and VEEAG-PDI mineralized with KCl (left) or CsCl (right). | ||
When mineralized with CsCl, DVAG-PDI had similar UV-vis absorption peaks at ca. 460 and 565 nm as found after KCl mineralization (Fig. 8, right). The trends in the mid-energy feature were also similar, with those for DFAG and VEEAG around 520 nm while those for VEVAG and DVAG were around 526 nm. When comparing the spectra of the CsCl mineralized peptides to the KCl mineralized peptides, the mid-energy intensity trend is consistent, although the peaks and valleys are slightly more resolved, and noticeably less noisy. The VEEAG spectrum deviates less from the other three with CsCl mineralization than it did with KCl mineralization, indicating again that Cs+ could be interacting less strongly with the peptides than did K+.
Evidence of the peptides interacting with the grown CdS was obtained from UV-vis spectroscopy (Fig. 9a and b). Measuring absorbance spectra of the heavily mineralized CdS samples that were prepared for electrical measurements proved difficult (Fig. S4†), so a modified CdS mineralization approach with thioacetamide (described in ESI†) was used to obtain the spectra. When mineralized in this way, the general shapes of the absorbance spectra were similar to those obtained when mineralized with KCl and CsCl, with evidence of CdS absorbance near and/or above 500 nm. DVAG has the lowest relative intensity of the low energy peak. DVAG and VEEAG have the lowest intensities for the middle peak, but the peak positions are all very similar. While these trends did not correspond to what had been observed for KCl and CsCl systems, they were distinct from un-mineralized systems. In un-mineralized systems, DFAG has the lowest relative intensity of the low energy peak and DVAG had the next lowest intensity. The middle peak intensities are similar, but DFAG is uniquely blue-shifted. Tovar et al. had previously reported that an organic electron acceptor outside the peptide assembly and the conjugated core subunits showed relatively independent absorbance spectra.65
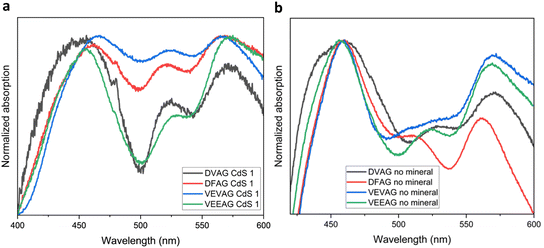 | ||
| Fig. 9 (a) Absorbance spectra of DVAG-, DFAG-, VEVAG-, and VEEAG-PDI mineralized with CdS. (b) Absorbance spectra of DVAG-, DFAG-, VEVAG-, and VEEAG-PDI without any mineralization. | ||
We and others have previously reported that different UV-vis responses arise from different inter-molecule interactions. For example, in our most recent paper we stated that absorbance changes represent structural and orientational reorganization of the peptides upon self-assembly, including π–π stacking interactions between the central π chromophores. Varying the amino acid closest to the central π-chromophore led to changes in peak positions for this reason. It has also been reported previously that large absorbance peak shifts compared to those in dilute solution correlate to better co-facial stacking in self-assembled nanoaggregates.66
Electrical conduction
The films were made into devices for electrical measurements to be discussed in the upcoming sections. Two different device configurations, top electrode and pre-fabricated bottom electrode devices, were utilized for different objectives.Electrical properties were measured by top and bottom electrodes. For KCl samples, top electrodes showed negligible current (Fig. S5†) due to extensive formation of insulating KCl throughout the thin film, even in seemingly empty areas. Thin films were also drop-cast on prefabricated bottom electrodes. Negligible currents indicated that insulating KCl was formed throughout the 3D volume of the sample with a higher concentration in the dendritic areas, in contrast to the structures formed using more dilute KOH in our previous work.
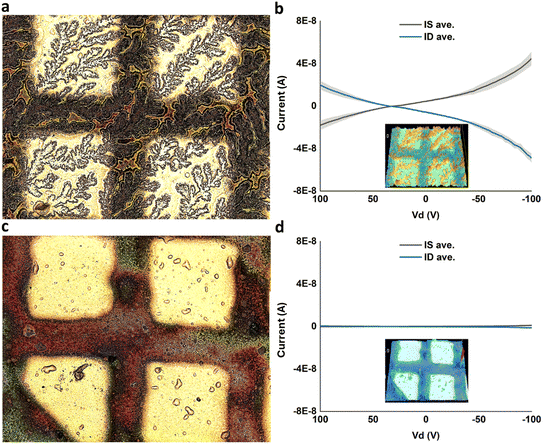
After thermally evaporating gold electrodes on top of DVAG-PDI/CsCl, electrical measurements showed observable conductance for dendritic regions and negligible currents for blank regions (Fig. 10). Conductivity was calculated based upon dimensions from previous work35 yielding 5.6 × 10⁻² S cm−1. This implied that conductivity is related to the very extended dendritic hybrid macrostructures of DVAG-PDI and CsCl (Fig. 6-I a).
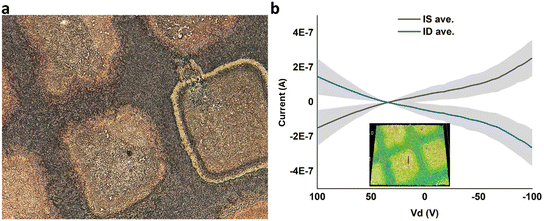
Subsequent to electrical measurements on VEVAG-PDI/CsCl, black linings were observed as shown in Fig. 6III c and e. The smudges on the electrodes in Fig. 6III c and e are marks left by the probe tip used for electrical measurements. Electrical measurements that were taken from the same electrode are shown in Fig. 11b. It is possible that the decrease in Cs-containing solid near the conducting path reflects migration of ions induced by the high local electric field.
DFAG-PDI/CsCl hybrids displayed decreased conductivity (Fig. S6†). Likewise, VEEAG-PDI/CsCl exhibited low conductivities similar to DFAG-PDI/CsCl hybrid systems (Fig. 10d).
Timed-testing of DVAG-PDI and DFAG-PDI hybrid systems with CsCl was consistent with an ionic conduction mechanism as determined by the rapid decrease in current over time due to build-up of ions at the gold electrode interface, forming a physical blockade (Fig. 12a and b). Decrease in current over time was rather slow for the ionic conduction observed in VEVAG-PDI/CsCl (Fig. 12c). VEEAG-PDI/CsCl was peculiar in that it showed no current throughout the whole run (Fig. 12d). A closer look revealed that current actually started increasing around 10 minutes into the timed testing, reaching a maximum current output at around 20 minutes, before declining (Fig. 12e) this behavior is could have occurred due to release of charges trapped in hybrid aggregates upon constant potential bias. The configuration is shown in Fig. 12f.
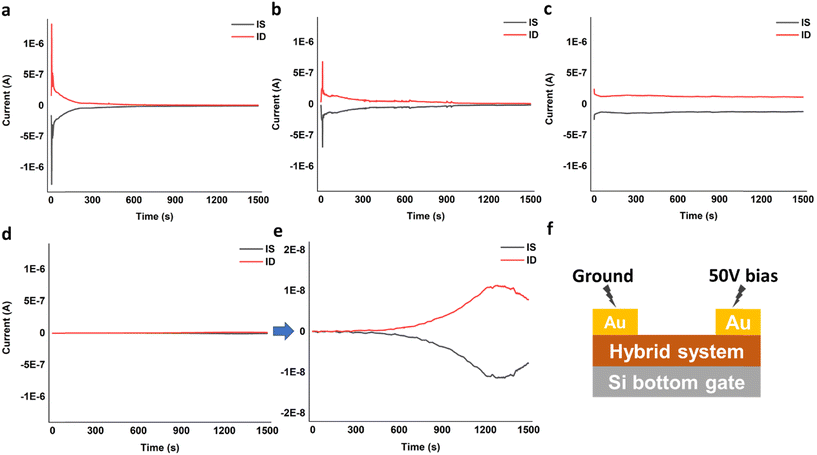 | ||
| Fig. 12 Timed-test measuring current at constant bias for (a) DVAG-PDI/CsCl, (b) DFAG-PDI/CsCl, (c) VEVAG-PDI/CsCl, and (d) and (e) VEEAG-PDI/CsCl. (f) Timed-test conditions on device configurations. | ||
Two-terminal electrical measurements of CdS samples are shown in Fig. 13a and b. The four-point-probe electrical conductivity of the DFAG-templated CdS from 0.01 M CdA was substantial, while the four-point probe conductivity of the templated deposit using 1 M CdA was much lower. The calculated four-point-probe conductivity of the DFAG-templated CdS from 0.01 M CdA was 1.6 S cm−1.
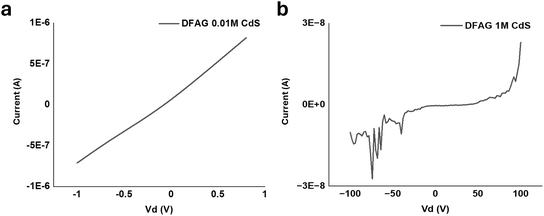 | ||
| Fig. 13 (a) 2-terminal electrical measurements of DFAG 0.01 M CdS, and (b) 2-terminal electrical measurements of DFAG 1 M CdS. | ||
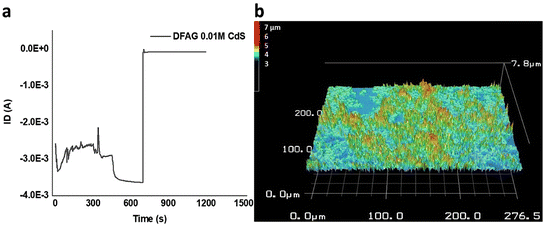
Timed electrical conductance tests on DFAG 0.01 M CdS samples further showed that about 3 mA of current was sustained for about 700 s before the current pathway rapidly disintegrated (Fig. 14). This is far greater conductance than we observed for CsCl samples discussed above and for related PDI peptides without mineralization.36 A detailed analysis of the conduction behavior based on the timed test points towards the conduction mechanism being most likely predominantly electronic, with the possibility of a small contribution of ionic conduction.67
3D scans of 0.01 M DFAG CdS (Fig. S15b†) show an average height of 1.5 μm of connected hybrid structures throughout the sample for around 30% of the surface. Considering excess thioacetamide (source of S) was mixed with 5 μL of cadmium acetate dihydrate (270 g mol−1), the number of molecules of Cd that were added to the sample was calculated to be 5 × 10⁻⁸ mol (3.0 × 10¹⁶ molecules).
We can assume that the conduction mechanism is therefore a hybrid of electronic and ionic conduction because:
1) The electrical measurements were limited to a small electrode pair region, not the whole sample containing 5 μL. However, even if all the cadmium were located in the electrode pair region, 3 mA levels of current would not have been sustained for over 10 s if conduction were ionic, implying that total number of charges moved well exceeded the potential amount of ionic conductivity even if cadmium was 2+ and 2) the rapid decrease in current at around 700 s shows current pathway disruption either by depletion of the cadmium and sulfur ions or disintegration of the electronic conduction pathway. Electrical data showing rapid decrease around 700 s but sustaining at around 7.5 × 10⁻⁵ Å implies disruption of electronic pathway perhaps by ionic movement rather than depletion of ions.
Conclusion
We analyzed morphological, structural, and electrical properties of 4 π-peptide molecules with the same π-cores and slightly different amino acid side chains, along with three minerals that were created via π-peptide self-assembly templated growth. Hybrid organic/inorganic structures' morphology and electrical properties were shown to be fundamentally affected by the amino acid sequences. Volmer–Weber type growth mode of hybrid structures along with Ostwald ripening prompted the growth of crystalline interconnected networks of hybrid structures. As KCl is insulating in nature, hybrid structures with KCl showed almost no conductance. CsCl, which is known to have low but measurable conductivity, displayed significant currents in the hybrid organic/inorganic structures; those currents were typically ionic. CdS, on the other hand, showed electronic conduction; templating of these minerals followed by the conductivity comparison is new in this work. Numbers and positions of acidic amino acid residues and the presence of K or Cs cations influence the branching, lattice spacings, absorbances, and ionic conductivities of mineralized microstructures, as pointed out in the main text.Overarching and potentially applicable trends in this work are that terminal versus second-from terminal and single versus paired internal COOH groups on amino acid side chains of oligopeptides can show distinguishable effects on lattice spacing of minerals whose growth they template, the capability of the peptides to direct mineral growth along their long axes, aggregation-induced UV-visible absorbance peaks of peptides after mineralization, and electrical conductivity of templated minerals. The effects were stronger for the smaller and more strongly coordinating K+ cation compared to Cs+, though templated CsCl showed much greater ionic conductivity than did KCl. A strongly interacting peptide (DFAG) was also capable of templating growth of CdS as an electronically conductive mineral. These results indicate the potential to utilize π-peptide templated growth of minerals to form controllable hybrid organic/inorganic structures for multiple electrical applications.
Conflicts of interest
There are no conflicts of interest to declare.Acknowledgements
We thank Sayak S. Panda for initial guidance and Yunjia Song for assistance with substrates. Initial studies for this project were funded by the National Science Foundation, DMREF program, grant number DMR-1728947.References
- M. Faustini, L. Nicole, E. Ruiz-Hitzky and C. Sanchez, Adv. Funct. Mater., 2018, 28, 1704158 CrossRef.
- C. Sanchez, B. Julián, P. Belleville and M. Popall, J. Mater. Chem., 2005, 15, 3559–3592 RSC.
- L. Nicole, C. Laberty-Robert, L. Rozes and C. Sanchez, Nanoscale, 2014, 6, 6267–6292 RSC.
- V. C. Sundar, A. D. Yablon, J. L. Grazul, M. Ilan and J. Aizenberg, Nature, 2003, 424, 899–900 CrossRef CAS PubMed.
- J. Aizenberg, J. C. Weaver, M. S. Thanawala, V. C. Sundar, D. E. Morse and P. Fratzl, Science, 2005, 309, 275–278 CrossRef CAS PubMed.
- J. H. Heo, S. H. Im, J. H. Noh, T. N. Mandal, C.-S. Lim, J. A. Chang, Y. H. Lee, H. Kim, A. Sarkar, M. K. Nazeeruddin, M. Grätzel and S. I. Seok, Nat. Photonics, 2013, 7, 486–491 CrossRef CAS.
- G. C. Lau, N. A. Sather, H. Sai, E. M. Waring, E. Deiss-Yehiely, L. Barreda, E. A. Beeman, L. C. Palmer and S. I. Stupp, Adv. Funct. Mater., 2018, 28, 1702320 CrossRef.
- A. S. Weingarten, A. J. Dannenhoffer, R. V. Kazantsev, H. Sai, D. Huang and S. I. Stupp, J. Am. Chem. Soc., 2018, 140, 4965–4968 CrossRef CAS PubMed.
- A. S. Weingarten, R. V. Kazantsev, L. C. Palmer, D. J. Fairfield, A. R. Koltonow and S. I. Stupp, J. Am. Chem. Soc., 2015, 137, 15241–15246 CrossRef CAS PubMed.
- P. Etienne, P. Coudray, J. Porque and Y. Moreau, Opt. Commun., 2000, 174, 413–418 CrossRef CAS.
- J. Fölling, S. Polyakova, V. Belov, A. van Blaaderen, M. L. Bossi and S. W. Hell, Small, 2008, 4, 134–142 CrossRef PubMed.
- P. K. Sekhar, Z. Moore, S. Aravamudhan and A. Khosla, Sensors, 2017, 17, 2759 CrossRef PubMed.
- J. D. Tovar, B. M. Rabatic and S. I. Stupp, Small, 2007, 3, 2024–2028 CrossRef CAS PubMed.
- Q. Zhang, T. Atay, J. R. Tischler, M. S. Bradley, V. Bulović and A. V. Nurmikko, Nat. Nanotechnol., 2007, 2, 555–559 CrossRef CAS PubMed.
- K. Besar, H. A. M. Ardoña, J. D. Tovar and H. E. Katz, ACS Nano, 2015, 9, 12401–12409 CrossRef CAS PubMed.
- B. C. Streifel, J. F. M. Hardigree, H. E. Katz and J. D. Tovar, J. Mater. Chem. C, 2014, 2, 7851–7858 RSC.
- W. Ji, B. Xue, Z. A. Arnon, H. Yuan, S. Bera, Q. Li, D. Zaguri, N. P. Reynolds, H. Li, Y. Chen, S. Gilead, S. Rencus-Lazar, J. Li, R. Yang, Y. Cao and E. Gazit, ACS Nano, 2019, 13, 14477–14485 CrossRef CAS PubMed.
- J. Zhu, M. Wen, W. Wen, D. Du, X. Zhang, S. Wang and Y. R. Lin, Biosens. Bioelectron., 2018, 120, 175–187 CrossRef CAS PubMed.
- J. V. Milić, Chimia, 2022, 76, 784 CrossRef PubMed.
- A. B. Descalzo, R. Martínez-Máñez, F. Sancenón, K. Hoffmann and K. Rurack, Angew. Chem., Int. Ed., 2006, 45, 5924–5948 CrossRef CAS PubMed.
- X. Yang, D. Yuan, J. Hou, A. C. Sedgwick, S. Xu, T. D. James and L. Wang, Coord. Chem. Rev., 2021, 428, 213609 CrossRef CAS.
- J. M. Lehn, Science, 1993, 260, 1762–1763 CrossRef CAS PubMed.
- T. Aida, E. W. Meijer and S. I. Stupp, Science, 2012, 335, 813–817 CrossRef CAS PubMed.
- E. P. Bruckner and S. I. Stupp, Polym. Int., 2022, 71, 590–595 CrossRef CAS.
- J. H. Collier and P. B. Messersmith, Adv. Mater., 2004, 16, 907–910 CrossRef CAS.
- M. Zelzer and R. V. Ulijn, Chem. Soc. Rev., 2010, 39, 3351–3357 RSC.
- R. Matmour, I. De Cat, S. J. George, W. Adriaens, P. Leclère, P. H. H. Bomans, N. A. J. M. Sommerdijk, J. C. Gielen, P. C. M. Christianen, J. T. Heldens, J. C. M. van Hest, D. W. P. M. Löwik, S. De Feyter, E. W. Meijer and A. P. H. J. Schenning, J. Am. Chem. Soc., 2008, 130, 14576–14583 CrossRef CAS PubMed.
- F. J. M. Hoeben, P. Jonkheijm, E. W. Meijer and A. P. H. J. Schenning, Chem. Rev., 2005, 105, 1491–1546 CrossRef CAS PubMed.
- E. Moulin, J.-J. Cid and N. Giuseppone, Adv. Mater., 2013, 25, 477–487 CrossRef CAS PubMed.
- E. T. Pashuck, H. Cui and S. I. Stupp, J. Am. Chem. Soc., 2010, 132, 6041–6046 CrossRef CAS PubMed.
- K. L. Niece, J. D. Hartgerink, J. J. J. M. Donners and S. I. Stupp, J. Am. Chem. Soc., 2003, 125, 7146–7147 CrossRef CAS PubMed.
- S. I. Stupp, V. LeBonheur, K. Walker, L. S. Li, K. E. Huggins, M. Keser and A. Amstutz, Science, 1997, 276, 384–389 CrossRef CAS PubMed.
- H. A. M. Ardoña and J. D. Tovar, Bioconjugate Chem., 2015, 26, 2290–2302 CrossRef PubMed.
- J. D. Tovar, Acc. Chem. Res., 2013, 46, 1527–1537 CrossRef CAS PubMed.
- T. Lee, S. S. Panda, J. D. Tovar and H. E. Katz, ACS Nano, 2020, 14, 1846–1855 CrossRef CAS PubMed.
- T. Lee, S. S. Panda, G. E. K. Hall, Y. Song, J. D. Tovar and H. E. Katz, Mater. Adv., 2023, 4, 1964–1977 RSC.
- M. J. Webber, E. A. Appel, E. W. Meijer and R. Langer, Nat. Mater., 2016, 15, 13–26 CrossRef CAS PubMed.
- S. S. Panda, H. E. Katz and J. D. Tovar, Chem. Soc. Rev., 2018, 47, 3640–3658 RSC.
- E.-K. Schillinger, E. Mena-Osteritz, J. Hentschel, H. G. Börner and P. Bäuerle, Adv. Mater., 2009, 21, 1562–1567 CrossRef CAS.
- D. A. Stone, L. Hsu and S. I. Stupp, Soft Matter, 2009, 5, 1990–1993 RSC.
- B. D. Wall, A. E. Zacca, A. M. Sanders, W. L. Wilson, A. L. Ferguson and J. D. Tovar, Langmuir, 2014, 30, 5946–5956 CrossRef CAS PubMed.
- B. D. Wall, Y. Zhou, S. Mei, H. A. M. Ardoña, A. L. Ferguson and J. D. Tovar, Langmuir, 2014, 30, 11375–11385 CrossRef CAS PubMed.
- S. S. Panda, K. Shmilovich, A. L. Ferguson and J. D. Tovar, Langmuir, 2019, 35, 14060–14073 CrossRef CAS PubMed.
- I. Coin, M. Beyermann and M. Bienert, Nat. Protoc., 2007, 2, 3247–3256 CrossRef CAS PubMed.
- A. M. Sanders, T. J. Dawidczyk, H. E. Katz and J. D. Tovar, ACS Macro Lett., 2012, 1, 1326–1329 CrossRef CAS PubMed.
- J. D. Tovar, Bioinspiration Biomimetics, 2017, 13, 015004 CrossRef PubMed.
- G. S. Vadehra, B. D. Wall, S. R. Diegelmann and J. D. Tovar, Chem. Commun., 2010, 46, 3947–3949 RSC.
- A. M. Sanders and J. D. Tovar, Supramol. Chem., 2014, 26, 259–266 CrossRef CAS.
- J. Arends and H. Nijboer, Solid State Commun., 1967, 5, 163–166 CrossRef CAS.
- E. D. Sone and S. I. Stupp, J. Am. Chem. Soc., 2004, 126, 12756–12757 CrossRef CAS PubMed.
- S. S. Panda, K. Shmilovich, N. S. M. Herringer, N. Marin, A. L. Ferguson and J. D. Tovar, Langmuir, 2021, 37, 8594–8606 CrossRef CAS PubMed.
- O. Dumele, J. Chen, J. V. Passarelli and S. I. Stupp, Adv. Mater., 2020, 32, 1907247 CrossRef CAS PubMed.
- S. S. Panda, K. Shmilovich, A. L. Ferguson and J. D. Tovar, Langmuir, 2020, 36, 6782–6792 CrossRef CAS PubMed.
- K. Shmilovich, R. A. Mansbach, H. Sidky, O. E. Dunne, S. S. Panda, J. D. Tovar and A. L. Ferguson, J. Phys. Chem. B, 2020, 124, 3873–3891 CrossRef CAS PubMed.
- S. Mann, Nature, 1988, 332, 119–124 CrossRef CAS.
- F. Nudelman and N. A. J. M. Sommerdijk, Angew. Chem., Int. Ed., 2012, 51, 6582–6596 CrossRef CAS PubMed.
- B. A. Thurston and A. L. Ferguson, Mol. Simul., 2018, 44, 930–945 CrossRef CAS.
- I. J. de Souza-Araujo, G. N. Guiaraes, R. A. Machado, R. E. Bertassoni, R. P. W. Davides and R. M. Puppin-Rontani, J. Dent., 2022, 121, 104111 CrossRef PubMed.
- K. Kumar, A. Palakkandy, C. Ravi Kant, N. C. Mehra, L. Makinistian and E. A. Albanesi, J. Phys. Chem. Solids, 2010, 71, 163–169 CrossRef CAS.
- X. Ai, Q. Wang, R. Zhu, H. Dong, Y. Yan, R. Liu and L. Ma, Mater. Res. Express, 2019, 6, 126423 CrossRef CAS.
- I. M. S. Mohammed, G. M. M. Gubari, M. E. Sonawane, R. R. Kasar, S. A. Patil, M. K. Mishra, V. V. Kutwade and R. Sharma, Appl. Phys. A: Mater. Sci. Process., 2021, 127, 597 CrossRef CAS.
- H. Derin and K. Kantarlı, Surf. Interface Anal., 2009, 41, 61–68 CrossRef CAS.
- S. Weiner and L. Addadi, Annu. Rev. Mater. Res., 2011, 41, 21–40 CrossRef CAS.
- C. R. Honick, S. S. Panda, L. R. O'Connor, J. D. Tovar and A. E. Bragg, J. Phys. Chem. C, 2023, 127, 1310–1319 CrossRef CAS.
- A. M. Sanders, T. J. Magnanelli, A. E. Bragg and J. D. Tovar, J. Am. Chem. Soc., 2016, 138, 3362–3370 CrossRef CAS PubMed.
- Z. Zhang, M. Liu, M. M. Ibrahim, H. Wu, Y. Wu, Y. Li, G. A. M. Mersal, I. H. El Azab, S. M. El-Bahy, M. Huang, Y. Jiang, G. Liang, P. Xie and C. Liu, Adv. Compos. Hybrid Mater., 2022, 5, 1054–1066 CrossRef CAS.
- B. X. Dong, Z. Liu, M. Misra, J. Strzalka, J. Niklas, O. G. Poluektov, F. A. Escobedo, C. K. Ober, P. F. Nealey and S. N. Patel, ACS Nano, 2019, 13, 7665–7675 CrossRef CAS PubMed.
Footnotes |
| † Electronic supplementary information (ESI) available. See DOI: https://doi.org/10.1039/d4lf00087k |
| ‡ These authors contributed equally to this work. |
| This journal is © The Royal Society of Chemistry 2024 |

