 Open Access Article
Creative Commons Attribution 3.0 Unported Licence
Correction: Metal–organic frameworks as conductivity enhancers for all-solid-state lithium batteries
Shruti
Suriyakumar
a,
Rohit M.
Manoj
a,
Sreelakshmy K.
Jayaprakash
a,
Sreelakshmi Anil
Kumar
a,
Keerthy P.
Sudhakaran
a,
Vinesh
Vijayan
b and
Manikoth M.
Shaijumon
*ac
aSchool of Physics, Indian Institute of Science Education and Research Thiruvananthapuram, Vithura, Thiruvananthapuram, Kerala 695551, India. E-mail: shaiju@iisertvm.ac.in
bSchool of Chemistry, Indian Institute of Science Education and Research Thiruvananthapuram, Vithura, Thiruvananthapuram, Kerala 695551, India
cCenter for Advanced Materials Research with International Engagement (CAMRIE), Indian Institute of Science Education and Research Thiruvananthapuram, Maruthamala PO, Vithura, Kerala 695551, India
First published on 28th October 2024
Abstract
Correction for ‘Metal–organic frameworks as conductivity enhancers for all-solid-state lithium batteries’ by Shruti Suriyakumar et al., RSC Appl. Interfaces, 2024, https://doi.org/10.1039/D4LF00263F.
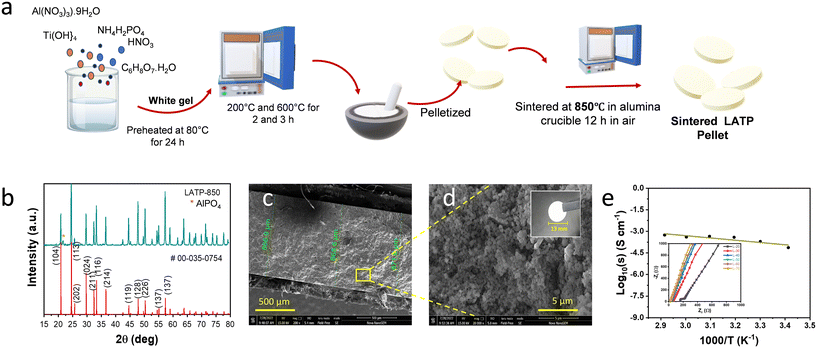
The authors regret that the units of impedance shown in Fig. 1e were incorrectly represented by KΩ. The correct unit which should be shown on the x and y axes of the inset graph should be Ω. The authors note that all the calculations based on this figure are presented correctly and this error is confined only to the units denoted. Below is the revised Fig. 1 showing corrected axis units within the inset graph of Fig. 1e.
Fig. S2 provided within the supplementary information has also been updated to reflect the same changes to the unit of impedance on the x and y axes of the inset graphs of Fig. S2a, S2b and S2c as seen below.
The Royal Society of Chemistry apologises for these errors and any consequent inconvenience to authors and readers.
| This journal is © The Royal Society of Chemistry 2024 |


