 Open Access Article
The spatial dependence of intervalence charge transfer in an electroactive metal–organic framework†
Eleanor R.
Kearns
 ab,
Bun
Chan
 c,
Hunter J.
Windsor
b,
William
Lewis
 d and
Deanna M.
D'Alessandro
 *ab
*ab
aSchool of Chemical & Biomolecular Engineering, Faculty of Engineering, The University of Sydney, New South Wales, 2006, Australia. E-mail: deanna.dalessandro@sydney.edu.au
bSchool of Chemistry, Faculty of Science, The University of Sydney, New South Wales, 2006, Australia
cGraduate School of Engineering, Nagasaki University, Bunkyo 1-14, Nagasaki 852-8521, Japan
dSydney Analytical Core Research Facility, The University of Sydney, New South Wales, 2006, Australia
First published on 10th January 2024
Abstract
Metal–Organic frameworks (MOFs) provide an ideal platform to examine intervalence charge transfer (IVCT) in 3-dimensional coordination space. In the family of TTF-containing MOFs based on the parent system [Cd(bpdc)2(Py2TTF)2] (1), where H2bpdc = 4,4′-biphenyldicarboxylic acid and Py2TTF = (E)-4,4′-di(pyridin-4-yl)-2,2′-bi(1,3-dithiolylidene), substitution of the dicarboxylic acid coligand provides systematic variations in the cofacial arrangement of the IVCT-active mixed-valence TTF-ligand pairs. The resulting effects on the IVCT and radical behaviour of these frameworks was then quantified, revealing that the electronic coupling parameter, Hab, and radical characteristics were dependent on both the cofacial distance and horizontal offset between the cofacial ligands. Elucidating these structure–function relationships provides a basis for fine-tuning MOFs towards the development of conductive porous materials for subsequent use in energy technologies such as batteries and electrocatalysts.
Introduction
Characterising and quantifying charge transfer (CT) behaviours in metal–organic frameworks (MOFs)—a class of permanently porous coordination networks—is an essential step towards the design and synthesis of porous conductors.1–4 The periodic and modular nature of MOFs provides a powerful platform to examine CT phenomena in 3-dimensional coordination space.CT mechanisms can be broadly classified as ‘through-bond’ or ‘through-space’. Through-bond CT relies on orbital overlap and energy level matching between the inorganic building blocks of the framework and their connecting organic ligands,5–7 while through-space CT relies on π-orbital overlap and differing redox states of the participating moieties.6–8 Generally, MOFs are poor electrical conductors due to the energy mismatch between the closed shell ions and redox-inactive ligands typically used in their construction, yet great strides have been made in recent years.2,6,8 Additionally, the highly porous nature of MOFs means that redox-active functionalities are often too far apart to permit electronic interactions, thus precluding through-space CT.9
Through-bond CT is responsible for the distinct blue colour of Prussian blue, FeIII4[FeII(CN)6]3, an archetypal coordination polymer,10,11 as well as the high conductivity of (NBu4)2[FeIII2(dhbq)3] (dhbq2−/3− = 2,5-dioxidobenzoquinone/1,2-dioxido-4,5-semiquinone).12 In the latter case, a ligand-to-ligand Intervalence Charge Transfer (IVCT) process between dhbq2−/dhbq3− was observed which allowed the material to exhibit an intrinsic conductivity of 0.16(1) S cm−1. When this framework was chemically reduced resulting in a greater proportion of dhbq3−, a decrease in the intensity of the IVCT and in the intrinsic conductivity of the framework was observed.12 This work highlights the importance of mixed valency in CT.13
[Zn2(TTFTB)(H2O)2] (TTFTB4− = tetrathiafulvalene-tetrabenzoate) provides an elegant example of how structure modulation can control through-space CT. In this framework, through-space IVCT occurs through helical stacks of TTF moieties.14 The TTF:TTF spacing in [Zn2(TTFTB)(H2O)2] was 3.8 Å, a distance comparable to that observed in organic metals such as TTF/TCNQ (TCNQ = tetracyanoquinodimethane).14,15 The conductivity in this framework depended on the TTF:TTF spacing, as was demonstrated by varying the coordinating metal ion.16 Exchanging Zn2+ for M2+ (M = Co, Mn, or Cd) increased the conductivity by an order of magnitude due to a decrease in the TTF:TTF spacing from 3.80 Å in the Zn-MOF to 3.65 Å in the Cd-MOF.14,16 A second MOF containing TTFTB4− also exhibited a dependence between the TTF spacing and the conductivity of the framework.17 Through-space CT has also been observed in discrete molecular rectangles.18,19 Specifically, the degree of electronic coupling, Hab, for the IVCT interaction between cofacial ligands in these rectangles increased with decreasing cofacial distance and with optimisation of the ligand orientation to promote orbital overlap.
The effect of orbital overlap was further highlighted by our group for two isotopological Cd and Zn frameworks containing cofacial TzTz ligands (TzTz = [2,5-bis(4-(4-pyridinyl)phenyl)thiazolo[5,4-d]thiazole]).20–22 Despite the 0.03 Å difference in cofacial spacing between the ligands, the Cd framework had an Hab approximately half that of the Zn framework. This was explained by the larger lateral offset across the cofacial ligands, diminishing the orbital overlap for this system and thus the extent of electronic communication between the two TzTz moieties.
Ab initio computational studies on the effect of orientation of stacked TTF radicals on their CT characteristics has also found that increasing the cofacial distance resulted in an exponential decrease in Hab.23
Most recently, the IVCT of 2 DPTTZ-containing MOFs (DPPTZ = N,N′-di(4-pyridyl)thiazolo-[5,4-d]thiazole) MOFs and the effect of intervalence distance has been quantified.24 It was found that decreasing the cofaical distance resulted in higher charge carrier mobility, faster charge separation and faster charge recombination.
Herein, a series of Py2TTF-based MOFs are used to examine the spatial and electronic requirements for through-space CT. There are many literature examples analysing the through space charge transfer behaviour of TTF however this is usually carried out in delocalised systems and the Hab is rarely characterised.25,26 The multifunctional photo-mechano-electroactive MOF, [Cd(bpdc)2(Py2TTF)2], hereafter referred to as 1 (H2bpdc = 4,4′-biphenyldicarboxylic acid, Py2TTF = (E)-4,4′-di(pyridin-4-yl)-2,2′-bi(1,3-dithiolylidene)),27 is the parent framework used in this study; substitution of the bpdc2− coligand for closely related dicarboxylate ligands leads to subtle and systematic changes in the TTF cofacial arrangement. The substitution of bpdc2− for stil2− (H2stil =4,4′-stilbenedicarboxylic acid) generates framework 2, while substituting with oba2− (H2oba = 4,4′-oxybis(benzoic acid) or Schiff2− (H2Schiff = 4-[[(4-carboxyphenyl)imino]methyl]benzoic acid) will generate frameworks 3 and 4, respectively (Fig. 1). Additionally, an extended photoactive ligand, Py2Ph2TTF (Py2Ph2TTF = (E)-4,4′-bis(4-(pyridin-4-yl)phenyl)-2,2′-bi(1,3-dithiolylidene)) was synthesised. The replacement of Py2TTF with Ph2Ph2TTF in frameworks 1 and 3 resulted in the frameworks 1E and 3E, respectively (Fig. 1).
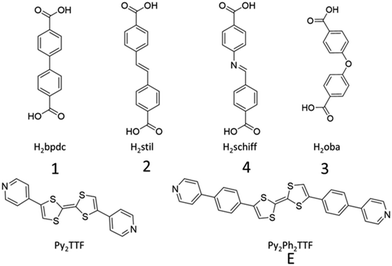 | ||
| Fig. 1 Coligands (H2bpdc, H2stil, H2Schiff, and H2oba) and photoactive ligands (Py2TTF and Py2Ph2TTF) used in this work. | ||
Crystallographic, electrochemical, and spectroscopic characterisations, including quantification of near-infrared-visible (NIR-Vis) spectroelectrochemical data8,28 provide new insights into the importance of cofacial distance, horizontal slippage, and vertical slippage on the degree of electronic communication and through-space CT between cofacial ligands in MOFs. NIR-Vis and electron paramagnetic resonance (EPR) SEC data revealed some interesting behaviour in the TTF radicals.
Results and discussion
Synthesis and structure
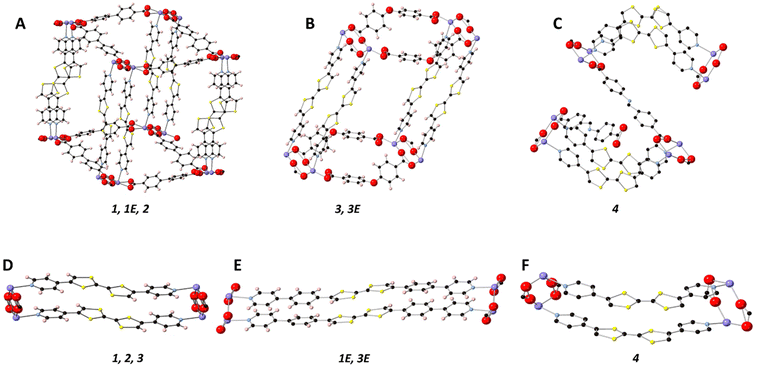
All frameworks were synthesised in accordance with our previously reported method, with full details provided in the ESI.†![[thin space (1/6-em)]](https://www.rsc.org/images/entities/char_2009.gif) 27 [Cd(bpdc)2(Py2TTF)2] (1) crystallised in the centrosymmetric monoclinic space group P21/n with the following unit cell parameters: a = 10.1851(4) Å, b = 28.1899(11) Å, c = 14.9875(5), β = 97.675°, and V = 4264.6(3) Å3. An 8-membered ring [Cd–O–C–O]2 between two Cd2+ ions and the carboxylate coordinating groups from two bpdc2− ligands is common to all five structures reported here (vide infra). Cofacial Py2TTF ligands pillar the Cd2+ ions axially, while the bpdc2− coligands form an undulating sheet in-plane with the [Cd–O–C–O]2 ring (Fig. 2A). Framework 1 is doubly interpenetrated with DMF and EtOH guest molecules occupying the pore space.
27 [Cd(bpdc)2(Py2TTF)2] (1) crystallised in the centrosymmetric monoclinic space group P21/n with the following unit cell parameters: a = 10.1851(4) Å, b = 28.1899(11) Å, c = 14.9875(5), β = 97.675°, and V = 4264.6(3) Å3. An 8-membered ring [Cd–O–C–O]2 between two Cd2+ ions and the carboxylate coordinating groups from two bpdc2− ligands is common to all five structures reported here (vide infra). Cofacial Py2TTF ligands pillar the Cd2+ ions axially, while the bpdc2− coligands form an undulating sheet in-plane with the [Cd–O–C–O]2 ring (Fig. 2A). Framework 1 is doubly interpenetrated with DMF and EtOH guest molecules occupying the pore space.
[Cd(stil)2(Py2TTF)2] (2) (H2stil = 4,4′-stilbenedicarboxylic acid) is isostructural to 1, with stil2− ligands replacing bpdc2− to create the undulating 2D sheet of coligands (Fig. 2A). Framework 2 crystallises in the centrosymmetric triclinic space group P![[1 with combining macron]](https://www.rsc.org/images/entities/char_0031_0304.gif) . Framework 2 possesses an angle of 47.5° between the pillaring dipyridyl ligand and the stil2+ coligands compared to 57.6° in framework 1. Additionally, framework 2 contains free Py2TTF ligands in the pore space; the pyridyl ring of the free Py2TTF forms π–π interactions to the TTF group of the bound ligand of distance 3.438 Å. The free ligand is approximately perpendicular to the bound ligand with a distance of 5.345 Å between the TTF centres. This arrangement precludes the free TTF ligand from taking part in any observed IVCT interactions. Due to the high degree of disorder in the pore solvent molecules, frameworks 1E, 2, 3, 3E, and 4 have had their pore solvent removed using SQUEEZE.29
. Framework 2 possesses an angle of 47.5° between the pillaring dipyridyl ligand and the stil2+ coligands compared to 57.6° in framework 1. Additionally, framework 2 contains free Py2TTF ligands in the pore space; the pyridyl ring of the free Py2TTF forms π–π interactions to the TTF group of the bound ligand of distance 3.438 Å. The free ligand is approximately perpendicular to the bound ligand with a distance of 5.345 Å between the TTF centres. This arrangement precludes the free TTF ligand from taking part in any observed IVCT interactions. Due to the high degree of disorder in the pore solvent molecules, frameworks 1E, 2, 3, 3E, and 4 have had their pore solvent removed using SQUEEZE.29
[Cd(bpdc)2(Py2Ph2TTF)2] (1E) is isostructural to 1, with Py2Ph2TTF in place of Py2TTF (Fig. 2A and E). 1E crystallises in the centrosymmetric monoclinic space group C2/c (Table 1). Frameworks 1, 1E, and 2 all exhibit the bonding topology shown in Fig. 2A.
| Framework | D cf (Å) | D h (Å) | D v (Å) |
|---|---|---|---|
| 1 | 3.782(4) | 0.252(5) | 1.60(1) |
| 1E | 3.318(4) | 1.166(6) | 0.434(6) |
| 2 | 3.9(6) | 1.03(2) | 0.31(2) |
| 3 | 3.482(3) | 1.523(4) | 0.35(1) |
| 3E | 3.45029(13) | 2.01715(16) | 0.4550(2) |
| 4 | 3.780(5) | 0.16(1) | 1.16(2) |
While the [Cd–O–C–O]2 ring is still present in [Cd(oba)2(Py2TTF)2] (3) the substitution of linear bpdc2− for v-shaped oba2− caused 3 to adopt a 2D topology (Fig. 2B). Instead of extending out in two dimensions to form an undulating sheet as in framework 1, the oba2− coligands instead bend such that all of the [Cd–O–C–O]2 rings are held in a single line. Framework 3 crystallises in the space group P![[1 with combining macron]](https://www.rsc.org/images/entities/char_0031_0304.gif) (Table 1).
(Table 1).
[Cd(oba)2(Py2Ph2TTF)2] (3E) is isostructural with framework 3, with the substitution of Py2TTF for Py2Ph2TTF (Fig. 2B and E). Framework 3E once again exhibits the same 2D topology observed in framework 3, and accordingly crystallises in the space group P![[1 with combining macron]](https://www.rsc.org/images/entities/char_0031_0304.gif) (Table 1).
(Table 1).
Finally, [Cd(Schiff)2((Z)-Py2TTF)2] (4) crystallises in the centrosymmetric monoclinic space group P2/c (Table 1). Framework 4 still possesses the [Cd–O–C–O]2 ring with Schiff2− ligands extending in 2D to form an undulating sheet. (Z)-Py2TTF ligands which are coordinated to the Cd2+ ions pillar the framework cofacially; however, due to their bent nature, the next [Cd–O–C–O]2 ring they attach to is rotated by approximately 90° (Fig. 2C and F). As a result, a second undulating plane of Schiff2− ligands extend out perpendicularly with respect to the initial plane. The (Z)-Py2TTF ligands define a sine-like wave through the extended crystal structure.
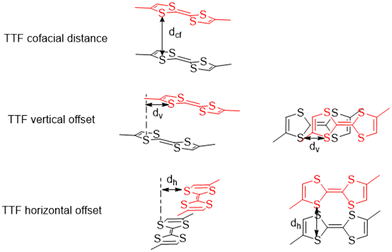
The various offsets of the cofacial TTF functionalities with respect to each other are the spatial parameters of interest for the discussed frameworks. Three parameters have been defined, namely the cofacial distance (Dcf), the vertical offset (Dv), and the horizontal offset (Dh) which were calculated in OLEX2 (Fig. 3).30 The values and associated errors for each framework are displayed in Table 2.
| Lower energy IVCT transition | Higher energy IVCT transition | |||||||||||
|---|---|---|---|---|---|---|---|---|---|---|---|---|
| 1 | 1E | 2 | 3 | 3E | 4 | 1 | 1E | 2 | 3 | 3E | 4 | |
| SC-UV-Vis absorbance is the measure of absorbance from the single crystal UV-Vis experiment; F(R)max is the maximum observed absorbance for the IVCT band of interest; SC-UV-Vis (ε) is the absorption coefficient calculated from the single crystal UV-Vis experiment; IVCT (ε) is the adjusted absorption coefficient adjusted to correspond to the IVCT band of interest; cofacial distance (Å) is the distance between interacting TTF groups as measured in OLEX2. Hab = [0.0205 × (νmaxεΔν1/2)1/2]/r, where ε is the extinction coefficient of the IVCT band.10,11,31 | ||||||||||||
| SC-UV-Vis Absorbance | 2.18 ± 0.48 | 4.22 ± 0.54 | 1.59 ± 0.33 | 2.36 ± 0.27 | 1.49 ± 0.04 | 2.6 ± 0.4 | 2.18 ± 0.48 | 4.22 ± 0.54 | 1.59 ± 0.33 | 2.36 ± 0.27 | 1.49 ± 0.04 | 2.6 ± 0.4 |
| F(R)max | 0.33 ± 0.09 | 0.27 ± 0.06 | 0.067 ± 0.006 | 0.37 ± 0.06 | 0.12 ± 0.01 | 0.1152 ± 0.0576 | 0.677 ± 0.22 | 0.86 ± 0.25 | 0.33 ± 0.01 | 0.313 ± 0.06 | 0.49 ± 0.07 | 0.68 ± 0.05 |
| SC-UV-Vis (ε) | 1074 ± 321 | 1753 ± 478 | 1000 ± 271 | 1136 ± 208 | 1035 ± 93 | 1128 ± 303 | 1074 ± 321 | 1753 ± 478 | 1000 ± 271 | 1136 ± 208 | 1035 ± 93 | 1128 ± 302 |
| IVCT (ε) | 91 ± 34 | 222 ± 69 | 19 ± 4 | 67 ± 16 | 37 ± 4 | 35 ± 20 | 248 ± 78 | 653 ± 228 | 91 ± 14 | 68 ± 18 | 150 ± 26 | 209 ± 41 |
| Cofacial distance (Å) | 3.782 ± 0.004 | 3.318 ± 0.004 | 3.9 ± 0.6 | 3.78 ± 0.005 | 3.482 ± 0.003 | 3.45029 ± 0.00013 | 3.782 ± 0.004 | 3.318 ± 0.004 | 3.9 ± 0.6 | 3.78 ± 0.005 | 3.482 ± 0.003 | 3.45 ± 0.0001 |
| Hab | 145 ± 40 | 227 ± 47 | 44 ± 7 | 75 ± 11 | 110 ± 14 | 136 ± 46 | 321 ± 97 | 637 ± 177 | 221 ± 53 | 171 ± 41 | 291 ± 86 | 370 ± 51 |
Quantifying IVCT
Solid-state cyclic voltammetry (ssCV) on [Cd(bpdc)2(Py2TTF)2] (1) in TBAPF6/MeCN as the supporting electrolyte revealed two quasi-reversible oxidation processes at 0.108 V and 0.385 V which were assigned to the two one-electron oxidations of the TTF core to the radical cation and subsequent dication, respectively (Fig. S1, ESI†). At low scan rates (20 mV s−1), these processes were electrochemically irreversible; however, they became reversible as the scan rate was increased (400 mV s−1). The cyclic voltammograms for the other frameworks were also dominated by processes centered on the TTF moiety and were confirmed using square-wave voltammetry (SWV) (Fig. S2, ESI†). As with framework 1, the reversibility of the electrochemical processes increased at higher scan rates.
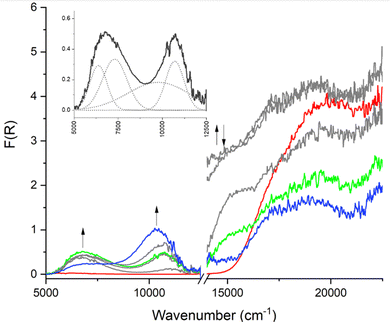
In situ solid-state NIR-Vis spectroelectrochemistry (NIR-Vis_SEC) was performed in the same electrolyte on frameworks 1–4. The diffuse reflectance spectrum of 1 was dominated by a band centered at 19![[thin space (1/6-em)]](https://www.rsc.org/images/entities/char_2009.gif) 740 cm−1 corresponding to the aromatic π–π* transitions of Py2TTF (Fig. 4).32,33 Upon application of an oxidising potential, a new band appears in the visible region at 15
740 cm−1 corresponding to the aromatic π–π* transitions of Py2TTF (Fig. 4).32,33 Upon application of an oxidising potential, a new band appears in the visible region at 15![[thin space (1/6-em)]](https://www.rsc.org/images/entities/char_2009.gif) 370 cm−1, which was assigned to the radical–π* transition of the TTF+˙ cation.23,33,34 Increasing the applied oxidising potential further leads to the appearance of a new band in the NIR region of the spectrum. This band, which is centered at 6750 cm−1, was formally assigned to the IVCT between a TTF+˙ radical cation and neutral TTF ligand.27,35 NIR bands are typical of IVCT transitions in frameworks containing cofacially stacked redox-active units.21 The appearance of this transition coincided with a decrease in the intensity of the radical–π* transition.
370 cm−1, which was assigned to the radical–π* transition of the TTF+˙ cation.23,33,34 Increasing the applied oxidising potential further leads to the appearance of a new band in the NIR region of the spectrum. This band, which is centered at 6750 cm−1, was formally assigned to the IVCT between a TTF+˙ radical cation and neutral TTF ligand.27,35 NIR bands are typical of IVCT transitions in frameworks containing cofacially stacked redox-active units.21 The appearance of this transition coincided with a decrease in the intensity of the radical–π* transition.
Further increasing the applied oxidising potential resulted in a second NIR band centered at 10![[thin space (1/6-em)]](https://www.rsc.org/images/entities/char_2009.gif) 340 cm−1. This band was assigned to the IVCT transition between two TTF+˙ radical cations.23,26,34 As the oxidising potential increases, the band at 11
340 cm−1. This band was assigned to the IVCT transition between two TTF+˙ radical cations.23,26,34 As the oxidising potential increases, the band at 11![[thin space (1/6-em)]](https://www.rsc.org/images/entities/char_2009.gif) 000 cm−1 becomes the dominant feature in the NIR region. Upon returning the potential to 0 V, the spectrum for the neutral material was partially restored. The high energy IVCT transition reverted to approximately 20% of its maximum absorbance and the low energy IVCT transition returned to approximately 50% of its maximum absorbance. An increase in the intensity of the low energy IVCT transition is initially seen upon removal of the oxidising potential; once it reaches 50% of its maximum absorbance, the IVCT signal is relatively stable and remains visible for several minutes after the oxidising potential is completely removed.
000 cm−1 becomes the dominant feature in the NIR region. Upon returning the potential to 0 V, the spectrum for the neutral material was partially restored. The high energy IVCT transition reverted to approximately 20% of its maximum absorbance and the low energy IVCT transition returned to approximately 50% of its maximum absorbance. An increase in the intensity of the low energy IVCT transition is initially seen upon removal of the oxidising potential; once it reaches 50% of its maximum absorbance, the IVCT signal is relatively stable and remains visible for several minutes after the oxidising potential is completely removed.
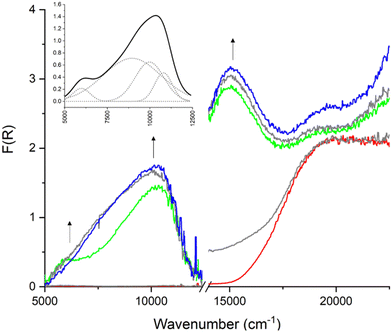
All frameworks containing Py2TTF ligands exhibit similar SEC UV-Vis behaviour with two clearly distinguishable peaks in the NIR region (Fig. S14–S18, ESI†). However, frameworks 1E and 3E, which contain Py2Ph2TTF, showed a different band structure in the NIR region. The bands associated with IVCT at 5000–7000 cm−1 and 10![[thin space (1/6-em)]](https://www.rsc.org/images/entities/char_2009.gif) 000–12
000–12![[thin space (1/6-em)]](https://www.rsc.org/images/entities/char_2009.gif) 000 cm−1 appear simultaneously, and the higher energy transition eventually becomes sufficiently broad that it dominates the entire NIR region. It is interesting to note that the intenisty of the transition at 15
000 cm−1 appear simultaneously, and the higher energy transition eventually becomes sufficiently broad that it dominates the entire NIR region. It is interesting to note that the intenisty of the transition at 15![[thin space (1/6-em)]](https://www.rsc.org/images/entities/char_2009.gif) 000–16
000–16![[thin space (1/6-em)]](https://www.rsc.org/images/entities/char_2009.gif) 000 cm−1, which corresponds to the radical–π* transition, increases over the course of the entire experiment, rather than varying in intensity as is observed in the frameworks containing Py2TTF. It is possible that frameworks 1E and 3E stabilise the radical to some extent. In fact, the radical signal remains present in the SEC spectra of framework 1E for approximately five minutes after the oxidising potential has been completely removed (Fig. S43, ESI†). The SEC spectra for framework 1E are shown in Fig. 5.
000 cm−1, which corresponds to the radical–π* transition, increases over the course of the entire experiment, rather than varying in intensity as is observed in the frameworks containing Py2TTF. It is possible that frameworks 1E and 3E stabilise the radical to some extent. In fact, the radical signal remains present in the SEC spectra of framework 1E for approximately five minutes after the oxidising potential has been completely removed (Fig. S43, ESI†). The SEC spectra for framework 1E are shown in Fig. 5.
Theoretically, IVCT can be modelled using two-state classical Marcus–Hush theory.10,11,36 The key parameter of relevance is Hab, which is a measure of the electronic delocalisation between the donor and acceptor moieties.10,11,37 The NIR-region of the SEC spectrum where the absorbance assigned to the IVCT had been maximised was deconvoluted to reveal a manifold of Gaussian components. As the lowest energy component of each transition corresponds to the thermal excitation energy for IVCT,22 it was used in the following Hab calculations.
The spectral parameters for the first component of this manifold, with a maximum at approximately 6000 cm−1 for frameworks 1–4, are shown in Table 2. The Hab for each of these frameworks was calculated using the deconvoluted Gaussian components and a molar extinction coefficient (ε) calculated from single-crystal UV-Vis spectroscopy on the neutral frameworks (Fig. S29–S40, ESI†).22
In all cases, 2Hab ≪ than vmax, the energy required for excitation. Thus, all systems would fall into the localised Robin–Day class II classification.38 Low Hab values are typical for class II compounds where the charge is not delocalised throughout the structure.
There is a second IVCT transition centered at approximately 11![[thin space (1/6-em)]](https://www.rsc.org/images/entities/char_2009.gif) 000 cm−1 which corresponds to the transfer of an electron between two radical cations to form one dication and one neutral ligand.33 The lowest energy component of the transition, once deconvoluted, and ε value derived from SC-UV-Vis spectra were used in the Marcus–Hush analysis (Fig. S29–S40 and Tables S7–S12, ESI†). The relevant parameters and results from this analysis are displayed in Table 2. Once again, as 2Hab ≪ νmax, these compounds are Robin–Day class II.
000 cm−1 which corresponds to the transfer of an electron between two radical cations to form one dication and one neutral ligand.33 The lowest energy component of the transition, once deconvoluted, and ε value derived from SC-UV-Vis spectra were used in the Marcus–Hush analysis (Fig. S29–S40 and Tables S7–S12, ESI†). The relevant parameters and results from this analysis are displayed in Table 2. Once again, as 2Hab ≪ νmax, these compounds are Robin–Day class II.
Structure–activity relationship between the IVCT transition and spatial parameters of interest
Inspection of the calculated Hab values shows that in general the 3D frameworks have a higher degree of electronic communication than the 2D frameworks. Additionally, those frameworks incorporating Py2Ph2TTF have larger Hab values than their Py2TTF analogues. It could be argued that this is due to the higher degree of conjugation in Py2Ph2TTF leading to larger and more diffuse molecular orbitals. This in turn would increase the degree of orbital overlap, thus increasing the amount of electronic communication. However, for 1 and 1E there is a large difference in the measured cofacial distances, with the TTF units in 1E being 0.4 Å closer together and resulting in increased orbital overlap. The same cannot be said for 3 and 3E, whose cofacial distances differ by only 0.03 Å. Additionally, 3E has larger Dv and Dh offsets. Despite this, 3E has a greater Hab than 3 for both the low and high energy IVCT transitions.The degree of electronic communication was examined in relation to Dcf, Dh, and Dv to examine the structure–activity relationship. When Hab was plotted against the cofacial distance a clear trend emerges, with Hab decreasing with increased Dcf (Fig. 6). This is to be expected as according to the Marcus–Hush theory, Hab is inversely proportional to the distance between the CT centers.10,11,31,39,40
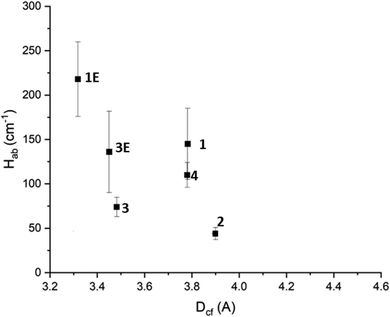 | ||
| Fig. 6 The effect of TTF cofacial distance on Hab. The horizontal error on point 2 has been removed for clarity. Further details can be found in the ESI.† | ||
The Hab values for the high energy IVCT transition once again show a clear dependence on cofacial distance (Fig. 7A). However, unlike for the low energy IVCT transition, the high energy transition also shows a dependence on the horizontal slippage of the ligands (Fig. 7B). It is possible that the change in shape of the molecular orbitals upon oxidation from TTF to TTF+˙ renders the horizontal slippage more favourable for an IVCT transition between two TTF+˙ radical cations. Previous work on CT in TTF-based systems has suggested that the highly nodular nature of the TTF molecular orbitals could lead to several potential energy minima through which CT can occur.23,41 It is also worth noting that the Hab values associated with the high energy transition are greater than those associated with the low energy transition.
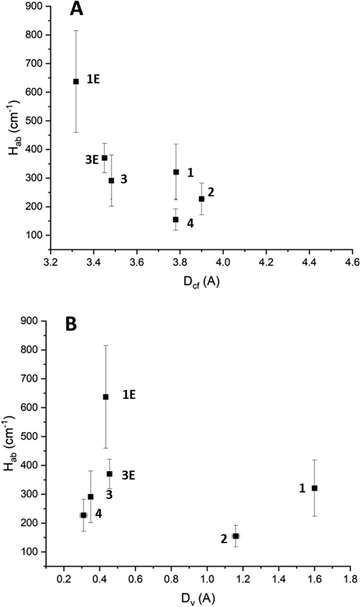 | ||
| Fig. 7 (A) The effect of cofacial distance on the high energy IVCT Hab. (B) The effect of horizontal slippage on the high energy IVCT Hab. The horizontal error associated with 2 has been removed from the figure for clarity. Further details can be found in the ESI.† | ||
Solid-state EPR spectroelectrochemistry (EPR-SEC) was performed on frameworks 1–4 to probe the interesting long-lived radical behaviour observed upon oxidation. EPR-SEC in a 0.1 M TBAPF6/MeCN electrolyte using Pt mesh working and counter electrodes and a silver reference electrode. All frameworks exhibited a similar EPR response to oxidation. The EPR-SEC spectrum for framework 1 is shown below (Fig. 8). As an oxidative potential is applied, a rhombic radical signal appears. This signal increases in intensity and becomes isotropic as the oxidising potential is increased indicating that as higher potentials are applied, some of the TTF ligands in the framework are becoming solubilised. The molecular tumbling of the radical in solution would even out the rhombic signal expected in a solid-state sample. Upon removal of the oxidising potential, the intensity of the radical signal decreases and it once again becomes rhombic in nature. This indicates that the TTF radicals in solution are returning to their neutral state while those in the framework remain as radicals. It is important to note that the radical signal does not completely disappear upon returning the applied potential to 0 V indicating that the radicals are stabilised within the framework.
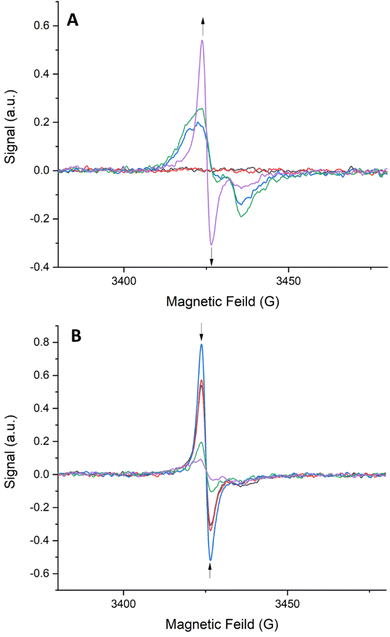 | ||
| Fig. 8 SEC-EPR spectra of 1: (A) from 0.0–2.0 V in 0.5 V intervals and (B) from 2.0–0.0 V in 0.5 V intervals. | ||
To assess the radical stabilisation in the frameworks, the area under the radical peak was measured once at 2.0 V and again once the applied potential was returned to 0 V (Table 3). The degree of preservation of the TTF radical was determined by comparing these areas. Interestingly, in the frameworks containing the Py2Ph2TTF ligand, the radical signal increases upon removal of the applied potential (Fig. S18–S22, ESI†). It is possible that removing the oxidising potential facilitates the reduction of any remaining TTF2+ cations to TTF+˙ radical cations which are subsequently stabilised.
| Framework | Magnetic field shift (G) | g-Values (gx, gy, gz) | % of radical signal retained upon returning potential to 0.0 V |
|---|---|---|---|
| 1 | 3425 | 2.0136, 2.0136, 2.00136 | 36 |
| 2 | 3429 | 2.0154, 2.0206, 2.0206 | 44 |
| 3 | 3430 | 2.0210, 2.0210, 2.0131 | 89 |
| 4 | 3428 | 93 | |
| 1E | 3428 | 2.0098, 2.0125, 2.0125 | 117 |
| 3E | 3427 | 2.011, 2.0247, 2.0218 | 254 |
An interesting correlation is observed between the amount of radical character that is preserved and the cofacial spacing between the TTF-based ligands (Fig. 7A). It appears that a larger cofacial spacing results in less radical character being preserved. As the IVCT transitions also follow this trend, it seems likely that the CT plays some role in stabilising the radical. Additionally, a correlation between the horizontal offset of the ligands and the amount of radical character preserved is observed such that as the horizontal offset increases so too does the amount of radical character being preserved (Fig. 7B).
It is possible that the radical may be more stabilised in the Py2Ph2TTF-containing frameworks over the Py2TTF-containing frameworks due to the increased degree of aromaticity and extent of sp2–sp2 conjugation. In the neutral state, TTF molecules are non-aromatic and adopt a boat conformation; upon oxidation to the radical cation, the TTF molecule adopts a planar conformation and becomes aromatic.42 Py2Ph2TTF has a greater degree of conjugation than Py2TTF which may confer more stability to the planar and aromatic radical state. The TTF ligands are forced into a planar conformation when coordinated within the framework, which may provide a secondary route for the radical state to be stabilised in the solid-state as compared to solution.
Computational analysis
Cofacial models of the TTF-based ligands were created wherein the terminal pyridyl rings were replaced with phenyl rings. This was to remove the interaction of the nitrogen lone pair in the models being examined. When the Py2TTF ligand is coordinated within the frameworks, these lone pairs would be involved in coordinating to the Cd2+ ions and thus would not take part in the IVCT transitions.Computation on the expected UV bands for the mono-oxidised system, i.e., those exhibiting low energy IVCT are shown in Fig. 9A. It is immediately obvious that frameworks 1E and 3E do not exhibit strong bands in the 0.5–0.75 eV region (approximately corresponding to the 4000–6000 cm−1 region). This is observed experimentally as the low energy IVCT transition in 1E and 3E having much lower intensites compared to their Py2TTF counterparts. An examination of the orbitals involved in the intense transition in the computed UV-Vis spectra shows that they correspond to intramolecular transitions rather than an intermolecular IVCT process. Frameworks 1 and 3 exhibit strong bands in the low energy IVCT region, while framework 2 does not. This agrees well with the calculated Hab values of which framework 2 has the lowest. The frameworks 1–3 also exhibit strong intramolecular transitions in the singly oxidised state.
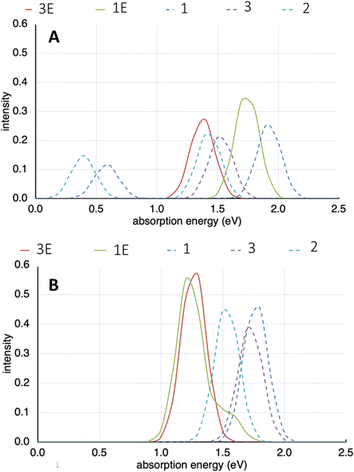 | ||
| Fig. 9 (A) Computed UV-Vis spectra for frameworks 1–3E in their mono-oxidised state. (B) Computed UV-Vis spectra for frameworks 1–3E in their doubly-oxidised state. | ||
The computed UV-Vis spectra for the high energy IVCT transitions are shown in Fig. 9B. Here, the frameworks have been doubly oxidised. It is immediately obvious that the bands associated with the low energy IVCT transitions have disappeared. This agrees with what was observed in the SEC-NIR-Vis experiment. The transitions associated with frameworks 1E and 3E are more intense than those associated with their Py2TTF counterparts. This once again agrees with experimental observations and the calculated Hab values for these frameworks. Note that the 1E and 3E models are isomeric; likewise, the models for 1, 2, and 3 are also isomers. The differences in the calculated spectra illustrate the significant distinctions in the photochemical properties that can result from relatively subtle structural differences induced by different complementary ligands in the crystal.
Conclusions
In this work, a series of TTF-based MOFs, all of which exhibit cofacially aligned TTF pairs, were evaluated in terms of their solid-state CT properties. In their radical cation mixed-valence states, all frameworks displayed two distinct IVCT processes. The first, a low-energy process corresponding to a one-electron transfer between a neutral ligand and a radical TTF cation ligand and a second, high-energy process, occurring between two ligands containing radical TTF cations. The calculated Hab values indicate that all examined MOFs can be classified as Robin–Day Class II materials. As expected, both IVCT processes show a decrease in intensity with an increasing cofacial distance between the TTF ligands. Interestingly, the higher energy IVCT process shows some dependence on the horizontal slippage of the system.EPR-SEC spectroscopy was employed to investigate the behaviour of the generated radicals during oxidation. A surprisingly long-lived radical was found in frameworks containing the Py2Ph2TTF ligand, while all frameworks showed some retention of the TTF radical after the oxidising potential was removed. The amount of radical character preserved showed a positive correlation with the Hab of the respective MOFs. This indicates that the IVCT process may be involved in stabilising the radical. Finally, computational modelling was used to test the experimentally derived results, supporting the observed differences in IVCT behaviour between the Py2TTF- and Py2Ph2TTF-based frameworks, however it was inconclusive regarding the effect of the coligand.
Author contributions
ERK and DMD devised the project. ERK collected and analysed all spectroscopic data. ERK collected and analysed all crystallographic data with the assistance of HJW and WL. BC carried out all computational work. ERK drafted the article, and revisions were carried out with the assistance of DMD.Conflicts of interest
There are no conflicts to declare.Acknowledgements
The authors gratefully acknowledge the generous support of the Australian Research Council (LE170100144, FT170100283 and DP180103874), the Hyogo Science and Technology Association (4019), the RIKEN Information System Division for the provision of computational resources (Q22266), and the Sydney Analytical Core Research Facility at The University of Sydney. This research was undertaken in part using the MX2 beamline at the Australian Synchrotron, part of ANSTO, and made use of the Australian Cancer Research Foundation (ACRF) detector.43Notes and references
- L. Sun, C. H. Hendon and M. Dincă, Dalton Trans., 2018, 47, 11739–11743 RSC.
- C. F. Leong, P. M. Usov and D. M. D’Alessandro, MRS Bull., 2016, 41, 858–864 CrossRef.
- P. M. Usov, C. F. Leong and D. M. D’Alessandro, Functional Supramolecular Materials, 2017, pp. 247–280 Search PubMed.
- H. C. Wentz, G. Skorupskii, A. B. Bonfim, J. L. Mancuso, C. H. Hendon, E. H. Oriel, G. T. Sazama and M. G. Campbell, Chem. Sci., 2020, 11, 1342–1346 RSC.
- L. Sun, T. Miyakai, S. Seki and M. Dincă, J. Am. Chem. Soc., 2013, 135, 8185–8188 CrossRef CAS PubMed.
- L. Sun, M. G. Campbell and M. Dincă, Angew. Chem., Int. Ed., 2016, 55, 3566–3579 CrossRef CAS PubMed.
- D. M. D’Alessandro, J. R. R. Kanga and J. S. Caddy, Aust. J. Chem., 2011, 64, 718 CrossRef.
- D. M. D’Alessandro, Chem. Commun., 2016, 52, 8957–8971 RSC.
- Y. Zhang, S. N. Riduan and J. Wang, Chem. – Eur. J., 2017, 23, 16419–16431 CrossRef CAS PubMed.
- G. C. Allen and N. S. Hush, Progress in Inorganic Chemistry, John Wiley & Sons, Ltd, 1967, pp. 357–389 Search PubMed.
- N. S. Hush, Progress in Inorganic Chemistry, John Wiley & Sons, Ltd, 1967, pp. 391–444 Search PubMed.
- L. E. Darago, M. L. Aubrey, C. J. Yu, M. I. Gonzalez and J. R. Long, J. Am. Chem. Soc., 2015, 137, 15703–15711 CrossRef CAS PubMed.
- R. Murase, C. F. Leong and D. M. D’Alessandro, Inorg. Chem., 2017, 56, 14373–14382 CrossRef CAS PubMed.
- T. C. Narayan, T. Miyakai, S. Seki and M. Dincă, J. Am. Chem. Soc., 2012, 134, 12932–12935 CrossRef CAS PubMed.
- A. A. Bright, A. F. Garito and A. J. Heeger, Phys. Rev. B: Solid State, 1974, 10, 1328–1342 CrossRef CAS.
- S. S. Park, E. R. Hontz, L. Sun, C. H. Hendon, A. Walsh, T. Van Voorhis and M. Dincă, J. Am. Chem. Soc., 2015, 137, 1774–1777 CrossRef CAS PubMed.
- S. Zhang, D. K. Panda, A. Yadav, W. Zhou and S. Saha, Chem. Sci., 2021, 12, 13379–13391 RSC.
- P. H. Dinolfo and J. T. Hupp, J. Am. Chem. Soc., 2004, 126, 16814–16819 CrossRef CAS PubMed.
- P. H. Dinolfo, M. E. Williams, C. L. Stern and J. T. Hupp, J. Am. Chem. Soc., 2004, 126, 12989–13001 CrossRef CAS PubMed.
- B. Ding, C. Hua, C. J. Kepert and D. M. D’Alessandro, Chem. Sci., 2019, 10, 1392–1400 RSC.
- C. Hua, P. W. Doheny, B. Ding, B. Chan, M. Yu, C. J. Kepert and D. M. D’Alessandro, J. Am. Chem. Soc., 2018, 140, 6622–6630 CrossRef CAS PubMed.
- P. W. Doheny, J. K. Clegg, F. Tuna, D. Collison, C. J. Kepert and D. M. D’Alessandro, Chem. Sci., 2020, 11, 5213–5220 RSC.
- S. V. Rosokha and J. K. Kochi, J. Am. Chem. Soc., 2007, 129, 828–838 CrossRef CAS PubMed.
- A. Nath, V. Kumar, A. Shukla, H. N. Ghosh and S. Mandal, Angew. Chem., 2023, 135, e202308034 CrossRef.
- L. S. Xie, E. V. Alexandrov, G. Skorupskii, D. M. Proserpio and M. Dincă, Chem. Sci., 2019, 10, 8558–8565 RSC.
- C. F. Leong, C.-H. Wang, C. D. Ling and D. M. D’Alessandro, Polyhedron, 2018, 154, 334–342 CrossRef CAS.
- D. A. Sherman, R. Murase, S. G. Duyker, Q. Gu, W. Lewis, T. Lu, Y. Liu and D. M. D’Alessandro, Nat. Commun., 2020, 11, 2808 CrossRef CAS PubMed.
- D. M. D’Alessandro and P. M. Usov, Aust. J. Chem., 2021, 74, 77 CrossRef.
- A. L. Spek, Acta Crystallogr., Sect. C: Struct, Chem., 2015, 71, 9–18 CrossRef CAS PubMed.
- O. V. Dolomanov, L. J. Bourhis, R. J. Gildea, J. A. K. Howard and H. Puschmann, J. Appl. Crystallogr., 2009, 42, 339–341 CrossRef CAS.
- N. S. Hush, Trans. Faraday Soc., 1961, 57, 557–580 RSC.
- D. L. Coffen, J. Q. Chambers, D. R. Williams, P. E. Garrett and N. D. Canfield, J. Am. Chem. Soc., 1971, 93, 2258–2268 CrossRef CAS.
- T. Sugano, K. Yakushi and H. Kuroda, Bull. Chem. Soc. Jpn., 1978, 51, 1041–1046 CrossRef CAS.
- J. B. Torrance, B. A. Scott, B. Welber, F. B. Kaufman and P. E. Seiden, Phys. Rev. B: Solid State, 1979, 19, 730–741 CrossRef CAS.
- J. Su, N. Xu, R. Murase, Z.-M. Yang, D. M. D’Alessandro, J.-L. Zuo and J. Zhu, Angew. Chem., Int. Ed., 2021, 60, 4789–4795 CrossRef CAS PubMed.
- D. B. Brown, Mixed-Valence Compounds: Theory and Applications in Chemistry, Physics, Geology, and Biology, Springer Netherlands, Dordrecht, 1980 Search PubMed.
- S. Fletcher, J. Solid State Electrochem., 2010, 14, 705–739 CrossRef CAS.
- M. B. Robin and P. Day, in Advances in Inorganic Chemistry and Radiochemistry, ed. H. J. Emeléus and A. G. Sharpe, Academic Press, 1968, vol. 10, pp. 247–422 Search PubMed.
- R. A. Marcus, Annu. Rev. Phys. Chem., 1964, 15, 155–196 CrossRef CAS.
- R. A. Marcus and N. Sutin, Biochim. Biophys. Acta, Rev. Bioenerg., 1985, 811, 265–322 CrossRef CAS.
- A. J. Berlinsky, J. F. Carolan and L. Weiler, Solid State Commun., 1976, 19, 1165–1168 CrossRef CAS.
- J. Su, S. Yuan, H.-Y. Wang, L. Huang, J.-Y. Ge, E. Joseph, J. Qin, T. Cagin, J.-L. Zuo and H.-C. Zhou, Nat. Commun., 2017, 8, 2008 CrossRef PubMed.
- T. M. McPhillips, S. E. McPhillips, H-J Chiu, A. E. Cohan, A. M. Deacon, P. J. Ellis, E. Garman, A. Gonzales, N. K. Sauter, R. P. Phizackerly, S. M. Soltis and P Kuhn, Blu-Ice and the Distributed Control System: software for data acquisition and instrument control at macromolecular crystallography beamlines, J. Synchrotron Radiat., 2002, 9, 401–406 CrossRef CAS PubMed.
Footnote |
| † Electronic supplementary information (ESI) available. CCDC 2156708, 2155075, 2156707 and 2235495. For ESI and crystallographic data in CIF or other electronic format see DOI: https://doi.org/10.1039/d3ma00770g |
| This journal is © The Royal Society of Chemistry 2024 |

