 Open Access Article
Creative Commons Attribution 3.0 Unported Licence
Real-time visualization of latent fingermarks with level 3 details based on a solid state emissive organic fluorophore using the powder dusting method†
Arivalagan
Shabashini
a,
Sathiaraj
Richard
a,
Manas K.
Panda
 *b,
Sumit K.
Panja
*c and
Ganesh Chandra
Nandi
 *a
*a
aDepartment of Chemistry, National Institute of Technology, Tiruchirappalli-620015, Tamil Nadu, India. E-mail: nandi@nitt.edu; ganeshnandi@gmail.com
bDepartment of Chemistry, Jadavpur University, Kolkata-700032, India. E-mail: mannup25@gmail.com; manaspanda.chemistry@jadavpuruniversity.in
cTarsadia Institute of Chemical Science, Uka Tarsadia University, Surat-394350, Gujrat, India. E-mail: sumit.panja@utu.ac.in; sumitkpanja@gmail.com
First published on 11th December 2023
Abstract
Herein, we have designed and synthesized a water-soluble organic fluorescent probe (Py-Pr-OH, 3) and applied it for latent fingermarks (LFMs) detection via the powder dusting method. The probe is highly emissive (in the solid state) and amphiphilic in nature with preferred lipophilicity. The pyridyl cation attached to the polar end group enhances its water solubility. The single crystal structure and packing analysis reveals that the absence of π–π stacking interaction in the lattice contributes to the strong solid-state fluorescence of the Py-Pr-OH molecule. LFM images with level 1–3 details (including, ridge pattern, ridge width, ridge size and sweat pore size) on various substrates have been identified with high resolution and low background interference. The LFMs have been developed very quickly (<10 s), and clear pictures with multilevel details are obtained via simple mobile phone photography. The electrostatic interactions between the probe with sebaceous rich FMs enhance the LFM imaging with high contrast, sensitivity, accuracy, and low background interference. Most importantly, details of the fingermark ridge width and the sweat pores are analyzed under SEM.
1 Introduction
Fingermarks (FMs) are one of the most unique impression and permanence features of individuals left by raised curves of fingertips. FMs have emerged as one of the essential biometric features for personal identification in crime scenes, medical diagnostics, access control, and law enforcement for over a century.1–3 Latent fingermarks (LFMs) are the imprints of the finger on a hard surface, produced due to eccrine sweat and oily sebum, and these are mostly invisible to our naked eyes.4–7 Hence, additional substances are needed to visualize and identify LFMs. The conventional techniques to develop LFMs include cyanoacrylate/iodine fuming, vacuum metal deposition, lead carbonate/sulfate/ferric oxide and ninhydrin staining.8–12 However, staining and fuming methods can damage the eyes, skin, mucous membranes, or DNA.13 Additionally, after-treatment complexity, low imaging accuracy contrast, substantial sound interference, sensitivity, and selectivity are also the limitations of these techniques.14–16 In this context, the powder dusting method is the most convenient, effective and extensively used for forensic analysis and authentication.17–19 A special brush gently sweeps the surface of the LFM and adheres to the ridges of the LFMs. The developed LFM can be seen by the naked eye.To date, various fluorescent materials have been utilized for LFM fluorescence development, including quantum/carbon dots (QDs/CDs), metal–organic frameworks, gold nanoparticles (GNs), up-conversion nanoparticles (UCNPs) and polymeric materials.8,20–22 Though these materials show improved sensitivity and accuracy, most of the materials exhibit several shortcomings, such as the use of toxic, rare earth and heavy metal (UCNPs, QDs, GNs), longer incubation times (QDs), photobleaching, and background interference.23,24 Accordingly, preparing low-cost fluorescent compounds with low toxicity, high sensitivity/selectivity and long shelf-life is highly recommended. In this regard, organic fluorescent molecules have been used as good alternatives for LFM identification as they are cost-effective and can be structurally modified easily.2,8,25–29 However, most of the articles discussed only level 1–2 details with organic fluorophores and took longer time (>5 min) to develop LFM images.30–35
In general, pyrene derivatives show weak fluorescence in the solid state.36,37 However, the presence of cationic pyridine substitution leads to enhanced fluorescence in the solid state. The presence of the hydrophobic pyrene part and hydrophilic pyridyl cationic group has made the molecule amphiphilic in nature with preferred lipophilicity. The cationic pyridyl end of the substrate can have an electrostatic interaction with sebaceous-rich FMs to boost the LFM imaging with high contrast, sensitivity, accuracy, and low background interference. Guided by the importance of affordable organic dyes, the powder dusting method and the versatility of pyrene derivatives, we synthesize a solid-state orange emissive amphiphilic pyrene derivative bearing cationic pyridyl substitution (Py-Pr-OH; Scheme 1). We exploit Py-Pr-OH to develop LFMs via the powder dusting method in a very short time (<10 s). Moreover, the LFM images developed by Py-Pr-OH display level 1–3 details with very high resolution. The substrate compatibility of latent FM visualization is tested on various substrates such as aluminium foil, glass plates, paper currency, ceramic tiles, plastic, plywood, CDs, and coins. The stability of the developed LFMs is successfully monitored under blue LED and thermal conditions. The LFM is also sustained under atmospheric conditions for a long time (one month tested). The work provides a strategy for the fluorescence enhancement of pyrene derivative (Py-Pr-OH) in the solid state and its promising application in fluorescence visualization of LFMs on various substrates. The single-crystal XRD authenticates the high solid-state fluorescence of the probe.
2 Experimental section
2.1 Instrumentation
Steady-state UV-Vis absorption and fluorescence spectra are recorded with a UV-Vis JASCO V-750 spectrophotometer and JASCO FP-8200 spectrofluorometer, respectively. The spectral measurements are done at ∼10−5 to 10−6 M concentrations at room temperature (25 °C). 1H (400 MHz) and 13C NMR (126 MHz) spectra are recorded on two different NMR spectrophotometers (Bruker). Chemical shifts (δ) are given in parts per million (ppm) using the residual solvent peaks as a reference relative to TMS. ‘J’ values are given in Hz. The single crystal X-ray diffraction data of the Py-Pr-OH crystals are collected on a Microfocus D8 venture Bruker APEX 3 diffractometer. Mass spectra are recorded with an Agilent QTOF G6545XT spectrometer at 50![[thin space (1/6-em)]](https://www.rsc.org/images/entities/char_2009.gif) 000 resolution using ESI mode. Solid-state UV-Vis absorption spectra were recorded by a Shimadzu UV-2600 spectrophotometer, for the solid state emission study, a HORIBA Jobin Yvon Fluorolomax-4 spectrofluorometer was used. The morphology of the developed LFMs was obtained using a field-emission scanning electron microscope (FE-SEM) (ZEISS-Gemini sem 300). All the photographs of LFMs have been captured using an iPhone 13.
000 resolution using ESI mode. Solid-state UV-Vis absorption spectra were recorded by a Shimadzu UV-2600 spectrophotometer, for the solid state emission study, a HORIBA Jobin Yvon Fluorolomax-4 spectrofluorometer was used. The morphology of the developed LFMs was obtained using a field-emission scanning electron microscope (FE-SEM) (ZEISS-Gemini sem 300). All the photographs of LFMs have been captured using an iPhone 13.
2.2 Chemicals and synthesis
The starting materials (pyrene, malononitrile, 4-methyl pyridine, 2-bromo ethanol) were procured from Merck, TCI chemicals and used as received. 1-Pyrene carboxaldehyde 1 and 1-(2-hydroxyethyl)-4-methyl pyridinium bromide 2 were synthesized according to the literature.25,382.3 Synthesis and characterization of pyrene derivative (Py-Pr-OH, 3)
An ethanolic mixture of pyrene carboxaldehyde 1 (300 mg, 1.30 mmol, 1 equiv.), hydroxyethyl-4-methyl pyridinium bromide 2 (340 mg, 1.56 mmol, 1.2 equiv.) and piperidine (128 μl, 2 equiv.) was stirred under reflux conditions for 6 h. The obtained orange precipitate was filtered and washed several times with cold ethanol to obtain pure product 3. The product was thoroughly characterized by 1H, 13C, HRMS, and single crystal XRD techniques. The UV-Vis absorption and fluorescence spectrum in the solution and solid state were recorded. Recrystallization using DCM–MeOH solution provided orange emissive crystals.2.4 Characterization of Py-Pr-OH
Orange solid (yield: 412 mg, 74%), mp: 301–302 °C. 1H NMR (400 MHz, DMSO-d6): δ 9.14 (d, J = 16.0 Hz, 1H), 8.96–8.95 (m, 3H), 8.67 (d, J = 8.0 Hz, 1H), 8.56–8.54 (m, 2H), 8.41 (t, J = 8.0 Hz, 4H), 8.32–8.25 (m, 2H), 8.15 (t, J = 7.6 Hz, 1H), 7.88 (d, J = 16.0 Hz, 1H), 5.30 (brs, 1H), 4.62 (s, 2H), 3.92 (s, 2H). 13C NMR (126 MHz, DMSO-d6): δ 153.4, 145.1, 137.4, 132.8, 131.4, 130.8, 129.9, 129.5, 129.3, 129.1, 127.9, 127.2, 126.8, 126.5, 126.3, 125.9, 124.8, 124.7, 124.3, 123.6, 62.6, 60.6. HRMS (ESI, m/z): calcd for C20H25NO (M–Br)+: 350.1539, found: 350.1546.3 Results and discussion
3.1 Steady-state absorption and fluorescence measurements
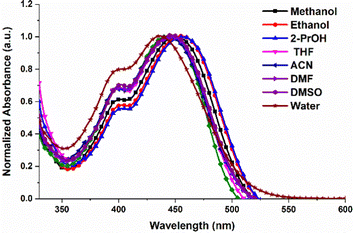
The UV-Vis spectra of Py-Pr-OH are recorded in different solvents and are presented in Fig. 1. Py-Pr-OH exhibits two absorption bands at 400 nm and 450 nm. The absorption peak at 450 nm is assigned to the intramolecular charge transfer (ICT transition), and the peak at 400 nm indicates the π–π* transition of the pyrene unit. Interestingly, the ICT band appears in both polar and nonpolar solvents. A slight red shift is observed in the case of polar protic solvents (methanol, ethanol, 2-isopropanol) from 435 to 450 nm. Steady-state emission spectra of Py-Pr-OH are recorded in different solvents by exciting the molecule at 450 nm, and the results manifest the appearance of strong emissive bands around 575 nm (Fig. 2). However, the solvatochromic shift of λmax is negligible. In general, the strong solvatochromic effect on the emission λmax is observed for all neutral ICT molecules due to the higher dipole moment of the photoexcited state than the ground state. Consequently, the emission λmax is shifted from lower to higher wavelength in non-polar to polar solvents. However, in our case Py-Pr-OH is a positively charged species with Br− as a counter anion and thus poor shift of emission λmax is observed on changing from non-polar to polar solvent. This phenomenon can be attributed to the negligible change in dipole moment between the ground state and photoexcited state. We have also investigated the excitation wavelength dependent fluorescence behaviour of our probe in different solvents (Fig. S4–S11, ESI†). From the obtained results, the emission wavelength doesn’t change with the change of the excitation wavelength in solvents. Furthermore, we found that the emission is observed from the ICT state exclusively and no structural changes were observed in the excited state. The quantum yield (Φs) of pure Py-Pr-OH in ethanol solvent is found to be 0.58 using fluorescein (ΦR = 0.79) as a fluorescence standard.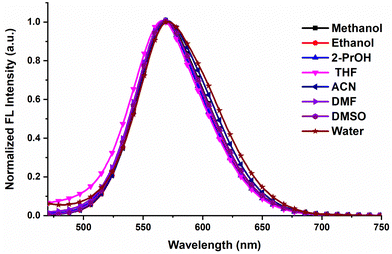 | ||
| Fig. 2 Normalized emission spectra of Py-Pr-OH (10 μM) in different solvents under excitation at 450 nm. | ||
3.2 Solid state UV-Vis and fluorescence properties
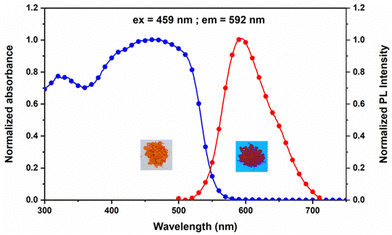
Furthermore, we have recorded the solid-state UV-Vis and fluorescence spectra of Py-Pr-OH (Fig. 3). The solid-state absorption spectrum of Py-Pr-OH exhibits a broad absorption band at 459 nm, which is assigned as a charge transfer band. Interestingly, the compound is orange-red emissive in the solid crystalline state and the solid-state emission band appeared at λmax = 592 nm (Stokes shift 4895 cm−1). The strong fluorescence of the molecule is due to the restriction of intramolecular rotation and the absence of π–π stacking interaction in the solid state, which boosted its red shift in the solid state.3.3 Single crystal X-ray crystallography
To get insight into the molecular packing and intermolecular interactions, we have carried out single crystal X-ray diffraction study of the Py-Pr-OH (Fig. 4a). Slow evaporation of Py-Pr-OH from DCM–MeOH solution provides blocky crystals having an orthorhombic system with P212121 space group (Table S1, ESI†). The asymmetric unit contains one molecule of Py-Pr-OH in which the pyridine ring C–H is hydrogen bonded with the bromide ion. Conformational analysis reveals that the pyrene ring is nearly planer with the pyridine ring suggesting strong electronic conjugation between the two rings. The molecules in the crystal lattice are stitched by several intermolecular interactions that provide the integrity of the crystal. As can be seen from the packing structure, Br− acts as a central ion (an excellent H-bond acceptor) for six different types of H-bonding interactions involving various protons from neighbouring Py-Pr-OH molecules (Fig. 4b). Two different protons from the two pyridyl rings are engaged in H-bonding interaction with the central Br− ion having D–A distances (![[double bond splayed right]](https://www.rsc.org/images/entities/char_e00a.gif) D–H⋯A angles) C15⋯Br = 3.837 (6) Å (
D–H⋯A angles) C15⋯Br = 3.837 (6) Å (![[double bond splayed right]](https://www.rsc.org/images/entities/char_e00a.gif) C15–H15–Br = 164.1°) and C12⋯Br = 3.824 (6) Å (
C15–H15–Br = 164.1°) and C12⋯Br = 3.824 (6) Å (![[double bond splayed right]](https://www.rsc.org/images/entities/char_e00a.gif) C15–H15–Br = 169.1°), respectively. The pyridyl alkyl protons (H13A, H13B) are engaged with H-bonding interaction with the same central bromide ion having distance C13⋯Br = 3.857(7) Å, (
C15–H15–Br = 169.1°), respectively. The pyridyl alkyl protons (H13A, H13B) are engaged with H-bonding interaction with the same central bromide ion having distance C13⋯Br = 3.857(7) Å, (![[double bond splayed right]](https://www.rsc.org/images/entities/char_e00a.gif) C13–H13A–Br = 161.3°) and C13⋯Br = 3.735(7) Å, (
C13–H13A–Br = 161.3°) and C13⋯Br = 3.735(7) Å, (![[double bond splayed right]](https://www.rsc.org/images/entities/char_e00a.gif) C13–H13B–Br = 156.7°) respectively. Moreover, a strong H-bonding interaction was observed between the alkyl hydroxy proton and Br− ion having D–A distances O2⋯Br = 3.246(5) Å, (
C13–H13B–Br = 156.7°) respectively. Moreover, a strong H-bonding interaction was observed between the alkyl hydroxy proton and Br− ion having D–A distances O2⋯Br = 3.246(5) Å, (![[double bond splayed right]](https://www.rsc.org/images/entities/char_e00a.gif) O2–H2–Br = 169.1° respectively). In addition to H-bonding interactions, Py-Pr-OH molecules display C–H⋯π interactions involving pyridine ring protons (C11–H11) that are connected to neighbouring pyrene π π-clouds having C11–H11⋯C3 distance 2.830 Å, C11–H11–C23 distance 2.971 Å and C11–H11⋯C4 distance 2.837 Å (Fig. 4c). All these intermolecular interactions provide conformational rigidity of the molecules, which prevents non-radiative emission in the excited state and resulted in strong fluorescence in the solid state. Moreover, the absence of π–π stacking interaction in the solid crystal can also be attributed to strong solid-state fluorescence of the Py-Pr-OH molecule.
O2–H2–Br = 169.1° respectively). In addition to H-bonding interactions, Py-Pr-OH molecules display C–H⋯π interactions involving pyridine ring protons (C11–H11) that are connected to neighbouring pyrene π π-clouds having C11–H11⋯C3 distance 2.830 Å, C11–H11–C23 distance 2.971 Å and C11–H11⋯C4 distance 2.837 Å (Fig. 4c). All these intermolecular interactions provide conformational rigidity of the molecules, which prevents non-radiative emission in the excited state and resulted in strong fluorescence in the solid state. Moreover, the absence of π–π stacking interaction in the solid crystal can also be attributed to strong solid-state fluorescence of the Py-Pr-OH molecule.
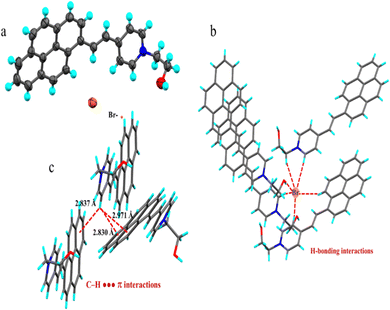 | ||
| Fig. 4 (a) Molecular structure of the Py-Pr-OH; (b) H-bonding interactions involving various protons with a central Br− ion; (c) C–H⋯π interactions in the Py-Pr-OH molecule. | ||
3.4 Real-time visualization of latent fingermarks
The excellent solid-state emission properties and significant Stoke's shift of Py-Pr-OH inspired us to explore its real-time application as a LFM imaging agent using the standard powder dusting method. The solid Py-Pr-OH was mixed with silica (weight ratio of 1![[thin space (1/6-em)]](https://www.rsc.org/images/entities/char_2009.gif) :
:![[thin space (1/6-em)]](https://www.rsc.org/images/entities/char_2009.gif) 15) to provide free flow for LFM development. The solid-state emission spectra were recorded before and after the silica mixture and there is no significant change in the emission maximum from the obtained results, so we confirmed that the addition of silica to the probe doesn’t affect its emission properties (Fig. S12, ESI†).
15) to provide free flow for LFM development. The solid-state emission spectra were recorded before and after the silica mixture and there is no significant change in the emission maximum from the obtained results, so we confirmed that the addition of silica to the probe doesn’t affect its emission properties (Fig. S12, ESI†).
The sebaceous-rich fingermarks for testing were obtained from volunteers by gently pressing their fingertips on aluminium foil.
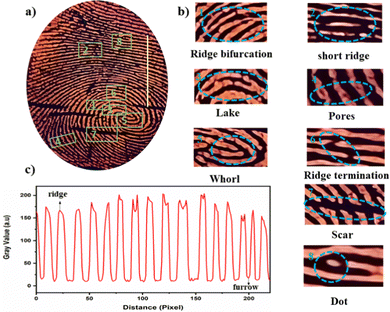
The fluorescent powder was then applied to the surface using the powder dusting method. Finally, a clear fluorescent image of the LFM was observed under 365 UV light, and the images are shown in Fig. 5. The photographs by a mobile phone offered a facile approach to increase the accessibility of LFM identification. It is noteworthy to mention that most inspectors working in crime science wish to record LFM images with mobile phones. The reddish-orange luminescence can easily recognize the ridges and grooves. The fingermark profiles are clearly visible in the photographs, and the papillary ridges of FMs are well-defined. The shapes of the fingermark with level 1 (whorl, ridge pattern), level 2 (lake, short ridge, ridge bifurcation, ridge termination), and level 3 details (dots, pores) are visible; the enlarged fingermark details are shown in Fig. 5b.
3.5 Substrate compatibility of Py-Pr-OH for LFM visualization
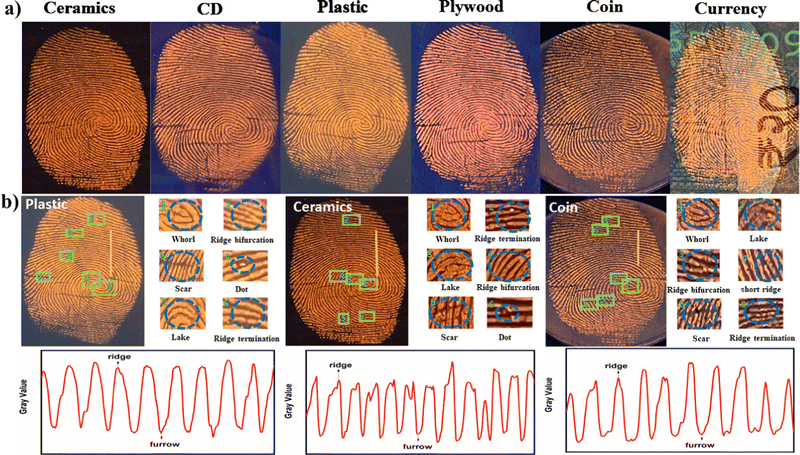
To study the surface generality of the newly synthesized Py-Pr-OH, we developed LFMs on different surfaces, including ceramics, CDs, plastic, plywood, coins, and paper currency. Due to the highly emissive and colored nature of Py-Pr-OH, the LFMs on different substrates have been developed successfully and clearly visible LFM images are obtained with high contrast and resolution under UV light (also with the naked eye-Fig. S13, ESI†) without any background interference (Fig. 6). The results indicate that Py-Pr-OH is compatible with LFM development on various surfaces. The magnified images of level 1 (whorl, ridge pattern), level 2 (lake, short ridge, bifurcation, and ridge termination) and level 3 (dots) details are visible, as shown in Fig. 6b. Multilevel information can provide reliable evidence to recognize individual identity. The fluorescence intensity between the fingermark ridges and furrows across the yellow line shows high contrast between the fingermark ridges and substrate.We carried out a case study by collecting finger-marks from different volunteers. The results are depicted in Fig. S14 (ESI†). The efficiency of Py-Pr-OH on aged LFMs has been evaluated by developing the LFMs stored under ambient atmosphere after 7 and 15 days. The stained LFMs have also been developed successfully (Fig. S15, ESI†). Additionally, LFMs present on the surfaces of common objects are also smoothly printed, as shown in Fig. S16 (ESI†).
The anticounterfeiting labelling effect is also checked, which can be used to prevent counterfeiting of original documents. We have prepared a label with the ink of Py-Pr-OH (in PEG, 10 μM). The letters on cellulose paper are transparent under natural light, but become fluorescent under 365 nm light (Fig. S17, ESI†).
3.6 Micromorphology of level 3 features of developed LFMs
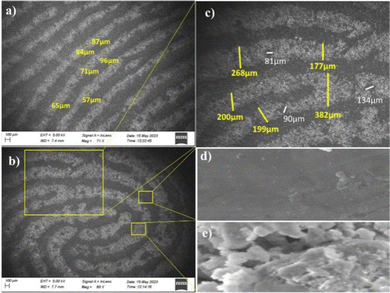
To authenticate the fingermarks of individuals, the level 3 microscopic details, such as ridge width, and number, size, location, and distribution of sweat pores of the LFMs are needed. The size of sweat pores present in the same ridges are found to be different and properly distinguishable (Fig. 7a). The magnified FE-SEM image noticeably exhibits a whorl pattern (Fig. 7b). The widths of different ridges, and the distance between the sweat pores of the same ridge are also varied and clearly analyzable (Fig. 7c). The FE-SEM images of Py-Pr-OH reveal the presence of ridges and furrows distinctly, with no distribution of powder particles in the furrow region (Fig. 7d and e). Consequently, the unique characteristic features obtained from the SEM morphological studies help to identify individuals.3.7 Stability of Py-Pr-OH treated LFMs
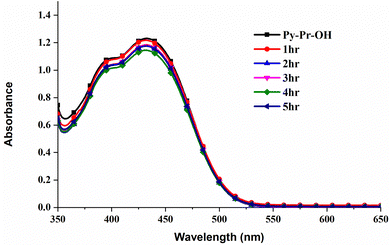
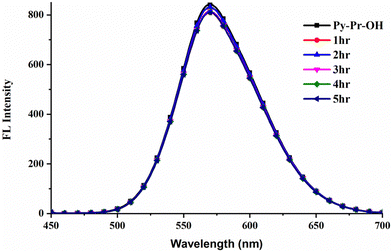
To find the stability of Py-Pr-OH, we have studied the photostability of the probe by irradiating the sample under photo LED and recorded the absorption and fluorescence spectra every 1 h and found that there is not much difference in the spectra, which proved the sample photostability; the obtained spectra are displayed in Fig. 8 and 9.Thereafter, to find the stability of the developed LFM image, it was stored under an open atmosphere for a long time (Fig. S18, ESI†). To our delight, the colour of the FM images was not diminished or destroyed, and the contrast was high with an excellent signal-to-noise ratio. Furthermore, the developed LFMs were irradiated under thermal conditions and blue LEDs, and the developed LFMs remain stable, concluding their photo and thermal stability.
3.8 LFM development mechanism
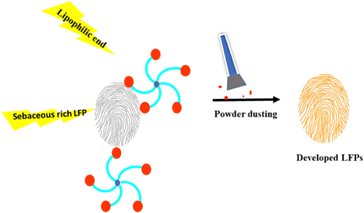
The preferential adhesion of Py-Pr-OH to the fingermark ridges deposited on the aluminium foil is visualized under a UV lamp. As mentioned earlier, the driving force behind the immobilization of the probe is the hydrophobic interaction of sebaceous (sebum-rich) fingermark ridges with the lipophilic end of the probe.39 In the case of Py-Pr-OH, the pyrene moiety attached to the pyridyl cation can serve as the lipophilic end, which adheres with the hydrophobic lipid secretions of the fingermark ridges. The electrostatic interaction between the positively charged pyridyl cation of the Py-Pr-OH moiety and negatively charged lipids of fatty acids in the LFM could enhance the adhesion property.40 A schematic representation of the LFM development mechanism is shown in Fig. 10.4 Conclusion
We have synthesized a pyrene based pyridyl cation-attached fluorescent organic molecule (Py-Pr-OH) via a simple and efficient method. The organic probe (Py-Pr-OH) is highly fluorescent in the solid state. The excellent emissive properties of the Py-Pr-OH have been utilized for real-time latent fingermark recognition via the cost-effective and competent powder dusting method. The high-contrast images with level 1 (whorl, ridge pattern), level 2 (ridge bifurcation, ridge termination, short ridge, ridge ending, scar) and level 3 (dot, sweat pore) details are successfully identified on the surfaces of aluminium foil, ceramics, CDs, plastic, plywood, coins, and paper currency by a mobile phone. Micromorphology details (sweat pore location, ridge width, lake width and pore size) are also obtained clearly through FE-SEM analysis, identifying the individuals more precisely. The reddish orange luminescent color of Py-Pr-OH neglects the background fluorescence in most cases. The results anticipate that these findings will provide a novel strategy to design and develop a high-emissive low-cost organic fluorescent powder for latent fingermark detection with the advantages of reduced background fluorescence and high selectivity.Author contributions
Arivalagan Shabashini: methodology, investigation, validation, data curation, formal analysis, writing – original draft, writing – review & editing. Sathiaraj Richard: methodology, visualization, validation, data curation, formal analysis. Manas K. Panda: conceptualization, visualization, validation, resources, project administration, writing – original draft, writing – review & editing. Sumit Kumar Panja: conceptualization, visualization, validation, resources, project administration, writing – review & editing. Ganesh Chandra Nandi: conceptualization, visualization, validation, resources, project administration, supervision, funding acquisition, formal analysis, writing – original draft, writing – review & editing.Conflicts of interest
There are no conflicts of interest.Acknowledgements
The authors are grateful to CSIR (Ref. no. 02(0445)/21/EMR-II) for funding. AS and SR acknowledge the fellowship from NIT-Trichy (MHRD). DST-FIST is acknowledged for providing the HR mass spectrometer at the Department of Chemistry, NIT Trichy. SKP thanks Tarsadia Institute of Chemical Science, Uka Tarsadia University, Surat – 394350, Gujarat, India for providing the infrastructure and instrument facilities.References
- R. Zou, Y. Yu, H. Pan, P. Zhang, F. Cheng, C. Zhang, S. Chen, J. Chen and R. Zeng, ACS Appl. Mater. Interfaces, 2022, 14, 16746–16754 CrossRef.
- J. Lian, F. Meng, W. Wang and Z. Zhang, Front. Chem., 2020, 8, 59484 Search PubMed.
- J. Wang, T. Wei, X. Li, B. Zhang, J. Wang, C. Huang and Q. Yuan, Angew. Chem., Int. Ed., 2014, 53, 1616–1620 CrossRef PubMed.
- M. Wang, M. Li, A. Yu, Y. Zhu, M. Yang and C. Mao, Adv. Funct. Mater., 2017, 27, 16062243 Search PubMed.
- A. Shabashini, S. K. Panja and G. C. Nandi, Chem. – Asian J., 2021, 16, 1057–1072 CrossRef PubMed.
- P. Hazarika and D. A. Russell, Angew. Chem., Int. Ed., 2012, 51, 3524–3531 CrossRef PubMed.
- D. Gao, F. Gao, Q. Kuang, X. Zhang, Z. Zhang, Y. Pan, R. Chai and H. Jiao, ACS Appl. Nano Mater., 2022, 5, 9929–9939 CrossRef.
- A. A. Ansari, K. M. Aldajani, A. N. AlHazaa and H. A. Albrithen, Coord. Chem. Rev., 2022, 462, 214523 CrossRef.
- J. S. Day, H. G. M. Edwards, S. A. Dobrowski and A. M. Voice, Spectrochim. Acta, Part A, 2004, 60, 1725–1730 CrossRef PubMed.
- R. Yang and J. Lian, Forensic Sci. Int., 2014, 242, 123–126 CrossRef CAS.
- M. Wang, Y. Zhu and C. Mao, Langmuir, 2015, 31, 7084–7090 CrossRef CAS.
- K. Kumari Sharma, G. H. Kannikanti, T. R. R. Baggi and J. R. Vaidya, J. Forensic Sci., 2019, 64, 1859–1866 CrossRef CAS PubMed.
- W. Chen, Y. Song, W. Zhang, R. Deng, Y. Zhuang and R. J. Xie, ACS Appl. Mater. Interfaces, 2022, 14, 28230–28238 CrossRef CAS.
- A. Becue, A. Scoundrianos, C. Champod and P. Margot, Forensic Sci. Int., 2008, 179, 39–43 CrossRef CAS.
- X. Chen, W. Xu, L. Zhang, X. Bai, S. Cui, D. Zhou, Z. Yin, H. Song and D. H. Kim, Adv. Funct. Mater., 2015, 25, 5462–5471 CrossRef CAS.
- A. Bindhu, J. I. Naseemabeevi and S. Ganesanpotti, Mater. Adv., 2023, 4, 3796–3812 RSC.
- R. Vadivel, M. Nirmala and K. Anbukumaran, Forensic Chem., 2021, 24, 100339 CrossRef.
- K. Yang, H. Tang, Y. Jiao, L. Gao, M. Zhang, J. Qin, W. Li, S. Lu and Y. He, J. Lumin., 2023, 257, 119721 CrossRef CAS.
- K. K. Sharma, P. Nagaraju, M. E. Mohanty, T. R. R. Baggi and V. J. Rao, J. Photochem. Photobiol., A, 2018, 351, 253–260 CrossRef CAS.
- H. S. Jung, K. J. Cho, S. J. Ryu, Y. Takagi, P. A. Roche and K. C. Neuman, ACS Appl. Mater. Interfaces, 2020, 12, 6641–6650 CrossRef CAS.
- A. Baride, G. Sigdel, W. M. Cross, J. J. Kellar and P. S. May, ACS Appl. Nano Mater., 2019, 2, 4518–4527 CrossRef CAS.
- X. Zhang, J. Wu, P. Wang, J. Gao, F. Gao and D. Gao, Dalton Trans., 2021, 50, 7826–7834 RSC.
- M. Wang, M. Li, A. Yu, J. Wu and C. Mao, ACS Appl. Mater. Interfaces, 2015, 7, 28110–28115 CrossRef CAS.
- C. Xu, R. Zhou, W. He, L. Wu, P. Wu and X. Hou, Anal. Chem., 2014, 86, 3279–3283 CrossRef CAS.
- Y. L. Wang, C. Li, H. Q. Qu, C. Fan, P. J. Zhao, R. Tian and M. Q. Zhu, J. Am. Chem. Soc., 2020, 142, 7497–7505 CrossRef CAS.
- W. Huang, N. Jiang, Y. Qu, X. Lv, H. Zhou, L. Wang, L. Wang and Y. Rui, Dyes Pigm., 2023, 218, 111509 CrossRef CAS.
- T. Xiao, L. Zhang, D. Chen, Q. Zhang, Q. Wang, Z. Y. Li and X. Q. Sun, Org. Chem. Front., 2023, 10, 3245–3251 RSC.
- C. Ran, Z. Xu, J. He, Z. Man, Z. Lv, P. Wang and H. Fu, J. Mater. Chem. C, 2022, 10, 16347–16352 RSC.
- S. Kumar and P. Singh, J. Photochem. Photobiol., A, 2023, 437, 114418 CrossRef CAS.
- P. Singh, H. Singh, R. Sharma, G. Bhargava and S. Kumar, J. Mater. Chem. C, 2016, 4, 11180–11189 RSC.
- N. E. Choi, E. J. Kim and J. Lee, RSC Adv., 2022, 12, 33180–33186 RSC.
- R. Suresh, S. K. Thiyagarajan and P. Ramamurthy, Sens. Actuators, B, 2018, 258, 184–192 CrossRef CAS.
- S. Chen, K. Jia, Y. Fang, C. Liu, C. Yuan, J. Liu, K. P. Wang and Z. Q. Hu, Dyes Pigm., 2022, 205, 110534 CrossRef CAS.
- B. Tharmalingam, O. Anitha, J. Aiswarya, T. Thiruppathiraja, S. Lakshmipathi and B. Murugesapandian, J. Photochem. Photobiol., A, 2023, 442, 114757 CrossRef CAS.
- P. Rasin, P. Prabhakaran, S. M. Basheer, V. Manakkadan, V. N. Vadakkedathu Palakkeezhillam and A. Sreekanth, Anal. Chem., 2023, 95, 6448–6457 CrossRef CAS.
- Q. Feng, M. Wang, B. Dong, C. Xu, J. Zhao and H. Zhang, CrystEngComm, 2013, 15, 3623–3629 RSC.
- M. M. Islam, Z. Hu, Q. Wang, C. Redshaw and X. Feng, Mater. Chem. Front., 2019, 3, 762–781 RSC.
- Z. Zeng, A. A. J. Torriero, A. M. Bond and L. Spiccia, Chem. – Eur. J., 2010, 16, 9154–9163 CrossRef CAS PubMed.
- M. Sametband, I. Shweky, U. Banin, D. Mandler and J. Almog, Chem. Commun., 2007, 1142–1144 RSC.
- L. Xu, Y. Li, S. Li, R. Hu, A. Qin, B. Z. Tang and B. Su, Analyst, 2014, 139, 2332–2335 RSC.
Footnote |
| † Electronic supplementary information (ESI) available. CCDC 2249837. For ESI and crystallographic data in CIF or other electronic format see DOI: https://doi.org/10.1039/d3ma00870c |
| This journal is © The Royal Society of Chemistry 2024 |


