 Open Access Article
Creative Commons Attribution 3.0 Unported Licence
Ti2O3 film electrode for water treatment via electrochemical chlorine evolution†
Yishu
Zhang
,
Caroline
Kirk
* and
Neil
Robertson
 *
*
School of Chemistry, University of Edinburgh, David Brewster Road, Joseph Black Building, Edinburgh, EH9 3FJ, UK. E-mail: Caroline.Kirk@ed.ac.uk; neil.robertson@ed.ac.uk
First published on 5th January 2024
Abstract
This work introduces a low-cost and earth-abundant Ti2O3 thin film electrode as the anode for chlorine-driven electrochemical water treatment. A simple method of immobilizing Ti2O3 powder onto a conductive glass substrate has been developed and studied. Electrochemical characterization showed that the chlorine evolution reaction (CER) was more favorable than the oxygen evolution reaction (OER) for the Ti2O3 film electrode. The Ti2O3 film electrode showed high efficiency of free chlorine production, which leads to a good performance in degrading methyl orange (97.9% in 1.5 h) and tetracycline (78.0% in 1.5 h) via chlorine evolution. Pollutant degradation reaction by chlorine is observed to be the major reaction (75%) in this electrochemical water treatment system, while direct electron transfer (DET) reaction also contributed to pollutant degradation. Ti2O3 film electrodes can work efficiently for several cycles with the help of an easy regeneration step between cycles.
Introduction
Waste water containing organic contaminants produced by industrial, agricultural, medical and domestic activities has been a worldwide environmental problem.1 Electrochemical advanced oxidation processes (EAOPs) have been considered as an effective technology for degrading a wide range of organic pollutants in waste water,2 because of their high efficiency and broad applications.1,3 Compared with traditional advanced oxidation processes such as UV radiation, ozone based processes and Fenton's reaction,1,2 EAOPs need less energy and a smaller scale, which makes them easy to be applied in various conditions or combined with other technologies.4 Electrode materials such as metal oxides (SnO2, PbO2etc.), dimensionally stable anodes (DSAs) (RuO2-TiO2@Ti, IrO2-RuO2@Ti etc.), boron-doped diamond (BDD) and Magneli phase Ti4O7 have been reported to show high efficiency in degrading contaminants including dyes, pesticides, pharmaceuticals, perfluorinated organic compounds, phenolic compounds, aliphatic acids, etc.1,3,5,6In commonly used EAOPs, water is electrolyzed on the anode surface and hydroxyl radical (˙OH) is produced for unselective degradation of pollutants (eqn (1)). Pollutant molecules can also be oxidized on the surface of the electrode via direct electron transfer (DET) reactions.3 Some kinds of organic pollutant have proven difficult to oxidize by ˙OH, such as perfluorinated organic compounds,7 and DET reactions were found to be the rate-limiting step for the oxidation of compounds that are unreactive towards ˙OH.7,8 Chloride, a commonly present anion in waste water, can be converted to free chlorine species (Cl2, HClO, ClO−) by electrooxidation, and take part in the degradation of organic pollutants.1,9 Free chlorine species have been reported to help degrade a wide range of pollutants, including methyl orange, Rhodamine B, ceftazidime, bisphenol A, perfluorooctanesulfonate, etc.5,10,11 Free chlorine species were reported effective in degrading organic molecules that are not reactive with ˙OH.11
In the electrochemical water treatment system containing chloride, oxygen evolution reaction (OER) (Formula 2), chlorine evolution reaction (CER) (Formula 3) and hydroxyl radical production are in competition with each other. Both ˙OH and chlorine are able to oxidize organic pollutant molecules, however O2 does not react with pollutants in water. Electrocatalysts for water purification are therefore expected to have a high overpotential for OER to reduce the energy loss caused by oxygen evolution.10 Factors such as pH, temperature, chloride concentration and the adsorption energy of reactive species (Cl−, H2O, etc.) and active sites (usually metal atoms) on the surface of electrocatalyst also affect the selectivity of OER, CER and ˙OH production.12–16
| H2O → ˙OH + H+ e− (E° = 2.74 V vs. SHE) | (1) |
| 2H2O → O2 + 4H+ + 4e− (E° = 1.23 V vs. SHE) | (2) |
| 2Cl− → Cl2 + 2e− (E° = 1.36 V vs. SHE) | (3) |
In this work, Ti2O3, a semiconductor with an ultra-narrow bandgap (≈0.09 eV) and a high conductivity (σ = ≈160 S cm−1),17,18 was chosen as the electrocatalyst material. Previous studies have proven that Ti2O3 remains stable after exposing to ambient air for a long time.19,20 Ti2O3 has been applied as an electrode in fuel cells,21 Li-ion batteries22 and electrochemical ammonia evolution,23 but its performance in chlorine-driven water treatment have not previously been studied. Ti2O3 powder was immobilized on a conductive fluorine-doped tin oxide (FTO) glass slide by a simple method to form a thin film electrode. Morphology and crystal structure of the material before and after immobilization were characterized. Electrochemical properties of the Ti2O3 thin film electrode were tested in different electrolytes in order to study the selectivity of OER and CER. The thin film electrode was applied towards degradation of two different model pollutants in water solutions containing chloride ions. Mechanism of the degradation reaction was studied via scavenging tests and the performance of the Ti2O3 thin film electrode under repeated use was also tested.
Experimental
Chemicals and materials
Ti2O3 (99.8%) was purchased from Alfa Aesar. FTO glass (15 Ω sq−1), ethyl cellulose, terpinol, ethanol, potassium chloride, tetracycline hydrochloride (TC) and tert-butanol (TBA) were purchased from Sigma Aldrich. N,N-Diethyl-p-phenylenediamine (DPD) sulfate and methyl orange (MO) were purchased from Acros organics. Sodium sulfate was purchased from Fluorochem. Silver conductive paint was purchased from RS PRO.Ti2O3 paste preparation
0.4 g Ti2O3 powder was ground by pestle and mortar before stirring with 1 g mixture of ethyl cellulose and ethanol (10 wt% ethyl cellulose), 0.81 g terpineol and 1 mL ethanol overnight. The mixture was ultrasonicated by Toption ultrasonic homogenizer at a power of 400 W 3 times, 1 min each time. Excess ethanol was evaporated by rota-evaporation at 40 °C, 120 rpm.Thin film electrode preparation
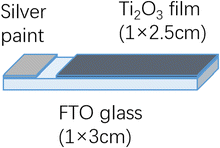
FTO glass was cut to 1 cm × 3 cm rectangle slides and cleaned by ultrasonication in detergent solution (Decon 90, ∼ 5% in tap water), tap water, deionized water and ethanol for 15 min each step. Ti2O3 paste was doctor bladed on the conductive surface of FTO glass at an area of 1 cm × 2.5 cm spaced by scotch tape (thickness 0.060 mm). Thin films on the glass slides were dried at 100 °C under air for 30 min and annealed by programmable hotplate by the heating sequence in Table 1. The heating ramp rate was 10 °C min−1 between every stage. After annealing, silver conductive paint was painted on the blank part of conductive surface of FTO glass slides to increase the conduction between electrode and clip. A schematic diagram of the Ti2O3 thin film electrode is shown in Fig. 1. For control experiments, silver conductive paint was painted onto the same area of plain FTO glass as on the Ti2O3 thin film electrode to form a plain FTO electrode.| Sample name | 400EC30 | 450EC60 | 500EC30 | 500EC60 |
|---|---|---|---|---|
| Heating rate: | ||||
| 10 °C min−1 | 325 °C, 5 min | |||
| 375 °C, 5 min | ||||
| 400 °C, 30 min | 450 °C, 60 min | 450 °C, 15 min | 450 °C, 15 min | |
| 500 °C, 15 min | 500 °C, 45 min |
Characterization
Powder X-ray Diffraction (PXRD) patterns were measured by Bruker D2 phaser X-ray diffractometer in reflection geometry with CuKa radiation (1.54184 Å). SEM images were taken by Carl Zeiss SIGMA HD VP Field Emission SEM, operated in SE2 mode with a 10 kV accelerating voltage. FT-IR spectra were collected by Shimadzu IRSpirit Fourier Transform Infrared Spectrophotometer.Electrochemistry
Linear sweep voltammetry (LSV) was measured by CV Autolab, using a 3-electrode, 1-compartment system with Ti2O3 thin film electrode as the working electrode, platinum mesh as the counter electrode and Ag-AgCl (3 M KCl) electrode as the reference electrode. All electrocatalytic tests, including free chlorine capture, model pollutant degradation, scavenger testing and repeated use testing, were carried out using an Ivium potentiostat V89102, in a 3-electrode, 2-compartment system. The anode compartment containing the Ti2O3 thin film electrode (working electrode) and the Ag-AgCl (3 M KCl) electrode (reference electrode) was separated by a glass frit from the cathode compartment containing platinum mesh (counter electrode). The volume of electrolyte in the anode compartment was fixed to 25 mL. During all electrocatalytic tests the potential was fixed to 2.0 V.DPD reagent solution was prepared by dissolving 0.13 g DPD sulfate into 60 mL deionized water, followed by adding 1.5 mL 10% H2SO4 and 2.5 mL 0.8% EDTA before bringing the final volume to 100 mL with deionized water.
In all electrocatalytic tests, 0.4 mL aliquots of electrolyte in the anode compartment were removed every 30 min. For free chlorine capture, 0.4 mL of DPD reagent was mixed with 2.5 mL NaH2PO4/Na2HPO4 buffer (pH ∼ 6.0) in a quartz cuvette before adding 0.4 mL of electrolyte aliquot. For model pollutant degradation, scavenging tests and recycling tests, 0.4 mL of electrolyte was mixed with 2.9 mL of deionized water in a quartz cuvette. UV-vis spectra were collected using a Shimadzu UV-1800 UV-Vis spectrometer.
Result and discussion
Characterization
In order to burn off organic binder, Ti2O3 thin film samples were heated under air, which risks the undesirable oxidation of Ti(III) to Ti(IV). FT-IR spectra of the sample 400EC30 (Fig. S1, ESI†) showed no peaks related to the presence of any organic groups, suggesting that the organic binder was completely burned off at 400 °C. SEM images of Ti2O3 powder, and Ti2O3 thin film before and after heating were taken and compared to each other (Fig. 2 and Fig. S2, ESI†). Particle size of the original Ti2O3 powder was about 1–2 μm, with grains apparently linked together. After film deposition and heating, the particles generally retained their shape and size, although some additional fusing of particles may have occurred. There was no obvious substantial morphology change after film deposition and heating of any of the thin film samples. | ||
| Fig. 2 SEM images of (a) Ti2O3 powder, (b) Ti2O3 film before annealing, and (c) 400EC30 film sample. | ||
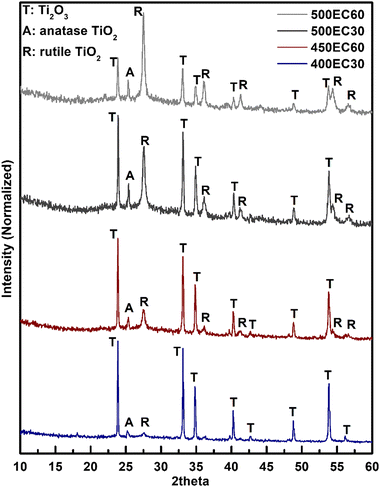
To study the possible oxidation of Ti2O3 under different heating temperatures and times, PXRD patterns of all Ti2O3 thin film samples were collected and compared with standard patterns of possible products. All observed diffraction peaks in the patterns were found to fit well with the standard peaks of Ti2O3 (ICSD#1462), anatase TiO2 (ICSD#9852) and rutile TiO2 (ICSD#9161) (Fig. 3). The intensity of the peaks assigned to anatase and rutile increased with the increase of annealing temperature and time. For 400EC30 however, only a negligible amount of TiO2 was observed, while in 500EC60, most of the Ti2O3 was oxidized to TiO2. According to the PXRD results, the oxidation progress of Ti(III) in Ti2O3 can be controlled by annealing temperature and time. As the sample annealed at 400 °C for 30 min is still almost entirely Ti2O3, with no detectable organic binder remaining, this material was used for all further electrochemical studies.
Electrochemistry
LSV of sample 400EC30 and plain FTO glass were measured in 3 different electrolytes: chloride-rich electrolyte (4 M KCl), strong base electrolyte (1 M KOH) and neutral electrolyte (0.1 M Na2SO4) (Fig. 4a–c). The selectivity of CER and OER is affected by the concentrations of chloride and hydroxide ions.12 In chloride-rich electrolyte, CER was the dominant reaction, while in strong base electrolyte, OER was promoted and CER was minimised. OER in neutral environment can be studied by using Na2SO4 solution as the electrolyte. Tafel plots and Tafel slopes of each electrode measured in different electrolytes are shown in Fig. 4(d). The Tafel slope is a critical parameter to evaluate the reaction kinetics and investigate the catalytic mechanism.24 Comparing with plain FTO glass, Ti2O3 film has a similar onset potential for OER in both base and neutral electrolytes. The difference of Tafel slopes may come from different mechanisms. Besides, Ti2O3 thin film has lower onset potential for CER than plain FTO glass in chloride-rich electrolyte, although Tafel slopes are similar. Ti2O3 thin film can have higher current density for CER at a certain potential comparing with plain FTO.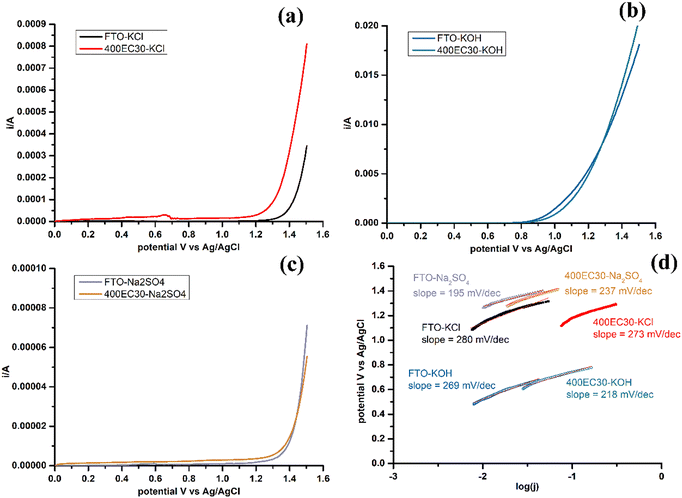 | ||
| Fig. 4 LSV of 400EC30 and plain FTO glass, carried out in three kinds of electrolytes: (a) 4 M KCl, (b) 1 M KOH and (c) 0.1 M Na2SO4, and (d) Tafel plot and Tafel slope calculated from LSV results. | ||
Comparisons of Tafel slope values of Ti2O3 thin film and other similar electrocatalytic materials from previous studies are shown in Table 2. Mixed metal oxides electrodes were reported to have small Tafel slope values for both CER and OER, which suggested more favourable kinetics.24 However, these kind of electrodes usually need precious metal compounds and complex production processes, and the cost of these electrodes becomes high. Cheaper electrode materials were also studied, but the Tafel slope of these were larger than mixed metal oxides for both CER and OER. Further study of the relationship between Tafel slope and mechanisms of reaction on the surface of electrocatalytic materials is needed. Furthermore, some literature introducing electrocatalytic materials doesn’t present Tafel plot and Tafel slope data, making the comparison of mechanism and kinetics harder among different materials. Overall however, it is clear from Fig. 4a and c that CER is favoured over OER on Ti2O3 under neutral conditions, which is appropriate for water treatment applications. Research on widely used Ru/Ir-based water oxidation electrocatalysts suggests possible OER mechanisms that involve metal atom oxidation state change during adsorption and desorption of oxygen,25 which may not operate readily for Ti(III), therefore OER may be less favoured on the surface of Ti2O3.
| Material | Electrolyte | Reaction | Tafel slope mV dec−1 | Ref. |
|---|---|---|---|---|
| Ti2O3 thin film on FTO glass | 4 M KCl | CER | 273 | This work |
| 1 M KOH | OER | 218 | ||
| Blue/Black TiO2 nanotube (anatase phase) | 1 M KH2PO4 | OER | Blue 371 | 27 |
| Black 200 | ||||
| (Blue has higher selectivity for CER) | ||||
| Co3O4 on FTO glass | Saturated KCl | CER | 66 | 24 |
| 1 M KOH | OER | 101 | ||
| RuO2-TiO2@Ti | Saturated NaCl | CER | 39 | 28 |
| RuO2-TiO2@Ti | 5 M NaCl | CER | 41 | 29 |
| La2CoMnO6 | 5 M NaCl pH = 2.2 | CER | 44 | 30 |
| 1 M KOH | OER | 115 |
Free chlorine capture
DPD method has been the most widely used method for quantitative analysis of free chlorine in water.26 DPD can be oxidized by chlorine and becomes a magenta-coloured compound known as a Würster dye at a near neutral pH. Before free chlorine capture tests, a series of standard NaClO solutions with different concentrations were made and tested by DPD reagent, and a linear fit of DPD reagent UV absorption and NaClO concentration was calculated (Fig. S3, ESI†). The linear fit was then used for calculating the concentration of free chlorine produced in electrocatalytic systems. All of the concentration results from free chlorine capture tests were in the linear concentration range of the fit.Real raw waters, such as domestic and industrial raw waters, may contain quite different chloride concentrations ranging from 1.5 mM to 1.5 M.5,31 A concentration of 0.1 M was applied in all electrochemical oxidation tests in order to study the performance of electrodes in an environment which is representative of real raw waters within this range. Samples 400EC30 and plain FTO glass were tested for free chlorine production in an electrolyte of 0.1 M KCl, and the results are shown in Table 3. At the same fixed potential (2 V) and same time (1 h), both of them gave a good chlorine production efficiency of higher than 50% faradaic yield. Higher current and more charge was passed by the Ti2O3 thin film electrode and more free chlorine was produced than plain FTO glass. However, the plain FTO electrode had a slightly higher faradaic yield of chlorine production. This indicates that slightly more charge is consumed by other reactions in the Ti2O3 electrocatalytic system than FTO glass.
| Test time: 1 h | 400EC30 | FTO |
|---|---|---|
| Charge | 5.29C | 3.88C |
| Chlorine concentration | 5.56 × 10⁻⁴ mol L−1 | 4.54 × 10⁻⁴ mol L−1 |
| Faradaic yield | 50.7% | 56.7% |
Electrocatalytic test
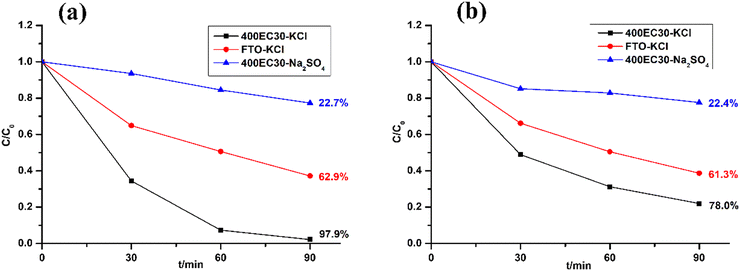
Methyl orange (MO) and Tetracycline (TC) were chosen as model pollutants for electrocatalytic degradation tests. The former is an easily-tracked coloured dye and the latter is realistic model pollutant. The electrolytes used in the electrocatalytic tests are solutions of MO (4.6 × 10⁻⁴ M) or TC (2.08 × 10⁻⁴ M) along with 0.1 M KCl. The degradation results of these two model pollutants over 1.5 h is shown in Fig. 5 alongside control experiments. Comparing with plain FTO glass, Ti2O3 thin film electrode had a higher degradation efficiency of MO (97.9% after 1.5 h). Ti2O3 electrocatalyst also shows good performance on degrading TC via producing chlorine (78.0% after 1.5 h). The performance of Ti2O3 thin film electrode in solutions containing chloride was much better than that in solutions without chloride, suggesting that free chlorine took an important part of degrading model pollutants.Mechanism study
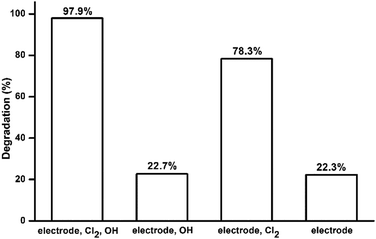
Model pollutant molecules in electrocatalytic system containing chloride ions can be degraded by three possible routes: degrading directly at the electrode (DET reactions), degrading by free chlorine and degrading by hydroxyl radical (˙OH). Scavenging tests were carried out to study the roles of these three oxidation routes in the electrocatalytic system. Tert-butyl alcohol (TBA) was chosen as the scavenging reagent for hydroxyl radicals. The effective species in each electrolyte are listed in Table 4. The degradation percentages of each test are shown in Fig. 6. The comparison between test 1 and 2 showed that approximately 75% of MO degradation was driven by free chlorine. The result of test 4 showed that 22.3% of MO was oxidized directly on the surface of electrode. Degradation percentages of test 2 and 4 are very similar, which may suggest that only a tiny amount of OH˙ took part in the degradation of MO. This is likely because the electrolyte is at neutral pH and OH˙ is difficult to be produced by the electrode, which has been shown in the LSV results above. The MO degradation in test 3 was lower than that in test 1 suggesting that TBA may react with some free chlorine and cause a decrease of MO degradation.| Test | MO (4.6 × 10⁻⁴ M) | KCl (0.1 M) | TBA (0.05 M) | Species for oxidation reaction |
|---|---|---|---|---|
| 1 | √ | √ | Cl2, HO˙, electrode | |
| 2 | √ | HO˙, electrode | ||
| 3 | √ | √ | √ | Cl2, electrode |
| 4 | √ | √ | Electrode |
Repeated use tests
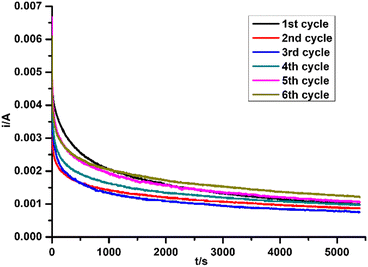
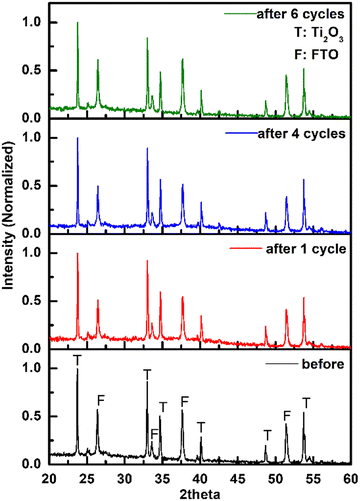
Repeated use tests were carried out under the same conditions as the electrocatalytic test against MO for 6 cycles. Before the 4th, 5th and 6th cycle, the electrode was regenerated by a linear scan from 0 V to −2 V (vs. Ag/AgCl) in 0.1 M KCl. Electrodes were rinsed by deionized water and dried under ambient air between each recycling and regeneration test. Fresh electrolyte was used in every test. The cell was ultrasonically cleaned by 0.1 M HCl, water and ethanol between each test.The current change during all test cycles is shown in Fig. 7, while the degradation performances are listed in Table 5. For the cycles without regeneration of electrode, the current and charge dropped after the 1st cycle, which led to a decrease of MO degradation efficiency. No obvious change of current was found between the 2nd and 3rd cycles. After regeneration of electrode by negative potential sweep, the current and charge in the 4th cycle increased along with MO degradation efficiency. After several cycles of regenerating and recycling, the performance of recycled electrode returned to the same level as the fresh electrode. PXRD patterns of Ti2O3 thin film electrode before and after repeated tests were collected (Fig. 8). No obvious change in phase composition and crystallinity of the electrocatalyst was found during the whole recycling test. The decrease of degradation efficiency may come from the destruction of active surface sites on the electrocatalyst for oxidation reaction during electrocatalytic reaction process. Previous research indicated that 3–4 atomic layers of oxygen-deficient anatase TiO2 formed on the surface of Ti2O3 after electrolysis.32 Ti3+ on the surface may be oxidized to Ti4+, along with additional oxygen coordinating with Ti atoms, possibly causing a structural rearrangement on the surface which cannot be detected by PXRD. However, we have shown that the active surface sites can be regenerated by a quick linear scan to negative potential and the degradation efficiency will return to the same level as first usage. This may suggest that surface oxidation can be reversed. In summary, Ti2O3 thin film retained its crystallinity and structure during electrocatalytic tests, and the performance of Ti2O3 thin film electrode can be recovered by a simple regenerating method, which will extend the service life of the electrocatalyst.
| Cycle | 1 | 2 | 3 | 4 | 5 | 6 |
|---|---|---|---|---|---|---|
| Charge/C | 8.70 | 6.48 | 5.99 | 7.36 | 8.50 | 9.24 |
| Degradation % | 97.3 | 76.9 | 65.3 | 82.7 | 85.3 | 95.0 |
Conclusions
A simple, low cost, earth abundant and stable Ti2O3 thin film electrode was prepared and its application was studied in chlorine-driven water treatment system. PXRD studies showed that by controlling the temperature and time of heating under air in the immobilizing procedure, the structure of Ti2O3 can be retained. The Ti2O3 electrode was found to be more effective for free chlorine evolution in neutral 0.1 M chloride solution than plain FTO glass. It has a high efficiency in degrading MO (97.9% in 1.5 h) and TC (78.0% in 1.5 h) via free chlorine evolution. Mechanistic studies showed that free chlorine was the major species that oxidizes the organic pollutant molecules, while DET reactions also participated in the degradation of pollutants. The thin film electrode was able to be recycled and regenerated to keep a high performance in 6 cycles of usage. Future work will focus on the detailed mechanism of the electrocatalytic system containing Ti2O3 thin film electrode and chloride, aiming to detect harmful side products like ClO4− and halogenated organic compounds, which have been reported possible in previous studies.8,11 Modifications of Ti2O3 such as introducing oxygen vacancies on the surface have been reported in previous research,33 which is a possible way of enhancing activity of Ti2O3 electrocatalysts. Overall, we believe that Ti2O3 materials can be applied in complex wastewater treatment including organic compound degradation and microbes inactivation.Conflicts of interest
There are no conflicts to declare.Acknowledgements
The author would like to thank Nicola Cayzer from the School of Geoscience, University of Edinburgh for SEM measurement.References
- F. C. Moreira, R. A. R. Boaventura, E. Brillas and V. J. P. Vilar, Appl. Catal., B, 2017, 202, 217–261 CrossRef CAS.
- Y. Shu, M. Hu, M. Zhou, H. Yin, P. Liu, H. Zhang and H. Zhao, Mater. Chem. Front, 2023, 7, 2528–2553, 10.1039/d2qm01294d.
- B. P. Chaplin, Environ. Sci.: Processes Impacts, 2014, 16, 1182–1203 RSC.
- J. Radjenovic and D. L. Sedlak, Environ. Sci. Technol., 2015, 49, 11292–11302 CrossRef CAS PubMed.
- P. Duan, X. Jia, J. Lin and R. Xia, J. Appl. Electrochem., 2021, 51, 183–195 CrossRef CAS.
- G. Wang, Y. Liu, J. Ye, Z. Lin and X. Yang, Chemosphere, 2020, 241, 125084 CrossRef CAS PubMed.
- Q. Zhuo, S. Deng, B. Yang, J. Huang and G. Yu, Environ. Sci. Technol., 2011, 45, 2973–2979 CrossRef CAS PubMed.
- Z. Chen, Y. Liu, W. Wei and B. J. Ni, Environ. Sci.: Nano, 2019, 6, 2332–2366 RSC.
- L. Zhang, J. Liang, X. He, Q. Yang, Y. Luo, D. Zheng, S. Sun, J. Zhang, H. Yan and B. Ying, et al. , Inorg. Chem. Front., 2023, 10, 2100–2106 RSC.
- W. Wu, Z. H. Huang and T. T. Lim, J. Environ. Chem. Eng., 2016, 4, 2807–2815 CrossRef CAS.
- L. Wang, J. Lu, L. Li, Y. Wang and Q. Huang, Water Res., 2020, 170, 115254 CrossRef CAS PubMed.
- Y. Wang, Y. Liu, D. Wiley, S. Zhao and Z. Tang, J. Mater. Chem. A, 2021, 9, 18974–18993, 10.1039/d1ta02745j.
- E. Mostafa, P. Reinsberg, S. Garcia-Segura and H. Baltruschat, Electrochim. Acta, 2018, 281, 831–840 CrossRef CAS.
- A. R. Zeradjanin, N. Menzel, W. Schuhmann and P. Strasser, Phys. Chem. Chem. Phys., 2014, 16, 13741–13747 RSC.
- J. Liang, L. Zhang, X. He, Y. Wang, Y. Luo, D. Zheng, S. Sun, Z. Cai, J. Zhang and K. Ma, et al. , J. Mater. Chem. A, 2022, 11, 1098–1107 RSC.
- K. S. Exner, J. Anton, T. Jacob and H. Over, Angew. Chem., Int. Ed., 2014, 53, 11032–11035 CrossRef CAS PubMed.
- Y. Li, Y. Zhu, M. Wang, M. Zhao, J. Xue, J. Chen, T. Wu and S. A. Chambers, Adv. Funct. Mater., 2022, 32, 2203491 CrossRef CAS.
- Y. Li, Z. G. Yu, L. Wang, Y. Weng, C. S. Tang, X. Yin, K. Han, H. Wu, X. Yu and L. M. Wong, et al. , Nat. Commun., 2019, 10, 1–11 CrossRef PubMed.
- Y. Li, Y. Yang, X. Shu, D. Wan, N. Wei, X. Yu, M. B. H. Breese, T. Venkatesan, J. M. Xue and Y. Liu, et al. , Chem. Mater., 2018, 30, 4383–4392 CrossRef CAS.
- Y. Li, Y. Weng, X. Yin, X. Yu, S. R. S. Kumar, N. Wehbe, H. Wu, H. N. Alshareef, S. J. Pennycook and M. B. H. Breese, et al. , Adv. Funct. Mater., 2018, 28, 1–11 Search PubMed.
- S. Tominaka, Chem. Commun., 2012, 48, 7949–7951 RSC.
- A. R. Park, D. Y. Son, J. S. Kim, J. Y. Lee, N. G. Park, J. Park, J. K. Lee and P. J. Yoo, ACS Appl. Mater. Interfaces, 2015, 7, 18483–18490 CrossRef CAS PubMed.
- H. Chen, J. Liang, L. Li, B. Zheng, Z. Feng, Z. Xu, Y. Luo, Q. Liu, X. Shi and Y. Liu, et al. , ACS Appl. Mater. Interfaces, 2021, 13, 41715–41722 CrossRef CAS PubMed.
- X. Zhu, P. Wang, Z. Wang, Y. Liu, Z. Zheng, Q. Zhang, X. Zhang, Y. Dai, M. H. Whangbo and B. Huang, J. Mater. Chem. A, 2018, 6, 12718–12723 RSC.
- H. Y. Qu, X. He, Y. Wang and S. Hou, Appl. Sci., 2021, 11, 4320, DOI:10.3390/app11104320.
- D. L. Harp, Current Technology of Chlorine Analysis for Water and Wastewater, Booklet No.17, Hach Company, 2002 Search PubMed.
- C. Kim, S. Kim, S. P. Hong, J. Lee and J. Yoon, Phys. Chem. Chem. Phys., 2016, 18, 14370–14375 RSC.
- J. Huang, M. Hou, J. Wang, X. Teng, Y. Niu, M. Xu and Z. Chen, Electrochim. Acta, 2020, 339, 1–9 CrossRef.
- K. Xiong, L. Peng, Y. Wang, L. Liu, Z. Deng, L. Li and Z. Wei, J. Appl. Electrochem., 2016, 46, 841–849 CrossRef CAS.
- K. Sood, S. Rana, R. Wadhwa, K. K. Bhasin and M. Jha, Adv. Mater. Interfaces, 2022, 9, 2201138 CrossRef CAS.
- H. Li, Y. Chen, J. Long, D. Jiang, J. Liu, S. Li, J. Qi, P. Zhang, J. Wang and J. Gong, et al. , J. Hazard. Mater., 2017, 333, 179–185 CrossRef CAS PubMed.
- Y. Yao, H. Wang, K. Dong, H. Li, J. Liang, R. Li, S. Sun, Z. Cai, X. He and D. Zheng, et al. , J. Mater. Chem. A, 2023, 11, 22154–22160 RSC.
- H. J. Chen, Z. Q. Xu, S. Sun, Y. Luo, Q. Liu, M. S. Hamdy, Z. S. Feng, X. Sun and Y. Wang, Inorg. Chem. Front., 2022, 9, 4608–4613 RSC.
Footnote |
| † Electronic supplementary information (ESI) available. See DOI: https://doi.org/10.1039/d3ma00908d |
| This journal is © The Royal Society of Chemistry 2024 |

