DOI:
10.1039/D3MA00984J
(Paper)
Mater. Adv., 2024,
5, 2430-2440
Environment-friendly approach for synthesis of promising porous carbon: empowering supercapacitors for a sustainable future
Received
9th November 2023
, Accepted 18th January 2024
First published on 24th January 2024
Abstract
This work reports, for the first time, the conversion of polyethylene oxide (PEO) into porous carbon (PC) and its application in supercapacitors (SC). For applications in contemporary technology, PCs and related materials are found extensively in nature. Due to the irreplaceable unique characteristics of PC, such as its tunable pore volume and pore size, physical and chemical stability, and very high surface area, there can be a broader range of applications. Along with these, its good catalytic properties and low cost make PC a better choice as an electrode material for SC. Therefore, this work assessed the synthesis of PC from PEO by using concentrated sulfuric acid (con. H2SO4) as an activating agent. Detailed studies related to the PC synthesized here were conducted, and its potential applications in SC were thoroughly investigated. The fabricated SC cell showed the highest specific capacitance of ∼100 F g−1 at 5 mV s−1 with ionic liquid (EMImTCM)-incorporated PVDF-HFP solid polymer electrolyte. Therefore, this study not only advances our understanding of PEO as a new precursor for synthesis of PC, but also offers tangible insights to propel progress toward a future with more sustainable and efficient energy.
1. Introduction
In an era of escalating energy demands for smart and other energy-consuming devices, there is an increasing need to devise alternative green and sustainable energy generation options to fulfill the global energy demands. Therefore, the focus has recently shifted toward generating new energy storage devices that are relevant in the present scenario and also open prospects for different kinds of energy operating devices. In energy storage devices, electrode or electrode materials are of the utmost importance as they determine their performance and applicability in various areas. Porous carbon (PC) materials are used in devices for water purification, chromatography, gas separation, catalyst support, energy storage, and conversion. Therefore, PC is known as the best and most economical choice as electrode material to increase the performance of such devices. The PC material is a carbon-derived material with pores in it. A typical PC-based carbon skeleton comprises of a haphazardly distributed network of defective graphene layers or aromatic sheets. The PC is further described and characterized by the pore size, such as pores greater than 50 nm, known as macropores; less than 2 nm, known as micropores; and pores of 2–50 nm, known as mesopores.1,2 It has already been reported in the literature that PC has exceptional characteristics, such as high electrical conductivity, surface area, and chemical stability, along with large pore volume. Due to these properties, it is suitable for use as electrode material. However, there is an urgent need to derive good-quality carbon from environment-friendly sources.3–7 Nowadays, various studies have endeavored to synthesize high volumes of PC from waste materials,8–10 polyvinyl chloride,11–13 corn starch,14 orange-apple peels,15etc. These sources offer a cheap and environmentally friendly path to obtaining good quality electrode materials. Moreover, people have used commercial high-grade PC-based electrodes for various applications. However, they are very costly to use. Standard-grade PC and natural, environmentally friendly carbon precursors, such as peanut shells, coconut shells, palm shells, coal, rice husk,16 sucrose,17 pine cone flowers,18 quince leaves,19 organic polymers,20,21etc.18–28 are being utilized for the development of PC for electrode application in SC. Among these, organic polymers are the best choice for the synthesis of PC due to their controlled composition and structure, consistent properties, high carbon content, less ash content, and high purity. Therefore, many organic polymers, such as carbazole-terephthalaldehyde-based co-polymer,29 poly (para-phenylenediamine),30 polyvinyl chloride,10 polystyrene,31 polypyrrole,32 chitosan,33etc. have been used for the synthesis of different kinds of PC for supercapacitor (SC).
In energy storage devices, SCs have grabbed attention due to their high-power density, higher cyclic stability, and low internal resistance that is based on ion adsorption and can promptly accumulate and release charges at the electrolyte/electrode interface, either electrostatically or electrochemically. Due to these properties, SC could be a potential replacement for other energy storage options.34–36 SC are further categorized into three classes, according to their charge storage mechanisms. These categories are EDLC, pseudo-capacitors, and hybrid capacitors. Many active electrode materials have been used in SC, such as different forms of carbons, metal oxides, conducting polymers, and their composites. These materials have their advantages and disadvantages but carbon-based materials are an excellent choice among these for the EDLC-type devices. Particularly, PCs derived from organic polymers, such as methylcellulose,37 PVC,10,38 poly(divinylbenzene-co-vinylbenzyl chloride),39etc.33 have been applied in SC.
As discussed in the previous section, many organic polymers have been used for the synthesis of PC, but no reports are available on the use of polyethylene oxide (PEO)-derived PC and its application in SC. Therefore, in this work, PC was synthesized for the first time from eco-friendly PEO precursors using concentrated H2SO4 as an activating agent. PEO is cheaper and the yield of the final product (i.e., PC) is ∼40% which is sufficient for utilization in future energy applications. Furthermore, a well-organized laboratory scale prototype of an EDLC was efficaciously fabricated using this PC as an electrode material and an IL-doped polymer film as an electrolyte sandwiched in between the electrodes. The fabricated EDLC cell showed the highest specific capacitance of ∼ 100 F g−1 at 5 mV s−1 with ionic liquid (EMImTCM)- incorporated PVDF-HFP solid polymer electrolyte.
2. Experimental techniques
2.1. Materials
PEO was used as the precursor to synthesize a PC material. Other chemicals, such as acetone, H2SO4, poly (vinylidene fluoride-co-hexa-fluoropropylene; PVDF-HFP), hydrochloric acid (HCl), and ionic liquid (IL: 1-ethyl-3-methylimidazolium tricyanomethanide, EMImTCM)-doped polymer electrolyte were prepared via solution cast technique reported by our group previously. All the above-mentioned materials and chemicals were purchased from Sigma Aldrich. The current collector, i.e., graphite sheet, was purchased from Nickunj Eximp Entp P Ltd, Mumbai.
2.2. Synthesis of porous carbon using PEO activated with H2SO4
For the synthesis of pure carbon (nonporous) and activated porous carbon (porous), two types of carbon were prepared. One was pure carbon synthesized by PEO, and the other one was prepared by using H2SO4 as the activating agent by chemical activation method with pre-carbonization treatment of the PEO polymer.
To prepare pure carbon from the PEO polymer, PEO was carbonized in a tubular furnace in an inert atmosphere at 5 °C min−1 ramp up to 800 °C with half an hour of hold at maximum temperature. Using the same ramp rate, the sample was brought to room temperature. To prepare porous carbon, PEO was mixed in a concentrated H2SO4 solution as an activating agent for 6–8 hours. The mixture was then carbonized in a tubular furnace in an inert gas environment at 5 °C min−1 ramp rate up to 800 °C with half an hour hold at a certain temperature. The sample was brought back to the ambient environment with the same ramp of 5 °C min−1. Both the carbon types were prepared and washed with HCl, followed by double distilled water in a vacuum filtration unit. Finally, the prepared carbon samples were kept in a vacuum oven at 90 °C to dry them. Pure carbon derived from PEO and the H2SO4-activated PC derived from PEO were named U-C (un-activated carbon) and A-PC (activated porous carbon), respectively.
2.3. Fabrication of porous carbon electrodes
To prepare the EDLC electrode materials, a slurry of both carbon materials fabricated here was prepared by using the binder, PVDF-HFP, in an N-methylpyrrolidone (NMP) solution. Here, 10 wt% binder PVDF-HFP was dissolved in NMP solution and stirred with a magnetic stirrer for 3–4 hours. Then, 90 wt% of prepared carbon material was mixed in the binder solution and kept for ultra-sonication for 4–5 hours to achieve uniform mixing. Finally, the slurry of both the prepared carbon types (∼1 mg) was coated on a current collector, i.e., graphite sheet of area 1 × 1 cm2, followed by overnight vacuum drying in a vacuum oven at 90 °C.
2.4. Synthesis of polymer electrolyte
Ionic liquid (EMImTCM)-incorporated PVDF-HFP solid polymer electrolyte film was prepared by using the solution cast technique. Firstly, the host polymer, PVDF-HFP, was mixed in acetone with continuous magnetic stirring for 4–5 hours in an ambient atmosphere until a homogenously dissolved solution was obtained. Next, 300 wt% ionic liquid (EMImTCM) was added to the same solution, and continuous magnetic stirring was applied for 4–5 hours at room environment to achieve a uniform mixing of IL in the PVDF-HFP solution. At last, the prepared solution of IL-incorporated polymer was poured into a Petri dish, which allowed the solvent acetone to evaporate slowly, followed by vacuum drying to remove the remaining traces of solvent in an IL-incorporated polymer.40 Related studies on ionic liquid (EMImTCM)-incorporated PVDF-HFP polymer electrolytes included Fourier transform infrared spectroscopy (FTIR), X-ray diffraction (XRD), thermo-gravimetric analysis (TGA), and polarized optical microscopy (POM); these were performed by our group previously and are available in the literature.40 The highest ionic conductivity value shown by 300 wt% IL in PVDF-HFP was 3.7 × 10⁻² S cm−1, and the electrochemical stability window (ESW) was 2.0 V. The dielectric-related properties of prepared IL-incorporated PVDF-HFP electrolyte films, such as relaxation frequency, dielectric constant, time, and dielectric loss tangent (Tan![[thin space (1/6-em)]](https://www.rsc.org/images/entities/char_2009.gif) δ), have also been reported in the literature.40
δ), have also been reported in the literature.40
2.5. Fabrication of EDLC
Two EDLCs were prepared by using pure carbon derived from PEO and H2SO4-activated PC derived from PEO. To fabricate an EDLC, the current collector, i.e., a graphite sheet, was cut into 1 cm × 1 cm, and a slurry of the carbon material (∼1 mg) was coated on the current collector (as discussed above in Section 2.3). Optimized 300 wt% ionic liquid (EMImTCM)-incorporated PVDF-HFP solid polymer electrolyte film was sandwiched in between two prepared symmetric electrodes of EDLC further to perform the studies CV and LIS.
3. Results and discussion
3.1. X-Ray diffraction (XRD) analysis
The archetypal pattern of XRD was obtained for both carbon-based materials, i.e., pure carbon derived from PEO (U-C) and H2SO4-activated PC derived from PEO (A-PC) as shown in Fig. 1. The U-C patterns show two 2-theta broaden diffraction peaks, 23.46 and 44.27, corresponding to (002) and (101) graphitic planes, which coincide with JCPDS Card No. 41-1487, indicating the predominance of amorphous phase in a prepared carbon. In the XRD pattern of A-PC, a reduction in peak intensity and an increase in peak broadening suggests a more amorphous nature of A-PC.
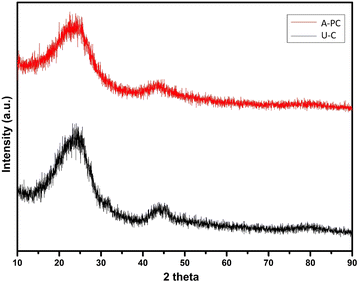 |
| | Fig. 1 XRD profile of samples, U-C and A-PC. | |
3.2. RAMAN analysis
RAMAN spectroscopy studies were performed on the synthesized (U-C) and (A-PC) materials to verify uniformity, purity, graphitization, and deformation of the prepared carbon materials before they were used as electrodes for EDLC application. Typical RAMAN spectra of the prepared carbon materials, (U-C) and (A-PC), derived from PEO are shown in Fig. 2. The spectra show a characteristic peak for both carbon-based materials, i.e., (U-C) and (A-PC), which corresponds to the “D” and “G” bands. The “D” band, known as the deformation band, originates from the induced defects of the sp2 rings breathing mode because of the oxygen-containing functional group. The “G” band is known for the scattering first order of sp2 C atoms of the E2g phonon.
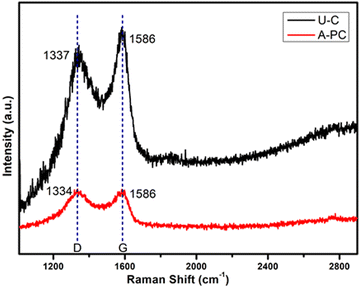 |
| | Fig. 2 RAMAN profile of samples, U-C and A-PC. | |
Additionally, the ratio of intensity, ID/IG, represents the quality and defects in a carbon matrix. For material (U-C), the presence of the “D” band at 1337 cm−1 and the “G” band at 1586 cm−1 indicates that fewer defects are present in the (U-C) material. The ratio of ID/IG = 0.91 shows a lower degree of graphitization. For material (A-PC), the presence of the “D” band at 1334.24 cm−1 and the “G” band at 1585.19 cm−1, along with the ratio of ID/IG = 1.02, shows the occurrence of more significant defects as compared to the (U-C) material. Defects in the carbon matrix can improve the electrochemical performance of a cell.41 The ID/IG value of 1.02 was lower than that for (U-C), representing a considerably higher graphitization degree. The RAMAN spectra thus provided good justification for the (A-PC) material having significant defects in their carbon matrix; these results are consistent with the XRD pattern.
3.3. Field emission scanning electron microscopy (FESEM)
FESEM analysis was performed on both the samples, i.e. (U-C) and (A-PC), to study the surface morphology of the prepared carbon-based materials derived from PEO polymer; results are shown in Fig. 3 at 400 nm scale. The SEM micrograph of the sample (U-C) shows a very dense morphology, revealing the less porous nature of the material. On the other hand, the SEM micrograph of (A-PC) shows the porous nature of the prepared material, which is the very first requirement to enhance the capacitive behavior of EDLC. This observation is also justified by the electrical characteristics of EDLC as discussed below in the Device Performance section.
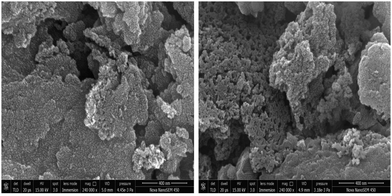 |
| | Fig. 3 FESEM profile of U-C and A-PC samples. | |
3.4. Brunauer–Emmett–Teller (BET)
The functional capability of porous carbon is contingent on porosity and surface area. The process of activating a carbon through different activating agents leads to a porous nature by widening the existing pores, formation of new pores, improving formerly inaccessible pores, and amalgamation of existing pores. The BET analysis is the best method to identify the surface area and pores development in a carbon-based material. The N2 adsorption–desorption isotherm graph of U-C and A-PC derived from PEO polymer is shown in Fig. 4(a).
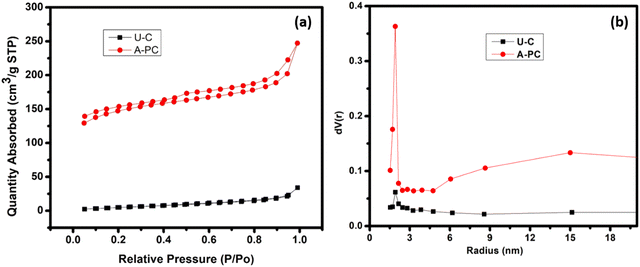 |
| | Fig. 4 (a) BET N2 adsorption/desorption isotherm profile of samples, U-C and A-PC; (b) pore size distribution in U-C and A-PC. | |
Quantifiable information, such as surface area, pore volume, micropore, mesopore, and average pore, for U-C and A-PC derived from PEO is listed in Table 1.
Table 1 Brief data on the surface area, pore volume, and pore diameter of samples, U-C and A-PC
| U-C |
A-PC |
| Surface area |
17.3342 m2 g−1 |
Surface area |
628.2565 m2 g−1 |
| Pore volume |
0.0491 cc g−1 |
Pore volume |
0.3595 cc g−1 |
| Average pore diameter Dv |
8.97 nm |
Average pore diameter Dv |
2.82 nm |
From Fig. 4(a), it can be seen that A-PC derived from PEO shows the H4-type hysteresis according to IUPAC classification, which is referred to as type-IV isotherm. The rapid increase in the isotherm signifies micropores (<2 nm) and the hill area is indicative of mesopores (2–50 nm). The H4-type hysteresis usually occurs for complex materials with both micropores and mesopores, which is well organized shown by the A-PC sample. On the other hand, pure carbon, i.e., U-C derived from PEO, features a nonporous nature as shown in Fig. 4(a). Finally, two EDLC cells were fabricated using U-C and A-PC as active materials derived from PEO polymer. Fig. 4(b) shows the pore size distribution pattern of U-C and A-PC.
3.5. Transmission electron microscopy (TEM)
Transmission electron microscopy (TEM) analysis provides invaluable insights into the microstructural characteristics of porous carbon materials, including activated porous carbon with disordered carbonaceous matrix and visible pores. In the non-activated porous carbon sample, i.e., (U-C), large chunks of a carbonaceous matrix were prominently visible, depicted by the yellow rectangles in Fig. 5(a). These regions indicate the presence of an inactivated, disordered carbonaceous structure. Upon acid-induced activation, a remarkable transformation occurs within the porous carbon structure. The acid treatment exfoliates the matrix, resulting in wide openings or enlarged pores, as depicted by the yellow dotted circles in Fig. 5(d). This activation process creates more accessible pathways and increases the overall porosity of the (U-C) material.42 The wider openings can facilitate enhanced adsorption and catalytic activities, making the activated carbon suitable for the present application. The large openings in the matrix of activated carbon sample, (A-PC), are highlighted with an arrow in Fig. 5(e). The selected area electron diffraction (SAED) patterns were analyzed to further understand the structural changes induced by activation. Fig. 5(c) illustrates the SAED pattern of non-activated carbon (U-C), where we can readily observe a few distinct diffraction spots but no lattice fringes. This pattern hints at the materials’ partial graphitic or less ordered crystalline nature. The presence of diffraction spots confirms that there are specific crystallographic planes within the material. However, the absence of lattice fringes suggests that the atomic arrangement is irregular or at least well-defined enough to produce fine lines or bands that are often seen in highly crystalline materials. Fig. 5(c), corresponding to the non-activated carbon sample, (U-C), reveals a distinct diffraction pattern indicative of its partially graphitic nature. The presence of clear diffraction spots and concentric rings signifies the ordered arrangement of carbon atoms within the crystalline structure.43 In contrast, the SAED pattern of the acid-induced activated porous carbon, shown in Fig. 5(f), exhibits a completely amorphous behavior. The absence of discernible diffraction spots or rings indicates a disordered arrangement of carbon atoms. This amorphous nature results from the exfoliation and removal of the graphitic layers during the activation process.
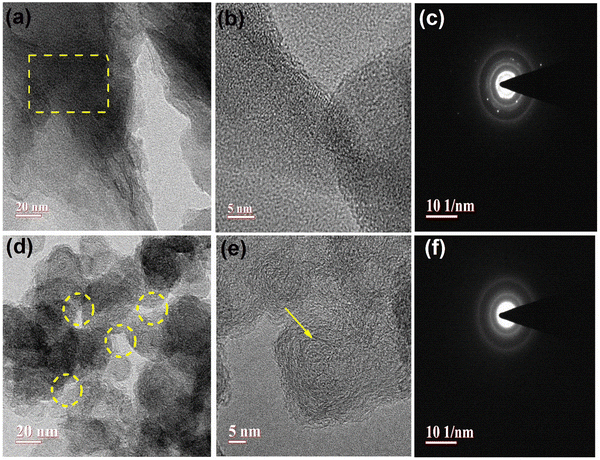 |
| | Fig. 5 High-resolution TEM analysis of a U-C sample, (a), (b), and (c); A-PC (d), (e), and (f). | |
3.6. X-ray photoelectron spectroscopy (XPS)
XPS analysis provides valuable insights into the elemental composition and chemical states of porous carbon, U-C, and activated porous carbon, A-PC. The XPS spectra of both U-C and A-PC demonstrate the presence of carbon (C) and oxygen (O) in the material, revealing the surface composition of the samples. Notably, the C![[thin space (1/6-em)]](https://www.rsc.org/images/entities/char_2009.gif) :
:![[thin space (1/6-em)]](https://www.rsc.org/images/entities/char_2009.gif) O ratio changes upon acid-induced activation, suggesting alterations in the material's surface chemistry. By deconvoluting the XPS spectra of the activated porous carbon (Fig. 6), several distinct peaks were observed in the C 1s region. At 284.57 eV, a prominent peak corresponded to C 1s, highlighting the presence of C
O ratio changes upon acid-induced activation, suggesting alterations in the material's surface chemistry. By deconvoluting the XPS spectra of the activated porous carbon (Fig. 6), several distinct peaks were observed in the C 1s region. At 284.57 eV, a prominent peak corresponded to C 1s, highlighting the presence of C![[double bond, length as m-dash]](https://www.rsc.org/images/entities/char_e001.gif) C structures. This peak indicates the existence of aromatic or conjugated carbon bonds within the carbonaceous matrix. Additionally, a relatively smaller peak appeared at 286.22 eV corresponding to sp3 hybridized carbon atoms; it was indicative of aliphatic carbon species. Another peak at 287.72 eV corresponded to oxygen-containing functional groups attached to the carbon, such as carbonyl or hydroxyl groups. Upon acid-induced activation, changes occurred in the deconvoluted spectra of the activated porous carbon. The intensity of the C 1s peak corresponding to C
C structures. This peak indicates the existence of aromatic or conjugated carbon bonds within the carbonaceous matrix. Additionally, a relatively smaller peak appeared at 286.22 eV corresponding to sp3 hybridized carbon atoms; it was indicative of aliphatic carbon species. Another peak at 287.72 eV corresponded to oxygen-containing functional groups attached to the carbon, such as carbonyl or hydroxyl groups. Upon acid-induced activation, changes occurred in the deconvoluted spectra of the activated porous carbon. The intensity of the C 1s peak corresponding to C![[double bond, length as m-dash]](https://www.rsc.org/images/entities/char_e001.gif) C structures decreased significantly, suggesting a reduction in the content of aromatic or conjugated carbon bonds. Furthermore, this peak shifted to 284.28 eV from its initial position at 284.57 eV, indicating alterations in the electronic structure or the bonding environment of these carbon atoms. Conversely, a larger peak could be observed at 286.53 eV, corresponding to sp3 hybridized carbon atoms. The increase in the last peak suggests an enhancement in aliphatic carbon species, possibly resulting from the breakdown or exfoliation of the carbonaceous matrix during activation. Additionally, the peak at 287.72 eV, which is associated with oxygen-containing functional groups, remains present, albeit potentially with an altered intensity due to changes in the material's surface chemistry.44 The O 1s spectra also provide insights into the effect of activation on the oxygen moieties. While the specific details of the O 1s spectra were not studied, they likely exhibit changes in peak positions or intensities, reflecting alterations in the oxygen functional groups present on the surface of the activated carbon. Additionally, the XPS spectra of the porous carbon sample revealed a peak at 350.37 eV, suggesting a lower fraction of epoxy or ethereal linkages on the surface.45,46 However, upon acid-induced activation, a higher degree of oxidation in the functional moieties was observed, indicating an increase in the presence of oxygen-containing groups. In the XPS spectrum of the non-activated carbon sample, deconvolution of the O 1s peak revealed two distinct components at binding energies of 531.82 and 532.92 eV. Upon activation, these peaks underwent a subtle shift, whereby they were positioned at 532.08 and 532.98 eV, respectively. The peak observed at 531.82 eV in the non-activated carbon can typically be ascribed to oxygen in the hydroxyl (OH) groups. The shift to 532.08 eV in the activated sample suggests a possible increase in the electron density around the oxygen atom, which could result from the removal of acidic functionalities upon heating. Similarly, the peak at 532.92 eV in the non-activated sample, which shifted to 532.98 eV upon activation, corresponded to oxygen atoms in the carbonyl (C
C structures decreased significantly, suggesting a reduction in the content of aromatic or conjugated carbon bonds. Furthermore, this peak shifted to 284.28 eV from its initial position at 284.57 eV, indicating alterations in the electronic structure or the bonding environment of these carbon atoms. Conversely, a larger peak could be observed at 286.53 eV, corresponding to sp3 hybridized carbon atoms. The increase in the last peak suggests an enhancement in aliphatic carbon species, possibly resulting from the breakdown or exfoliation of the carbonaceous matrix during activation. Additionally, the peak at 287.72 eV, which is associated with oxygen-containing functional groups, remains present, albeit potentially with an altered intensity due to changes in the material's surface chemistry.44 The O 1s spectra also provide insights into the effect of activation on the oxygen moieties. While the specific details of the O 1s spectra were not studied, they likely exhibit changes in peak positions or intensities, reflecting alterations in the oxygen functional groups present on the surface of the activated carbon. Additionally, the XPS spectra of the porous carbon sample revealed a peak at 350.37 eV, suggesting a lower fraction of epoxy or ethereal linkages on the surface.45,46 However, upon acid-induced activation, a higher degree of oxidation in the functional moieties was observed, indicating an increase in the presence of oxygen-containing groups. In the XPS spectrum of the non-activated carbon sample, deconvolution of the O 1s peak revealed two distinct components at binding energies of 531.82 and 532.92 eV. Upon activation, these peaks underwent a subtle shift, whereby they were positioned at 532.08 and 532.98 eV, respectively. The peak observed at 531.82 eV in the non-activated carbon can typically be ascribed to oxygen in the hydroxyl (OH) groups. The shift to 532.08 eV in the activated sample suggests a possible increase in the electron density around the oxygen atom, which could result from the removal of acidic functionalities upon heating. Similarly, the peak at 532.92 eV in the non-activated sample, which shifted to 532.98 eV upon activation, corresponded to oxygen atoms in the carbonyl (C![[double bond, length as m-dash]](https://www.rsc.org/images/entities/char_e001.gif) O) groups. Minor changes in the peak position are indicative of changes in the electronic environment upon heating.
O) groups. Minor changes in the peak position are indicative of changes in the electronic environment upon heating.
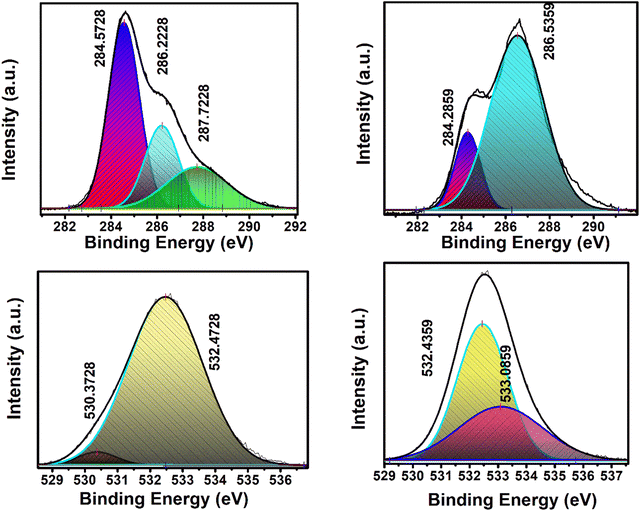 |
| | Fig. 6 High-resolution XPS spectra of U-C and A-PC. | |
4. EDLC Performance
4.1. Cyclic voltammetry (CV)
CV analysis was conducted on U-C and A-PC-based cells at various scan rates of 5, 10, 20, 50, 100, 200, and 500 mV s−1 with a potential range of −1 to 1 V (Fig. 7 and 8). Furthermore, the performance of U-C and A-PC-based cells was tested for a large range of potential (−0.8 to 0.8, −1.0 to 1.0, −1.2 to 1.2, and −1.4 to 1.4 V) with a scan rate of 50 mV s−1 (Fig. 7 and 8). The CV curves of U-C and A-PC-based cells showed typical EDLC-type curves with good cyclic reversibility over the tested scan rates. Additionally, over the large potential window, both cells showed good stability and performed well.
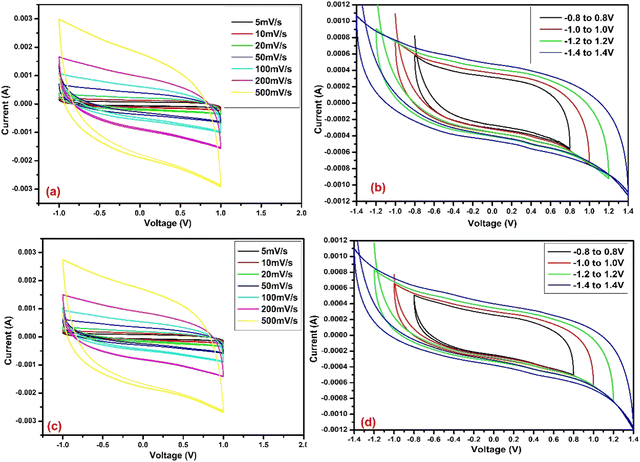 |
| | Fig. 7 CV curve of U-C (a) at various scan rates, (b) at various voltage ranges, (c) at various scan rates after 30 days, and (d) at various voltage ranges after 30 days. | |
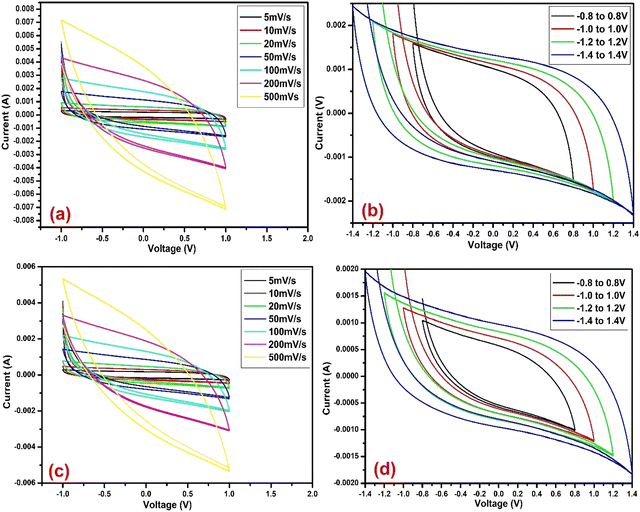 |
| | Fig. 8 CV curve of A-PC (a) at various scan rates, (b) at various voltage ranges, (c) at various scan rates after 30 days, and (d) at various voltage ranges after 30 days. | |
Apart from the cyclic behavior of the cell, CV was used to estimate specific capacitance, which is a measure of the amount of charge that can be stored per unit mass of the electrode material by using the following formula:
where
C is the specific capacitance;
i is current, and
s is the scan rate.
From these CVs, it can be concluded that A-PC-based cells stored more charge than the U-C-based cells at the interface of the electrode and electrolyte by the formation of a double layer. Therefore, A-PC-based cells showed more specific capacitance than pure U-C-based cells. The highest specific capacitance showed by the A-PC-based cell, i.e., 88.80 F g−1 at 5 mV s−1 (Table 4), was much higher than the specific capacitance of the U-C-based cell, i.e., 26.58 F g−1, at the same scan rate (Table 2). Furthermore, the stability of the U-C and A-PC-based cells was tested after 30 days by performing their CV and evaluating specific capacitance. Cells based on both materials showed excellent stability even after 30 days. In addition, the specific capacitance of U-C and A-PC-based cells at various scan rates is summarized in Tables 2–5.
Table 2 U-C-based cells at various scan rates
| Scan rate (mV s−1) |
Specific capacitance (F g−1) (1st day) |
Specific capacitance (F g−1) (after 30 days) |
| 5 |
26.58 |
33.10 |
| 10 |
25.40 |
25.00 |
| 20 |
21.60 |
17.85 |
| 50 |
31.68 |
8.92 |
| 100 |
11.60 |
10.15 |
| 200 |
9.44 |
8.47 |
| 500 |
7.36 |
13.8 |
Table 3 U-C-based cell at various voltages
| Voltage (V) |
Specific capacitance (F g−1) (1st day) |
Specific capacitance (F g−1) (after 30 days) |
| −0.8 to 0.8 |
12.28 |
9.06 |
| −0.1 to 0.1 |
14.74 |
11.96 |
| −1.2 to 1.2 |
17.18 |
13.86 |
| −1.4 to 1.4 |
18.46 |
15.92 |
Table 4 A-PC-based cell at various scan rates
| Scan rate (mV s−1) |
Specific capacitance (F g−1) (1st day) |
Specific capacitance (F g−1) (after 30 days) |
| 5 |
88.80 |
72.48 |
| 10 |
68.70 |
65.54 |
| 20 |
57.75 |
46.20 |
| 50 |
42.00 |
33.44 |
| 100 |
34.30 |
45.00 |
| 200 |
26.25 |
36.50 |
| 500 |
15.84 |
22.16 |
Table 5 A-PC-based cell at various voltages
| Voltage (V) |
Specific capacitance (F g−1) (1st day) |
Specific capacitance (F g−1) (after 30 days) |
| −0.8 to 0.8 |
40.00 |
34.73 |
| −0.1 to 0.1 |
44.00 |
25.06 |
| −1.2 to 1.2 |
48.20 |
34.15 |
| −1.4 to 1.4 |
53.20 |
38.79 |
4.2. Low-frequency impedance spectroscopy (LIS)
LIS is a widely used non-destructive technique that allows the determination of the electrical properties and performance of supercapacitors over a wide range of frequencies, i.e., 0.01 to 105 Hz. Both devices show the EDLC-type behavior, which exhibited compliance with CV. The impedance spectrum typically consists of a semicircle in the high-frequency region and a straight line in the low-frequency region. The semicircle is attributed to the charge transfer resistance at the electrode–electrolyte interface, while the straight line originates from the diffusion of the electrolyte ions. Furthermore, a critical parameter extracted from the impedance spectrum is the equivalent series resistance (ESR), which represents the internal resistance of the supercapacitor. The pure U-C-based device showed an ESR of 28.83 Ω, which increased to 29.82 Ω after 30 days. In addition, the same trends were found with the A-PC-based devices. The A-PC-based device showed an ESR of 53.79 Ω, which increased further to 61.10 Ω after 30 days (Fig. 9). Although the A-PC-based device showed higher ESR than the pure U-C-based device, this device showed higher specific capacitance. The specific capacitance of the supercapacitor device is an important parameter obtained from the impedance spectrum and was indicated to be a double-layer capacitance here that was related to the amount of charge that could be stored at the electrode–electrolyte interface. Therefore, the specific capacitance of both devices was obtained from LIS via the following equation:
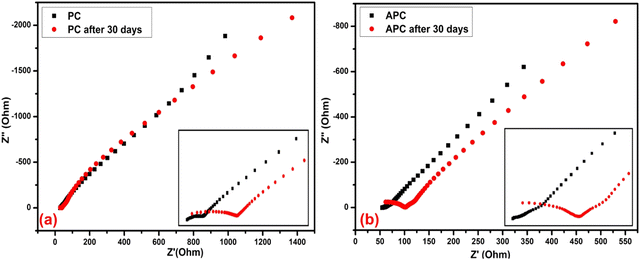 |
| | Fig. 9 EIS of the (a) U-C-based device before and after 30 days and (b) A-PC-based device before and after 30 days. | |
Here, C denotes specific capacitance; the symbol f represents frequency, while the symbol, Z′′, refers to the imaginary part of the impedance.
The pure U-C-based device showed a specific capacitance of 16.8 F g−1 that was reduced after 30 days to 15.19 F g−1. On the other hand, the A-PC-based device showed a higher specific capacitance (50.90 F g−1 and, after 30 days, 38.49 F g−1) than the pure U-C (Table 6).
Table 6 Specific capacitance from LIS
| Sample |
Specific capacitance (F g−1) (1st day) |
Specific capacitance (F g−1) (after 30 days) |
| U-C |
16.8 |
15.19 |
| A-PC |
50.90 |
38.49 |
4.3. Galvanostatic charge–discharge (GCD)
The GCD technique was performed to verify the electrochemical features of the developed EDLC using two active materials fabricated here, i.e., U-C and A-PC. A current of 1 mA was applied for the GCD technique to both cells. The GCD process was carried out for 10![[thin space (1/6-em)]](https://www.rsc.org/images/entities/char_2009.gif) 000 cycles to check the stability of the cells shown in Fig. 10(c) and (d). Fig. 10(a) and (b) show the first six cycles of both cells, and the calculated values of specific capacitance, energy density, power density, and coulombic efficiency are presented in Table 7.
000 cycles to check the stability of the cells shown in Fig. 10(c) and (d). Fig. 10(a) and (b) show the first six cycles of both cells, and the calculated values of specific capacitance, energy density, power density, and coulombic efficiency are presented in Table 7.
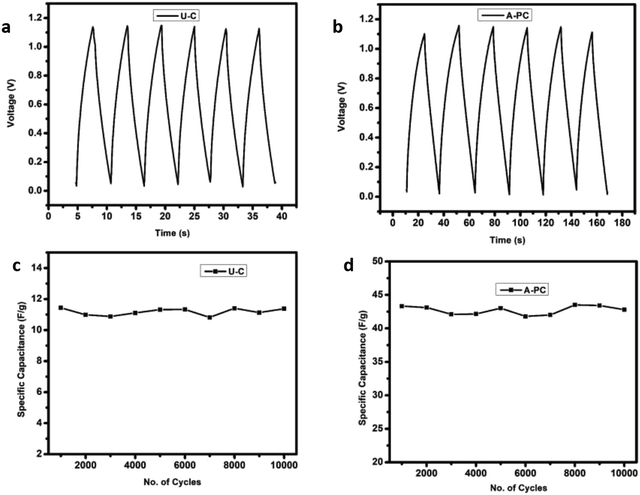 |
| | Fig. 10 GCD in the first six cycles of samples, U-C (a) and A-PC (b); stability over 10![[thin space (1/6-em)]](https://www.rsc.org/images/entities/char_2009.gif) 000 cycles of U-C (c) and A-PC (d) 000 cycles of U-C (c) and A-PC (d) | |
Table 7 Calculated specific capacitance, energy density, power density, and coulombic efficiency of the fabricated EDLC with (U-C) and (A-PC)
| Sample |
Specific capacitance (F g−1) |
Energy density (W h kg−1) |
Power density (W kg−1) |
Coulombic efficiency (%) |
| U-C |
11.44 |
1.88 |
2180.00 |
89 |
| A-PC |
43.22 |
7.13 |
2180.00 |
80 |
5. Conclusion
The synthesized A-PC from PEO was studied in detail; it is concluded that this material has the potential to be used in an electrode as an active material for use in a supercapacitor. U-C and A-PC were successfully synthesized and characterized through different techniques. The XRD peak broadening suggested a greater amorphous nature of A-PC. RAMAN spectra justified the nature of the fabricated material and were consistent with the XRD patterns. A-PC material has a significant defect inside the carbon matrix. BET analysis gives a large specific surface area of A-PC, i.e., 628.2565 m2 g−1. SEM/TEM analysis provided helpful perceptions into the microstructural characteristics of porous carbon materials, including activated porous carbon with a disordered carbonaceous matrix and visible pores. Upon acid-induced activation in A-PC, a higher degree of oxidation in the functional moieties could be achieved, indicating an increase in the presence of oxygen-containing groups. The fabricated supercapacitor showed a specific capacitance of 100 F g−1 at a scan rate of 5 mV s−1 using cyclic voltammetry and was stable for up to 30 days.
Conflicts of interest
There are no conflicts to declare.
Acknowledgements
We are extremely thankful to the CSTUP (CST/D-1041), Lucknow, Govt. of India. Partially funding was provided by the WCU Universitas Negeri Malang, Indonesia. Thanks to Sharda University for giving SEED funds (SU/SF/2023/02) to support this research.
References
-
H. Marsh and F. Rodríguez-Reinoso, Activated carbon, Elsevier, Amsterdam, 2006 Search PubMed.
- H. F. Stoeckli, Microporous carbons and their characterization: The present state of the art, Carbon, 1990, 28, 1–6 CrossRef CAS.
- J. Zhang, L. Jin and J. Cheng,
et al., Hierarchical porous carbons prepared from direct coal liquefaction residue and coal for supercapacitor electrodes, Carbon, 2013, 55, 221–232 CrossRef CAS.
- Z. Yuan, Y. Zhang and Y. Zhou,
et al., Preparation and characterization of porous carbons obtained from mixtures of furfuryl alcohol and phenol–formaldehyde resin, Mater. Chem. Phys., 2014, 143, 707–712 CrossRef CAS.
- P. Cheng, S. Gao and P. Zang,
et al., Hierarchically porous carbon by activation of shiitake mushroom for capacitive energy storage, Carbon, 2015, 93, 315–324 CrossRef CAS.
- T. Sharma, B. Gultekin and P. S. Dhapola,
et al., Ionic liquid doped Poly (methyl methacrylate) for energy applications, J. Mol. Liq., 2022, 352, 118494 CrossRef CAS.
- A. Singh, T. Sharma and P. S. Dhapola,
et al., Ionic liquid doped solid polymer electrolyte: Synthesis, characterization and applications ICSEM-2021, High Perform. Polym., 2022, 34, 645–651 CrossRef CAS.
- M. Karakoti, S. Pandey and R. Jangra,
et al., Waste plastics derived graphene nanosheets for supercapacitor application, Mater. Manuf. Processes, 2021, 36, 171–177 CrossRef CAS.
- M. Karakoti, S. Pandey and G. Tatrari,
et al., A waste to energy approach for the effective conversion of solid waste plastics into graphene nanosheets using different catalysts for high performance supercapacitors: a comparative study, Mater. Adv., 2022, 3, 2146–2157 RSC.
- P. S. Dhapola, A. Singh and M. Karakoti,
et al., Synthesis of porous carbon from a PVC polymer and its application in supercapacitors, Mater. Adv., 2022, 3, 4947–4953 RSC.
- A. Singh, P. S. Dhapola and S. Singh,
et al., Highly conducting polymer electrolyte-ionic liquid and porous carbon material for sandwich electric double layer capacitor, High Perform. Polym., 2021, 33, 469–475 CrossRef CAS.
- P. S. Dhapola, N. G. Sahoo and B. Bhattacharya,
et al., Elaborative Studies on Non-Porous Carbon Material for Super Capacitor Application, Macromol. Symp., 2019, 388, 1900035 CrossRef CAS.
- X. Liu, F. Yang and M. Li,
et al., From polyvinyl chloride waste to activated carbons: the role of occurring additives on porosity development and gas adsorption properties, Sci. Total Environ, 2022, 833, 154894 CrossRef CAS PubMed.
- G. Nath, P. K. Singh and P. S. Dhapola,
et al., Fabrication of cornstarch biopolymer-derived nano porous carbon as electrode material for supercapacitor application, Biomass Convers. Biorefin., 2022 DOI:10.1007/s13399-022-02656-1.
- E. Akman and H. S. Karapinar, Electrochemically stable, cost-effective and facile produced selenium@activated carbon composite counter electrodes for dye-sensitized solar cells, Sol. Energy, 2022, 234, 368–376 CrossRef CAS.
- G. Wang, D. Wang and S. Kuang,
et al., Hierarchical porous carbon derived from rice husk as a low-cost counter electrode of dye-sensitized solar cells, Renewable Energy, 2014, 63, 708–714 CrossRef CAS.
- M. Younas, T. N. Baroud and M. A. Gondal,
et al., Highly efficient, cost-effective counter electrodes for dye-sensitized solar cells (DSSCs) augmented by highly mesoporous carbons, J. Power Sources, 2020, 468, 228359 CrossRef CAS.
- G. Nagaraju, J. H. Lim and S. M. Cha,
et al., Three-dimensional activated porous carbon with meso/macropore structures derived from fallen pine cone flowers: A low-cost counter electrode material in dye-sensitized solar cells, J. Alloys Compd., 2017, 693, 1297–1304 CrossRef CAS.
- S. M. Cha, G. Nagaraju and S. C. Sekhar,
et al., Fallen leaves derived honeycomb-like porous carbon as a metal-free and low-cost counter electrode for dye-sensitized solar cells with excellent tri-iodide reduction, J. Colloid Interface Sci., 2018, 513, 843–851 CrossRef CAS PubMed.
- M. Kim, P. Puthiaraj and Y. Qian,
et al., High performance carbon supercapacitor electrodes derived from a triazine-based covalent organic polymer with regular porosity, Electrochim. Acta, 2018, 284, 98–107 CrossRef CAS.
- X. Liu, C.-F. Liu and S. Xu,
et al., Porous organic polymers for high-performance supercapacitors, Chem. Soc. Rev., 2022, 51, 3181–3225 RSC.
- L. Wang, R. Wang and H. Zhao,
et al., High rate performance porous carbon prepared from coal for supercapacitors, Mater. Lett., 2015, 149, 85–88 CrossRef CAS.
- T. E. Rufford, D. Hulicova-Jurcakova and Z. Zhu,
et al., Nanoporous carbon electrode from waste coffee beans for high performance supercapacitors, Electrochem. Commun., 2008, 10, 1594–1597 CrossRef CAS.
- W. C. Lim, C. Srinivasakannan and N. Balasubramanian, Activation of palm shells by phosphoric acid impregnation for high yielding activated carbon, J. Anal. Appl. Pyrolysis, 2010, 88, 181–186 CrossRef CAS.
- Y. Guo, K. Yu and Z. Wang,
et al., Effects of activation conditions on preparation of porous carbon from rice husk, Carbon, 2003, 41, 1645–1648 CrossRef CAS.
- S. Guo, J. Peng and W. Li,
et al., Effects of CO2 activation on porous structures of coconut shell-based activated carbons, Appl. Surf. Sci., 2009, 255, 8443–8449 CrossRef CAS.
- N. A. Rashidi, Y. H. Chai and I. S. Ismail,
et al., Biomass as activated carbon precursor and potential in supercapacitor applications, Biomass Convers. Biorefin., 2022 DOI:10.1007/s13399-022-02351-1.
- M. Gupta, A. Kumar and S. Sharma,
et al., Study of electrochemical properties of activated carbon electrode synthesized using bio-waste for supercapacitor applications, Biomass Convers. Biorefin., 2023, 13, 14059–14070 CrossRef CAS.
- N. Deka, J. Barman and J. Deka,
et al., Microporous Organic Polymer-Derived Nitrogen-Doped Porous Carbon Spheres for Efficient Capacitive Energy Storage, ChemElectroChem, 2019, 6, 3327–3336 CrossRef CAS.
- M. Baro, Jaidev and S. Ramaprabhu, Conductive and nitrogen-enriched porous carbon nanostructure derived from poly (para-phenylenediamine) for energy conversion and storage applications, Appl. Surf. Sci., 2020, 503, 144069 CrossRef CAS.
- C. Kim, K. Kim and J. H. Moon, Highly N-doped microporous carbon nanospheres with high energy storage and conversion efficiency, Sci. Rep., 2017, 7, 14400 CrossRef PubMed.
- A. Bello, F. Barzegar and M. J. Madito,
et al., Electrochemical performance of polypyrrole derived porous activated carbon-based symmetric supercapacitors in various electrolytes, RSC Adv., 2016, 6, 68141–68149 RSC.
- T. Wang, D. Wu and F. Yuan,
et al., Chitosan derived porous carbon prepared by amino acid proton salt for high-performance quasi-state-solid supercapacitor, Chem. Eng. J., 2023, 462, 142292 CrossRef CAS.
- J. R. Miller and P. Simon, Electrochemical Capacitors for Energy Management, Science, 2008, 321, 651–652 CrossRef CAS PubMed.
- P. Simon and Y. Gogotsi, Materials for electrochemical capacitors, Nat. Mater., 2008, 7, 845–854 CrossRef CAS PubMed.
- C. Liu, F. Li and L. Ma,
et al., Advanced Materials for Energy Storage, Adv. Mater., 2010, 22, E28–E62 CAS.
- G. Nath, P. K. Singh and P. S. Dhapola,
et al., Biodegradable methylcellulose biopolymer-derived activated porous carbon for dual energy application, Mater. Renew. Sustainable Energy, 2022, 11, 241–250 CrossRef.
- Y. Chang, Y. Pang and Q. Dang,
et al., Converting Polyvinyl Chloride Plastic Wastes to Carbonaceous Materials via Room-Temperature Dehalogenation for High-Performance Supercapacitor, ACS Appl Energy Mater, 2018, 8b01252 CrossRef.
- I. Kim, R. Vinodh and C. V. V. M. Gopi,
et al., Novel porous carbon electrode derived from hypercross-linked polymer of poly(divinylbenzene-co-vinyl benzyl chloride) for supercapacitor applications, J. Energy Storage, 2021, 43, 103287 CrossRef.
- S. Kumar, P. K. Singh and D. Agarwal,
et al., Structure, Dielectric, and Electrochemical Studies on Poly(Vinylidene Fluoride-Co-Hexafluoropropylene)/IonicLiquid 1-Ethyl-3-Methylimidazolium Tricyanomethanide-Based Polymer Electrolytes, Phys. Status Solidi A, 2022, 219, 2100711 CrossRef CAS.
- J. Zhou, J. Lian and L. Hou,
et al., Ultrahigh volumetric capacitance and cyclic stability of fluorine and nitrogen co-doped carbon microspheres, Nat. Commun., 2015, 6, 8503 CrossRef CAS PubMed.
- E. Jang, S. W. Choi and K. B. Lee, Effect of carbonization temperature on the physical properties and CO2 adsorption behavior of petroleum coke-derived porous carbon, Fuel, 2019, 248, 85–92 CrossRef CAS.
- Z. Jin, J. Wang and R. Zhao,
et al., Synthesis of S, N co-doped porous carbons from polybenzoxazine for CO2 capture, New Carbon Mater., 2018, 33, 392–401 CrossRef CAS.
- P. Chingombe, B. Saha and R. J. Wakeman, Surface modification and characterisation of a coal-based activated carbon, Carbon, 2005, 43, 3132–3143 CrossRef CAS.
- V. D. Punetha, Y.-M. Ha and Y.-O. Kim,
et al., Rapid remote actuation in shape memory hyperbranched polyurethane composites using cross-linked photothermal reduced graphene oxide networks, Sens. Actuators, B, 2020, 321, 128468 CrossRef CAS.
- V. D. Punetha, Y.-M. Ha and Y.-O. Kim,
et al., Interaction of photothermal graphene networks with polymer chains and laser-driven photo-actuation behavior of shape memory polyurethane/epoxy/epoxy-functionalized graphene oxide nanocomposites, Polymer, 2019, 181, 121791 CrossRef CAS.
|
| This journal is © The Royal Society of Chemistry 2024 |
Click here to see how this site uses Cookies. View our privacy policy here.  Open Access Article
 *a,
Manoj
Karakoti
b,
Sushant
Kumar
a,
Vinay Deep
Punetha
*c,
Monika
Matiyani
b,
N.A
Masmali
*g,
Markus
Diantoro
*de,
Serguei V.
Savilov
f and
Pramod K.
Singh
*a
![[thin space (1/6-em)]](https://www.rsc.org/images/entities/char_2009.gif) δ), have also been reported in the literature.40
δ), have also been reported in the literature.40

![[thin space (1/6-em)]](https://www.rsc.org/images/entities/char_2009.gif) :
:![[thin space (1/6-em)]](https://www.rsc.org/images/entities/char_2009.gif) O ratio changes upon acid-induced activation, suggesting alterations in the material's surface chemistry. By deconvoluting the XPS spectra of the activated porous carbon (Fig. 6), several distinct peaks were observed in the C 1s region. At 284.57 eV, a prominent peak corresponded to C 1s, highlighting the presence of C
O ratio changes upon acid-induced activation, suggesting alterations in the material's surface chemistry. By deconvoluting the XPS spectra of the activated porous carbon (Fig. 6), several distinct peaks were observed in the C 1s region. At 284.57 eV, a prominent peak corresponded to C 1s, highlighting the presence of C![[double bond, length as m-dash]](https://www.rsc.org/images/entities/char_e001.gif) C structures. This peak indicates the existence of aromatic or conjugated carbon bonds within the carbonaceous matrix. Additionally, a relatively smaller peak appeared at 286.22 eV corresponding to sp3 hybridized carbon atoms; it was indicative of aliphatic carbon species. Another peak at 287.72 eV corresponded to oxygen-containing functional groups attached to the carbon, such as carbonyl or hydroxyl groups. Upon acid-induced activation, changes occurred in the deconvoluted spectra of the activated porous carbon. The intensity of the C 1s peak corresponding to C
C structures. This peak indicates the existence of aromatic or conjugated carbon bonds within the carbonaceous matrix. Additionally, a relatively smaller peak appeared at 286.22 eV corresponding to sp3 hybridized carbon atoms; it was indicative of aliphatic carbon species. Another peak at 287.72 eV corresponded to oxygen-containing functional groups attached to the carbon, such as carbonyl or hydroxyl groups. Upon acid-induced activation, changes occurred in the deconvoluted spectra of the activated porous carbon. The intensity of the C 1s peak corresponding to C![[double bond, length as m-dash]](https://www.rsc.org/images/entities/char_e001.gif) C structures decreased significantly, suggesting a reduction in the content of aromatic or conjugated carbon bonds. Furthermore, this peak shifted to 284.28 eV from its initial position at 284.57 eV, indicating alterations in the electronic structure or the bonding environment of these carbon atoms. Conversely, a larger peak could be observed at 286.53 eV, corresponding to sp3 hybridized carbon atoms. The increase in the last peak suggests an enhancement in aliphatic carbon species, possibly resulting from the breakdown or exfoliation of the carbonaceous matrix during activation. Additionally, the peak at 287.72 eV, which is associated with oxygen-containing functional groups, remains present, albeit potentially with an altered intensity due to changes in the material's surface chemistry.44 The O 1s spectra also provide insights into the effect of activation on the oxygen moieties. While the specific details of the O 1s spectra were not studied, they likely exhibit changes in peak positions or intensities, reflecting alterations in the oxygen functional groups present on the surface of the activated carbon. Additionally, the XPS spectra of the porous carbon sample revealed a peak at 350.37 eV, suggesting a lower fraction of epoxy or ethereal linkages on the surface.45,46 However, upon acid-induced activation, a higher degree of oxidation in the functional moieties was observed, indicating an increase in the presence of oxygen-containing groups. In the XPS spectrum of the non-activated carbon sample, deconvolution of the O 1s peak revealed two distinct components at binding energies of 531.82 and 532.92 eV. Upon activation, these peaks underwent a subtle shift, whereby they were positioned at 532.08 and 532.98 eV, respectively. The peak observed at 531.82 eV in the non-activated carbon can typically be ascribed to oxygen in the hydroxyl (OH) groups. The shift to 532.08 eV in the activated sample suggests a possible increase in the electron density around the oxygen atom, which could result from the removal of acidic functionalities upon heating. Similarly, the peak at 532.92 eV in the non-activated sample, which shifted to 532.98 eV upon activation, corresponded to oxygen atoms in the carbonyl (C
C structures decreased significantly, suggesting a reduction in the content of aromatic or conjugated carbon bonds. Furthermore, this peak shifted to 284.28 eV from its initial position at 284.57 eV, indicating alterations in the electronic structure or the bonding environment of these carbon atoms. Conversely, a larger peak could be observed at 286.53 eV, corresponding to sp3 hybridized carbon atoms. The increase in the last peak suggests an enhancement in aliphatic carbon species, possibly resulting from the breakdown or exfoliation of the carbonaceous matrix during activation. Additionally, the peak at 287.72 eV, which is associated with oxygen-containing functional groups, remains present, albeit potentially with an altered intensity due to changes in the material's surface chemistry.44 The O 1s spectra also provide insights into the effect of activation on the oxygen moieties. While the specific details of the O 1s spectra were not studied, they likely exhibit changes in peak positions or intensities, reflecting alterations in the oxygen functional groups present on the surface of the activated carbon. Additionally, the XPS spectra of the porous carbon sample revealed a peak at 350.37 eV, suggesting a lower fraction of epoxy or ethereal linkages on the surface.45,46 However, upon acid-induced activation, a higher degree of oxidation in the functional moieties was observed, indicating an increase in the presence of oxygen-containing groups. In the XPS spectrum of the non-activated carbon sample, deconvolution of the O 1s peak revealed two distinct components at binding energies of 531.82 and 532.92 eV. Upon activation, these peaks underwent a subtle shift, whereby they were positioned at 532.08 and 532.98 eV, respectively. The peak observed at 531.82 eV in the non-activated carbon can typically be ascribed to oxygen in the hydroxyl (OH) groups. The shift to 532.08 eV in the activated sample suggests a possible increase in the electron density around the oxygen atom, which could result from the removal of acidic functionalities upon heating. Similarly, the peak at 532.92 eV in the non-activated sample, which shifted to 532.98 eV upon activation, corresponded to oxygen atoms in the carbonyl (C![[double bond, length as m-dash]](https://www.rsc.org/images/entities/char_e001.gif) O) groups. Minor changes in the peak position are indicative of changes in the electronic environment upon heating.
O) groups. Minor changes in the peak position are indicative of changes in the electronic environment upon heating.


![[thin space (1/6-em)]](https://www.rsc.org/images/entities/char_2009.gif) 000 cycles to check the stability of the cells shown in Fig. 10(c) and (d). Fig. 10(a) and (b) show the first six cycles of both cells, and the calculated values of specific capacitance, energy density, power density, and coulombic efficiency are presented in Table 7.
000 cycles to check the stability of the cells shown in Fig. 10(c) and (d). Fig. 10(a) and (b) show the first six cycles of both cells, and the calculated values of specific capacitance, energy density, power density, and coulombic efficiency are presented in Table 7.

![[thin space (1/6-em)]](https://www.rsc.org/images/entities/char_2009.gif) 000 cycles of U-C (c) and A-PC (d)
000 cycles of U-C (c) and A-PC (d)


