 Open Access Article
Tweaking the electrocatalytic ability of Cu-MOF by the inclusion of PTA: a selective electrochemical sensor for resorcinol†
Sandra
Jose
a,
Munmun
Ghosh
b and
Anitha
Varghese
 *a
*a
aDepartment of Chemistry, CHRIST (Deemed to Be University), Bengaluru 560029, India. E-mail: anitha.varghese@christuniversity.in
bDepartment of Chemistry, Ashoka University, Haryana 131029, India
First published on 21st March 2024
Abstract
Resorcinol (RL) is a phenolic compound that is extensively utilized in the industrial sector, mostly for skin care applications as an antiseptic and disinfectant. However, this chemical has the potential to be very hazardous to people and the environment due to its pernicious nature in the environment owing to its high degree of toxicity and weak degradation capacity. Finding novel analytical techniques to monitor RL is therefore crucial. A facile and superior electrochemical fabrication route was procured to develop the composite of Cu-BTC-MOF/PTA/CFP for the sensitive detection of resorcinol (RL). The modified Cu-BTC-MOF/PTA/CFP (copper benzene-1,3,5-tricarboxylate–poly-3-thiophene acetic acid) electrode displayed improved electron transport features as well as excellent electrocatalytic performance. The developed electrode was characterized using physicochemical and electrochemical techniques. The enhanced electrochemical activity of the Cu-BTC-MOF/PTA/CFP electrode compared to the individual MOF and polymer electrode was examined using electrochemical characterization, which revealed a 10-fold increase in the current response for Cu-BTC-MOF/PTA/CFP (0.004 A) compared to the bare electrode. The cyclic voltammetric analysis of the Cu-BTC-MOF/PTA/CFP electrode in the presence of 120 nM analyte gave an oxidation peak at 0.62 V and a 5.4-fold increase in the current peak compared to the bare CFP electrode suggesting a higher sensitivity in sensing the analyte. The limit of detection for RL under optimal conditions was calculated to be 8 nM with a broad linear range from 0.025 μM to 350 μM. In addition, the Cu-MOF/PTAA/CFP electrode was scrutinized for its stability, reproducibility, and selectivity. Real sample analysis was carried out to validate the analytical applications.
1. Introduction
Resorcinol (RL), a phenolic substance, is widely utilized in the rubber, plastic, food, pharmaceutical, and dye industries.1 As a result of its keratolytic, antibacterial, and antifungal properties, it can also be used as a disinfectant and an antiseptic for skin care.2 Due to its high toxicity and durability, RL has a large potential for spreading throughout natural ecosystems and is highly resistant to decompose in an ecological system.3,4 The European Union (EU) and the United States Environmental Protection Agency (EPA) have designated RL as a serious environmental toxin given its limited degradability and significant toxic effects on the biological environment. RL is toxicokinetic, carcinogenic, and genotoxic to human health. High levels of RL can cause the blood to become oxygen-depleted, which can result in methemoglobinemia, sleepiness, and even death. Constant RL exposure may harm the nervous system as well as the hepatic and renal systems.5,6 To protect the environment and public health, the RL concentration must be closely monitored. Several analytical techniques, including gas chromatography, high-performance liquid chromatography, capillary electrochromatography, surface plasmon resonance, spectrophotometric, and synchronous fluorescence were used for sensitive and accurate monitoring of these substances.7,8 However, these methods have limitations like difficult operation, high cost, and sample pre-treatment. In contrast, the electrochemical sensing approach is intriguing as it promises sensitive measurements and cost-effectiveness, with no pre-treatment of the sample required, and offers good selectivity and good response.Recent studies have shown that metal–organic frameworks (MOFs) have the potential to be used for electrochemical sensing due to their morphological characteristics and skeletal composition.9 MOFs are sequences of organic and inorganic ligands that are joined by coordination bonds and long-range serial metal ions. The achievement of effective electrochemical transmission of signals is the main goal of MOF sensing research.10,11 When MOFs are used for electrode fabrication, their porous architectures and high surface areas are beneficial to raise the signal response efficiently, and their superior electrocatalytic capabilities make it easier to assess the redox behaviours of the chemicals to be measured. Cu-based MOFs have drawn more interest due to the ease with which they can be made using readily available commercial chemicals. They also feature a very porous volume, an extraordinarily adjustable structure, a precise surface area, and excellent chemical stability.10 Traditionally, the hydrothermal technique is used for developing MOFs. Other alternative techniques have been employed to synthesize MOFs besides hydrothermal synthesis, including microwave-assisted synthesis, the mechanochemical method, the spray-drying approach, and sonochemical synthesis.12–14 In the recent past, the synthesis of MOFs has attracted considerable attention from electrochemical approaches. Electrosynthesis was superior to conventional methods due to its rapid synthesis times, real-time MOF structural change, and direct deposition of MOFs on the required substrates.15 Due to their comparatively high electrical conductivity, highly flexible nature, cheapness and porous construction, conducting polymers (CPs) have been frequently advocated as prospective supporting materials. CPs exhibit an intriguing structure with π conjugated backbones and significant porosity making them a suitable matrix for the deposition of MOFs. The electrical conductivity of CPs was significantly higher than that of those synthesized chemically, making the electropolymerization process preferable to the chemical polymerization of monomers.16
From the literature, electrode substrates like glassy carbon electrodes, screen-printed electrodes, and carbon paste electrodes have been employed for the detection of RL.17–20 Utilizing carbon fiber paper (CFP) as an electrode substrate for the electrochemical sensing of RL is a novel approach. CFP has gained widespread recognition due to its macroporous structure, high conductivity, chemical inertness, low cost, good electrical qualities, mechanical strength, corrosion resistance, and self-standing abilities.21 Composites of MOFs have been employed for the detection of RL, such as reduced graphene oxide,22 β cyclodextrin,23 metal nanoparticles,24,25 and carbon nanotubes.26 Due to the synergistic benefits that the MOF–polymer composite material offers, it is advantageous for electrochemical sensing applications. The exceptionally large surface area of MOFs is well known for offering a significant number of active sites for analyte adsorption. Incorporating MOFs into a polymer matrix can increase selectivity, improve mechanical stability, and reduce interference from other substances.
To the best of our comprehension, this is the first approach that employs a composite electrode made of a MOF–polymer matrix for the electrochemical sensing of RL. Fabrication of a composite of a MOF and conducting polymer helps to overcome the drawbacks of individual materials. Cu-MOFs are renowned for having a large surface area and being porous. Thus, they offer a sizable active surface for resorcinol molecules to adsorb to, enhancing the sensitivity of electrochemical detection. The electrical conductivity of the composite material may be enhanced by the addition of PTA (poly(3-thiopheneacetic acid)). For effective electron transfer during the electrochemical sensing process, this conductivity is advantageous. The polymer improves the stability of the developed electrode. The MOF–polymer composite electrode in this study was developed using a simple electrochemical method. The prepared Cu-BTC-MOF/PTA/CFP electrode is cost-effective, environmentally benign, sensitive, and highly selective toward the detection of RL. The hybrid electrode revealed low detection limits for the analyte and reported good recoveries in the examination of real samples.
2. Experimental section
2.1. Reagents and materials
Chemicals of analytical grade were acquired and used in this study. Resorcinol (RL) was obtained from NICE Chemicals, India. Copper nitrate trihydrate (Cu(NO3)2·3H2O), triethylamine hydrochloride (TEAH), and trimesic acid (BTC) were products of Sigma Aldrich, India. N,N-Dimethylformamide (DMF) was purchased from Spectrochem Pvt. Ltd, India. TCI provided the 3-thiophene acetic acid (3-TA). Di and mono potassium phosphates (K2HPO4 and KH2PO4) were obtained from SD Fine Chemicals Pvt Ltd. para-toluene sulfonic acid (PTSA) was bought from Sigma Aldrich, India. Phosphate buffer solution (PBS) was made by combining monopotassium hydrogen sulfate (KH2PO4) and dipotassium hydrogen phosphate (K2HPO4), and was used for electrochemical experiments. The composite electrode was fabricated via electrodeposition of the polymer (PTA) and Cu-BTC-MOF over the CFP electrode. Toray CFP 030-TGP-H-030 was bought and cut into 2 cm by 0.7 cm lengths and widths. The resulting CFP substrate was attached to the copper wire using a conducting ink, and then it was covered with 1 cm of polytetrafluoroethylene tape to provide a 0.7 cm2 geometrical region that could be utilized as the bare electrode.2.2. Apparatus and instruments
A CHI608E electrochemical workstation (CH Instruments, Inc., USA) was used for the cyclic voltammetric studies of the fabricated electrodes, and Autolab Metrohm was used for differential pulse voltammetric analysis. Fourier transform infrared (FTIR) spectra were collected on the Thermo Nicolet, Avatar 370. A JSM-5600LV microscope (JEOL, Ltd, Japan) was used to analyze the electrode surface using field emission scanning electron microscopy (FESEM). HRTEM analysis was carried out using a JEOL (JEM F200). A K-Alpha XPS spectrometer (Thermo Fisher Scientific) was used to perform X-ray photoelectron spectroscopy (XPS). Powder X-ray diffraction (XRD) patterns were produced using a Rigaku Smart Lab X-ray diffractometer (Japan) and Cu K radiation of 1.5406. To carry out the electrochemical investigations, a standard three-electrode system was used using platinum foil as the counter electrode, a saturated calomel electrode (SCE) as the reference electrode, and a Cu-BTC-MOF/PTA/CFP electrode as the working electrode.2.3. Sensor fabrication
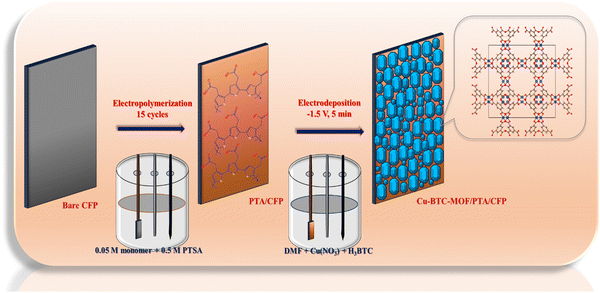
Fabrication of the sensor was achieved in a two-step electrochemical deposition method. In the preliminary step, a polymer layer of 3-TA was electrodeposited onto the CFP substrate material. A cyclic voltammetric approach was employed for the electropolymerization of the monomer in a three-electrode system. In the final step, the polymer-coated electrode (PTA/CFP) was subjected to electrodeposition of Cu-BTC-MOF via the chronoamperometric technique by supplying a constant potential for a fixed interval of time. The finally modified Cu-BTC-MOF/PTA/CFP was employed for the determination of RL in an aqueous medium. The prepared electrodes were dried overnight and stored in a desiccator at room temperature. The schematic illustration of the electrode fabrication is given in Scheme 1.2.4. Electropolymerization of 3-TA
Electrochemical polymerization of 3-TA was achieved as per the methodology that has been previously published in our research.27 Here, cyclic voltammetric cycles were performed in a three-electrode system with a bare CFP electrode serving as the working electrode, while the electrolyte solution comprises a mixture of 0.05 M 3-TA and 0.5 M PTSA. A 0.05 V s−1 scan speed was used to sweep the potential between −0.4 V and 1.7 V. At 1.54 V, an oxidation potential was observed, which suggests that the monomer had been converted to a radical. The peak current intensity increased as the number of cyclic voltammetric cycles increased due to the polymer layer deposition. The number of cycles plays a crucial role in the thickness and thus the conductivity of the electrode surface. To increase the conductivity and efficiency of the PTA/CFP electrode to transmit electrons, the cyclic voltammetric cycles were optimised to be 15. An additional increase in cycles caused the polymer to create a passive layer, which reduced its conductivity. The prepared PTA/CFP electrodes were dried, cleaned with distilled water, and kept in a desiccator at room temperature.2.5. Cathodic electrodeposition of the Cu-BTC-MOF
In the process of cathodic electrosynthesis, a solution comprising a metal precursor, an organic ligand, and a pro-base in an adequate electrolyte at a suitable voltage reacts to create a MOF on the cathodic substrate that is submerged in the solution. In this work, cathodic electrosynthesis was chosen for the electrodeposition of the MOF owing to the simplicity of the technique and the requirement of minimal chemicals. Herein, two solutions were prepared by separately mixing 0.2 g of Cu(NO3)2·3H2O and BTC in 10 ml DMF. The individually prepared solutions were mixed and 0.05 g TEAH was added. The resulting solution was sonicated for 10 min, and the solution was used for the cathodic electrodeposition. The Cu(NO3)2·3H2O acts as the metal ion source and BTC as the ligand.The electropolymerized PTA/CFP electrode was dipped into this solution, and a continuous cathodic potential of −1.5 V was applied for 5 minutes to develop the finally modified Cu-BTC-MOF/PTA/CFP. The polymer layer on the CFP electrode serves as a template for the growth of the MOF crystals. The Cu-BTC-MOF/CFP electrode was prepared similarly by dipping bare CFP into the solution mixture. After an overnight drying, the produced electrodes were kept at room temperature in a desiccator. Cu-MOF electrodeposition has been optimized in terms of applied voltage, electrodeposition time, linker-to-metal salt ratio, and concentration. X-ray diffraction (XRD) analysis was carried out at each stage of optimization.
3. Results and discussion
3.1. Morphological characterization of the modified electrodes
The X-ray diffractogram illustrated in Fig. 1 corresponds to the bare CFP, PTA/CFP, Cu-BTC-MOF/CFP, and Cu-BTC-MOF/PTA/CFP. The peaks at 24.2° and 54.1° correspond to the peak of the CFP (Fig. 1a). Fig. 1b suggests that the polymer coating over CFP is an amorphous layer indicated by the broad peak around 11.6°.27 The XRD pattern of the synthesized Cu-BTC-MOF is represented in Fig. 1c. The sharp peaks of Cu-BTC-MOF are in good agreement with the literature.28,29 The 2θ value at 11.82° corresponding to the (222) plane refers to the high level of crystallinity of the developed MOF. The finally modified Cu-BTC-MOF/PTA/CFP electrode (Fig. 1d) reflected similar peaks of the prepared MOF with a lower intensity. This could be attributed to the polymer layer being deposited over the CFP substrate. This suggested that the deposition of the polymer layer doesn’t interrupt the crystal structure of the Cu-BTC-MOF.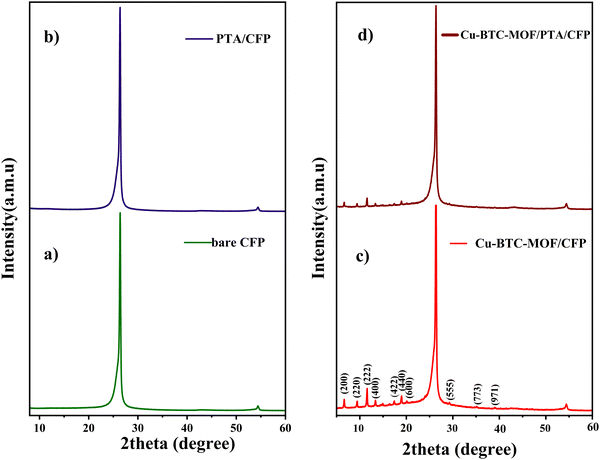 | ||
| Fig. 1 X-Ray diffractogram of (a) bare CFP, (b) PTA/CFP, (c) Cu-BTC-MOF/CFP, and (d) Cu-BTC-MOF/PTA/CFP. | ||
To comprehend the functional groups and examine the molecular structure of the electrode material, FTIR spectroscopic analysis was carried out.30 The FTIR spectrum of Cu-BTC-MOF/CFP is given in Fig. S1 (ESI†). Significant absorption bands at 1641 cm−1, 1334 cm−1 and 1428 cm−1 are a result of the symmetric and asymmetric vibrations of the carboxylate group found in the Cu-BTC-MOF. The Cu–O bond is represented by the band at 487 cm−1, while the absorption band at 729 cm−1 represents the aromatic ring's bending vibration.31 Small peaks between 660 cm−1 and 760 cm−1, and 800 cm−1 and 1100 cm−1 respectively, are indicative of the stretching vibrations of the O–C![[double bond, length as m-dash]](https://www.rsc.org/images/entities/char_e001.gif) O and C–O bonds. The broad band at 3428 cm−1 is attributed to the adsorbed water molecule and OH group in the MOF.32,33
O and C–O bonds. The broad band at 3428 cm−1 is attributed to the adsorbed water molecule and OH group in the MOF.32,33
The surface electronic states and the chemical composition of the Cu-BTC-MOF/PTA/CFP electrode are analyzed using XPS. The survey spectrum of the finally modified electrode given in Fig. 2a reveals the presence of carbon, oxygen, copper, and sulfur in the electrode composition. The characteristic peaks of Cu 2p3/2 and Cu 2p1/2 are attributed to two sharp peaks with binding energies of 933.58 eV and 953.38 eV in the high-resolution Cu 2p core spectrum (Fig. 2b). The satellite peaks at binding energies of 943.04 eV and 962.93 eV demonstrated the divalent nature of the copper atoms on the electrode.34 This result indicates that there is no crystalline Cu2O in Cu-BTC-MOF. The prominent peak in the C 1s XPS spectra displayed in Fig. 2c, at 284.78 eV is presumed to be C–C and C![[double bond, length as m-dash]](https://www.rsc.org/images/entities/char_e001.gif) C bonds in the aromatic rings of the organic ligands (BTC) and the polymeric chain. The other three peaks in the deconvoluted spectra at higher binding energies 286.08 eV, 288.58 eV, and 291.38 eV represent the oxygenated functional groups C–OH, C
C bonds in the aromatic rings of the organic ligands (BTC) and the polymeric chain. The other three peaks in the deconvoluted spectra at higher binding energies 286.08 eV, 288.58 eV, and 291.38 eV represent the oxygenated functional groups C–OH, C![[double bond, length as m-dash]](https://www.rsc.org/images/entities/char_e001.gif) O, and O
O, and O![[double bond, length as m-dash]](https://www.rsc.org/images/entities/char_e001.gif) C–OH, respectively.35 Two peaks in the high-resolution O 1s spectra, with binding energies of 531.58 eV and 532.98 eV, represent the oxygen bonding in the crystalline network. (Fig. 2d). The core level S 2p spectrum depicts the deconvoluted peaks at 169.23 eV and 167.84 eV, which indicates S2+,4+ oxidation peaks present in the polymer layer.36
C–OH, respectively.35 Two peaks in the high-resolution O 1s spectra, with binding energies of 531.58 eV and 532.98 eV, represent the oxygen bonding in the crystalline network. (Fig. 2d). The core level S 2p spectrum depicts the deconvoluted peaks at 169.23 eV and 167.84 eV, which indicates S2+,4+ oxidation peaks present in the polymer layer.36
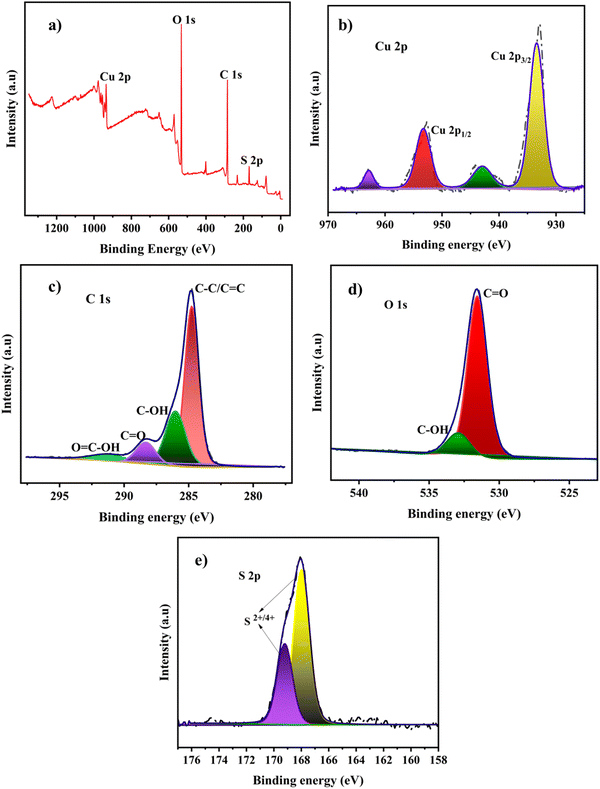 | ||
| Fig. 2 (a) XPS survey spectrum of the Cu-BTC-MOF/PTA/CFP electrode, and core level spectra of (b) Cu 2p, (c) C 1s, (d) O 1s and (e) S 2p. | ||
The surface morphological characteristics of the developed electrodes were evaluated with the help of FESEM, HRTEM, and an optical profilometer. The FESEM images of the different fabricated electrodes are depicted in Fig. 3. The PTA layer on CFP was found to have a rod-shaped pattern on its surface (Fig. 3a). The MOF coating on the CFP electrode displayed the 3-D structure of the developed MOF crystals (Fig. 3b). The Cu-BTC-MOF/CFP revealed an octahedral shape with pointed edges. The finally modified Cu-BTC-MOF over the polymer layer depicted a similar octahedral morphology of Cu-BTC-MOF/CFP (Fig. 3c), this suggested that the PTA layer does not interrupt the MOF formation. Fig. 3d portrays the homogenous deposition of MOF crystals on the finally modified electrode surface. Furthermore, the elemental mapping analysis of the composite electrode in Fig. 3e represented the presence of evenly distributed C, O, Cu, and S. The energy-dispersive X-ray spectroscopy (EDS) explains the elemental integrity of the Cu-BTC-MOF/PTA/CFP (Fig. S2a, ESI†), the presence of C, O, Cu, and S accounted for the polymer and MOF deposited. The high-resolution transmission electron microscopy (HRTEM) images of Cu-BTC-MOF (Fig. S2b, ESI†) are consistent with the FESEM images suggesting the octahedral shape of the MOF crystals. From Fig. S2c (ESI†), the d-spacing was calculated to be 0.227 nm. The selected area electron diffraction (SAED) pattern shown in Fig. S2d (ESI†) reveals the diffraction spots and concentric rings, suggesting the good crystalline nature of the electro-synthesised Cu-BTC-MOF. This observation is well-concordant with the sharp peaks of XRD.
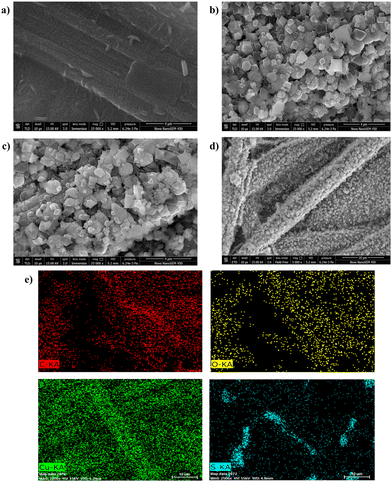 | ||
| Fig. 3 FESEM micrographs of (a) PTA/CFP, (b) Cu-BTC-MOF/CFP, and (c) and (d) Cu-BTC-MOF/PTA/CFP. (e) Elemental mapping analysis of Cu-BTC-MOF/PTA/CFP. | ||
The zeta 20 with 50× magnification optical profilometer was used for surface topography analysis, and the 3D images are shown in Fig. S3 (ESI†). The surface roughness (Sa) values and the electrocatalytic performance of the designed electrodes are closely aligned. The literature revealed that the bare CFP electrode's Sa value was 5.06 μm.27 The final modified Cu-BTC-MOF/PTA/CFP had Sa values that were 3 times higher than that of the bare CFP electrode. A Sa value of 12.02 μm was provided by the polymer coating on the CFP electrode. The enhancement in the Sa value for the composite electrode (14.68 μm) is thus due to the incorporation of the Cu-MOF. The surface skewness (Ssk) parameter provides information on the troughs that exist on the electrode surface. A larger negative value of Ssk for the Cu-BTC-MOF/PTA/CFP of −3.2 than PTA/CFP (−2.1) implied the occurrence of more troughs on the finally modified electrode surface. As a result, the developed electrode depicts an uneven surface with sufficient roughness to help with the analyte's electrochemical sensing.
3.2. Electrochemical characterization of the various electrodes
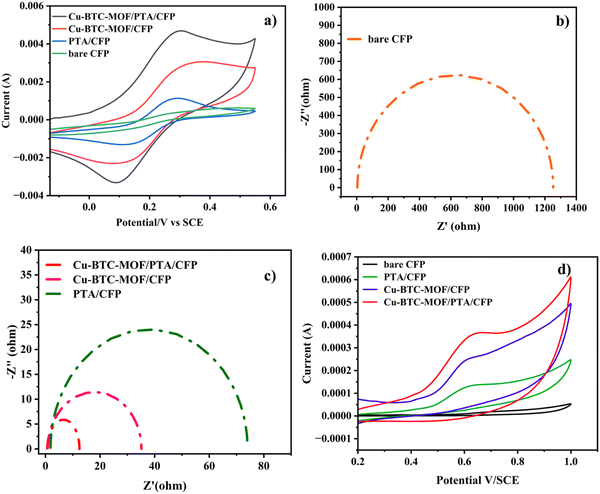
The electrochemical characteristics of the different electrodes, bare CFP, PTA/CFP, Cu-BTC-MOF/CFP, and Cu-BTC-MOF/PTA/CFP, were determined using cyclic voltammetry with the aid of the electrochemical redox probe Fe (CN)63−/4− and electrochemical impedance spectroscopy (EIS).37,38 By measuring the peak current intensities, the electrochemical activity of the various modified electrodes in 5 mM K3[Fe(CN)6] and 0.1 M KCl was evaluated. Fig. 4a represents clearly defined redox peaks of the [Fe(CN)6]3−/4− probe for the different electrodes. When the PTA layer was present over the CFP electrode, the peak current intensity was increased by a factor of 2.5, exceeding the measured value of 4.20 × 10⁻⁴ A for the CFP electrode. This points out the ease of the electron transfer ability of the CP. The current response of 0.002 A from the Cu-BTC-MOF/CFP indicates the electroactive properties of the Cu2+ in the MOF. A 10-fold increase in the current response for the Cu-BTC-MOF/PTA/CFP (0.004 A) as compared to the bare CFP electrode was ascribed to the high electrocatalytic activity of the modified composite electrode than the individual MOF and polymer electrodes. The higher catalytic activity of Cu-BTC-MOF/PTA/CFP could be attributed to the inclusion of the PTA layer in the electrode. Notably, the reduction peak potential shifted positively for the finally modified composite electrode, yielding an ΔEp value of 0.2 V. The low ΔEp value of the Cu-BTC-MOF/PTA/CFP compared to bare CFP (ΔEp = 0.35 V) propounds the excellent electrocatalytic ability due to the synergic effect of Cu-BTC MOF and the polymer, which in turn boosted the electron transfer rate of the MOF–polymer composite electrode. Using the redox probe, the electrochemical surface area (ECSA) of the unmodified and modified electrodes was measured using the cyclic voltammetry technique. In accordance with the Randles–Sevcik equation, (eqn (1))39 | (1) |
Electrochemical impedance spectroscopy (EIS) is used to identify the interface properties by analyzing the impedance changes on the electrode surface. In an EIS measurement, an AC potential is applied to the electrochemical cell and the corresponding current response is interpreted by fitting in a Randle's equivalent electrical circuit. Fig. 4b and c represent the Nyquist plot that has imaginary (−Z′′) and real (Z′) axes of the bare and modified electrodes in 0.1 M KCl and 5 mM K3[Fe(CN)6]. Herein, the semicircular portion in the high-frequency zone represents the electron transfer resistance (Rct). A high Rct value (1253 Ω) of the bare CFP electrode exhibits its poor conducting ability. The low Rct value of the Cu-BTC-MOF/PTA/CFP electrode 12.46 Ω, accounts for the good conductivity with minimum interface resistance between the redox probe and the modified electrode. This reveals the successful fabrication of the MOF–polymer electrode. The surface modification of the electrodes was assessed by the heterogeneous rate constant (K0) based on EIS as per eqn (2),40
 | (2) |
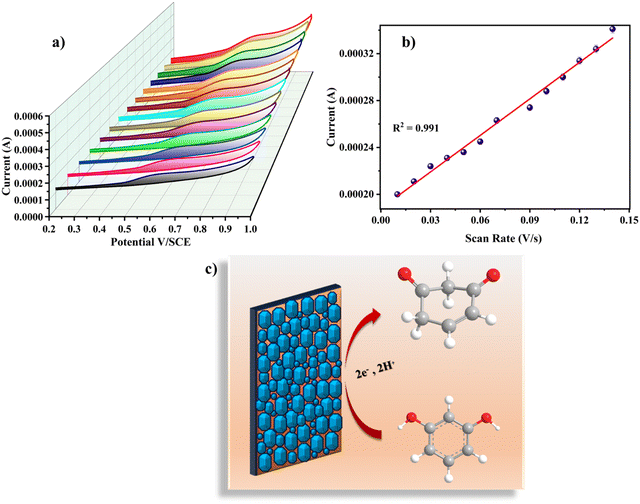
The electrocatalytic analysis of the modified electrodes was performed in 0.2 M PBS (pH – 7) using the cyclic voltammetric technique.41,42 At a scan rate of 0.05 V s−1, cyclic voltammograms were recorded in the potential range of 0.2 V to 1.0 V. The cyclic voltammograms in the presence of 120 nM RL illustrated in Fig. 4d give an irreversible oxidation reaction for RL on all electrode surfaces; this is due to its meta structure meaning a stable quinone could not be generated. Bare CFP electrodes reported a very low current response with no characteristic peak for the analyte. On the surface of the PTA/CFP electrode, the current response elevated, and a distinct peak of the oxidation of RL was noticed. The Cu-BTC-MOF/CFP electrode depicted a further enhancement in the oxidative current intensity. The elevated peak currents could be due to the larger pore size offered by the MOF favorable for the adsorption of the target molecule. The finally modified composite electrode demonstrated the best catalytic behavior due to the synergic interaction between the polymer and MOF with a well-defined peak and a high current intensity. The peak current intensity increased by 5.4 times from the bare CFP to Cu-BTC-MOF/PTA/CFP electrode. The excellent catalytic efficiency of the Cu-BTC-MOF/PTA/CFP (Ip = 3.58 × 10⁻⁴) compared to Cu-BTC-MOF/CFP (Ip = 2.44 × 10⁻⁴) electrode is ascribed to the incorporation of the polymer layer that enhanced the electronic conducting pathways in the composite. The electrochemical oxidation of RL is influenced by the Cu3+/Cu2+ redox couple of the finally modified electrode, Cu2+ is converted into Cu3+ during the electrochemical reaction, RL gets oxidized into the corresponding derivative 1,3-benzoquinone and Cu3+ gets reduced back.43 Thus, the MOF–polymer electrode possesses an optimal analytical response towards the target molecule.
3.3. Optimization of the electrochemical parameters
The electrochemical behavior of the Cu-BTC-MOF/PTA/CFP electrode for the determination of RL was performed in various electrolyte mediums, such as 0.1 M acetate buffer (pH 5), 0.1 M Britton–Robinson buffer (pH 9), 0.1 M carbonate buffer (pH 9), 0.2 M PBS (pH 7), and 0.1 M PBS (pH 7). From the cyclic voltammogram illustrated in Fig. S4 (ESI†), the best catalytic response is displayed in 0.2 M PBS (pH 7). In the acetate buffer, a very low current response for the analyte with a significant positive shift was observed. There was no discernible peak for RL in the Britton Robinson buffer and carbonate buffer. In comparison to 0.1 M PBS, 0.2 M PBS with pH 7 gave a better current response as well as peak distinction. Thus, 0.2 M PBS (pH 7) was employed for the experimental analysis for the electrochemical detection of the analyte.The catalytic performance of the electrochemical process is significantly impacted by the pH level of the buffer solution. To evaluate the influence of pH, cyclic voltammograms of Cu-BTC-MOF/PTA/CFP electrodes were studied in 0.2 M PBS ranging from pH 4 to 8 with a sweep speed of 0.05 V s−1. According to Fig. 5a, the peak potential changed negatively when the pH rose from 4 to 8. Fig. 5b illustrates that the pH varies linearly with the peak potential suggesting that protons directly participate in the electrochemical reactions. Eqn (3), gives the linear regression between the pH value and the oxidation peak potential for RL as;
| Epa (V) = −0.055(pH) + 0.93; R2 = 0.996 | (3) |
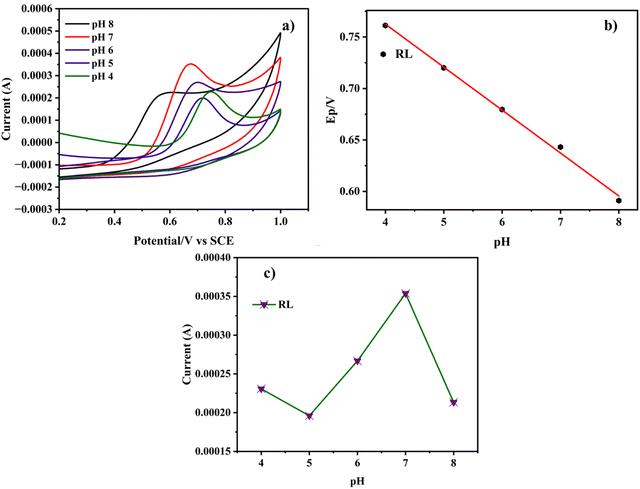 | ||
| Fig. 5 (a) CV curve of the Cu-BTC-MOF/PTA/CFP electrode in 0.2 M PBS with different pH (4–8) in 120 nM RL. (b) Plot of Epavs. pH and (c) plot of I vs. pH. | ||
Various scan rates (0.01 V s−1, 0.02 V s−1, 0.03 V s−1, 0.04 V s−1, 0.05 V s−1, 0.06 V s−1, 0.07 V s−1, 0.08 V s−1, 0.09 V s−1, 0.10 V s−1, 0.11 V s−1, 0.12 V s−1, 0.13 V s−1, and 0.14 V s−1) were used to examine the impact of scan rate on the electrochemical analysis for RL determination. Fig. 6a shows the cyclic voltammetric curves of 120 nM RL on Cu-BTC-MOF/PTA/CFP electrodes with different scanning speeds in 0.2 M PBS (pH 7). The current response steadily increased when the sweep rate was increased, and the oxidation peak potential of RL changed positively, indicating that the process was irreversible. The calibration plot between scan rate and peak current for RL (Fig. 6b) was observed to be linear with eqn (4) as;
| Ipa = 1.04 × 10⁻³ν + 1.87 × 10⁻⁴; R2 = 0.991 | (4) |
 | (5) |
3.4. Quantitative analysis of RL
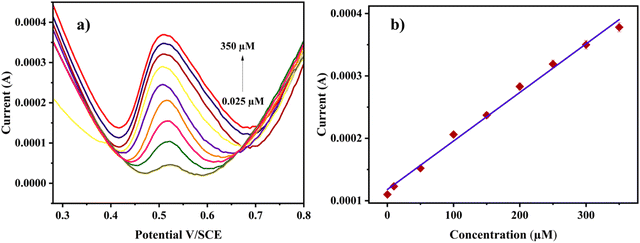
To investigate the linear dynamic range and limit of detection for the electrochemical sensing of RL, the differential pulse voltammetric (DPV) technique was employed. The DPV responses were recorded by increasing the analyte concentration under optimal experimental conditions. The DPV graph shows the sharp peaks of RL on the Cu-BTC-MOF/PTA/CFP electrode in response to varying concentrations of the analyte in 0.2 M PBS (pH 7) at a sweep speed of 0.05 V s−1. From Fig. 7a, as the concentration elevated the peak current intensity raised linearly. The calibration plot shows a linear correlation between the analyte concentration and the oxidative current intensity (Fig. 7b) with a broad concentration range from 0.025–350 μM for RL. Eqn (6), from the calibration curve, was observed to be:| Ip (A) = 7.78 × 10⁻⁷[RL] + 1.18 × 10⁻⁴; R2 = 0.993 | (6) |
| Modified electrode | pH | Method | Linear range (μM) | LOD (μM) | Ref. |
|---|---|---|---|---|---|
| CoMOF/rGO paper | PBS 7 | Amperometry | 0.1–800 | 0.019 | 24 |
| CPE/TiO2 NPs | B.R. 10 | Linear sweep voltammetry | 10–1000 | 0.001 | 46 |
| Cd–GSH-GCE | PBS 7.4 | Chronoamperometry | 0.3 | 47 | |
| TFPB-BD-COF/PtNPs/NH2-MWCNT/GCE | PBS 7 | DPV | 4–360 | 0.26 | 48 |
| 3D printed CB/PLA | PBS 7.2 | Square wave voltammetry | 5–400 | 3.4 | 6 |
| M/MWCNT/MCPE | PBS 7 | DPV | 0.5–10 | 0.022 | 49 |
| Fe–CuMOF/rGO | PBS 7 | Amperometry | 0.1–720 | 0.02 | 50 |
| Cu-BTC-MOF/PTA/CFP | PBS 7 | DPV | 0.025–350 | 0.008 | Present work |
3.5. Stability, reproducibility and selectivity
The stability of Cu-BTC-MOF/PTA/CFP was examined by measuring the cyclic voltammetric curves for 120 nM RL. The electrode was noticed to be stable retaining 96.3% of the initial current values for RL, after 3 weeks of storage at ambient temperature (Fig. S5a, ESI†). The repeatability of the Cu-BTC-MOF/PTA/CFP was investigated by performing five separate measurements in 0.2 M PBS (7) in the presence of 120 nM RL (Fig. S5b, ESI†). The relative standard deviation (RSD), which was found to be 1.2%, demonstrated the high repeatability of the electrode. We also looked at the reproducibility of the fabricated composite electrode. Five Cu-BTC-MOF/PTA/CFP electrodes were prepared by applying the same procedure and their current responses were recorded in 120 nM RL. From Fig. S5c (ESI†), the peak currents showed an RSD value of 1.24%, indicating the ability to accurately reproduce the analytical efficacy of the MOF–polymer composite.The selectivity of the fabricated sensor towards the interferants was explored by the DPV method. The current response of Cu-BTC-MOF/PTA/CFP was measured in 0.2 M PBS (pH 7) containing 120 nM RL in the presence of various interferants. A 10-fold excess of bisphenol A, metol, p-nonylphenol, p-aminophenol, picric acid, glucose, glycine, and ascorbic acid did not cause a discernible alteration in the electrochemical current response of RL. Structurally similar molecules of catechol and hydroquinone did not interfere with the current response of RL even in the presence of a 100-fold excess of the interferant as evidenced by the fact that the current intensity of RL maintained 97.5% of the original current intensity. The findings tabulated in Table 2 demonstrated that the interference of these environmentally significant molecules with the analytes' detection was negligible. These results suggest that the composite electrode prepared exhibited good RL selectivity.
| S. no. | Interferants | Additions | Current density ratiosa |
|---|---|---|---|
| a The ratio of the current densities of RL prior to and following the addition of interference-causing species. | |||
| 1 | Metol | 10-fold | 0.99 |
| 2 | p-Nonylphenol | 10-fold | 1.01 |
| 3 | p-Aminophenol | 10-fold | 1.00 |
| 4 | Picric acid | 10-fold | 1.00 |
| 5 | Glucose | 10-fold | 0.98 |
| 6 | Glycine | 10-fold | 0.99 |
| 7 | Ascorbic acid | 10-fold | 0.98 |
| 8 | Bisphenol A | 10-fold | 0.99 |
| 9 | Catechol | 10-fold | 0.97 |
| 10 | Hydroquinone | 10-fold | 0.97 |
3.6. Analytical application
Real sample analysis of the fabricated MOF–polymer composite electrode was analysed using the DPV approach in a tap water sample. A standard addition procedure was used to analyse the samples. During the process, three concentrations of the analytes 2 μM, 5 μM, and 10 μM were spiked into the samples of tap water collected. Table 3 presents the analytical findings. The data provided evidence for the efficiency of the Cu-BTC-MOF/PTA/CFP electrode in the determination of RL with good recovery in the tap water samples. The RSDs for three consecutive measurements were found to be less than 2%. Thus, the developed electrode proved the analytical reliability in real samples.| Tap water | Analyte | Added (μM) | Found (μM) | RSD (%) | Recovery (%) |
|---|---|---|---|---|---|
| Sample 1 | RL | 2 | 1.91 | 1.12 | 95.5 |
| Sample 2 | 5 | 5.21 | 1.44 | 104.2 | |
| Sample 3 | 10 | 9.98 | 1.67 | 99.8 |
4. Conclusions
A novel MOF–PTA composite was prepared with an electrochemical synthesis route, as an electrochemical sensing platform for the determination of RL in an aqueous system. The determination of RL in a binary mixture was accomplished using cyclic voltammetry and DPV. The Cu-BTC-MOF/PTA/CFP electrode, in particular, has shown significantly better electrochemical performance due to a variety of appealing properties, including exceptional catalytic activity, porosity, high conductivity, and the interaction between the polymer and the MOF. With a low detection limit of 8 nM and a wide linear concentration range of 0.025–350 μM, the sensor based on the MOF–PTA composite performed efficiently. Good reproducibility and stability indicate that the hybrid material could be utilized as a viable electrochemical sensor for the targeted detection of RL. The features of MOFs and CPs are complimentary; thus, their composite material exhibits high electrochemical performance. MOFs offer electrochemical active sites, while CPs increase the conductivity of the composite materials. This study offered an effective method for preparing electrochemical sensors based on MOFs and paved the way for MOF–polymer composites to be explored for electrochemical sensing applications.Author contributions
Sandra Jose: conceptualization, methodology, data curation, writing-original draft, review & editing; Bharath M.: investigation, review & editing; Munmun Ghosh: investigation, review & editing; Anitha Varghese: investigation, review & editing, supervision.Conflicts of interest
No conflicts of interest are disclosed by the authors.Acknowledgements
The authors acknowledge the assistance from the Department of Chemistry, Ashoka University, Haryana 131029, India.References
- T. Iftikhar, M. Asif, A. Aziz, G. Ashraf, S. Jun, G. Li and H. Liu, Trends Environ. Anal. Chem., 2021, 31, e00138 CrossRef CAS.
- K. Ngamchuea, B. Tharat, P. Hirunsit and S. Suthirakun, RSC Adv., 2020, 10, 28454–28463 RSC.
- V. Gosu, A. Dhakar, P. Sikarwar, U. K. A. Kumar, V. Subbaramaiah and T. C. Zhang, J. Environ. Manage., 2018, 223, 825–833 CrossRef CAS PubMed.
- M. Amare and M. Begashaw, Microchem. J., 2019, 146, 900–905 CrossRef CAS.
- M. Shahinozzaman, T. Ishii, M. A. Halim, M. A. Hossain, M. T. Islam and S. Tawata, Zeitschrift fur Naturforsch. - Sect. C J. Biosci., 2019, 74, 303–311 CrossRef CAS PubMed.
- J. Fabri, L. R. G. Silva, J. S. Stefano, J. F. S. Pereira, D. R. Cocco, R. A. A. Muñoz and D. P. Rocha, Microchem. J., 2023, 191, 108810 CrossRef CAS.
- H. Yang, J. Zha, P. Zhang, Y. Qin, T. Chen and F. Ye, Sens. Actuators, B, 2017, 247, 469–478 CrossRef CAS.
- W. Ren, Y. Zhang, W. Y. Liang, X. P. Yang, W. D. Jiang, X. H. Liu and W. Zhang, Sens. Actuators, B, 2021, 330, 129390 CrossRef CAS.
- N. Kajal, V. Singh, R. Gupta and S. Gautam, Environ. Res., 2022, 204, 112320 CrossRef CAS PubMed.
- J. Li, J. Xia, F. Zhang, Z. Wang and Q. Liu, Talanta, 2018, 181, 80–86 CrossRef CAS PubMed.
- X. Yang, S. Wu, P. Wang and L. Yang, J. Solid State Chem., 2018, 258, 220–224 CrossRef CAS.
- W. J. Son, J. Kim, J. Kim and W. S. Ahn, Chem. Commun., 2008, 6336–6338 RSC.
- Z. Ni and R. I. Masel, J. Am. Chem. Soc., 2006, 128, 12394–12395 CrossRef CAS PubMed.
- M. Klimakow, P. Klobes, A. F. Thünemann, K. Rademann and F. Emmerling, Chem. Mater., 2010, 22, 5216–5221 CrossRef CAS.
- A. Ghoorchian, A. Afkhami, T. Madrakian and M. Ahmadi, Met. Fram. Biomed. Appl., 2020, 177–195 Search PubMed.
- A. U. Agobi, H. Louis, T. O. Magu and P. M. Dass, J. Chem. Rev., 2019, 1, 19–34 CrossRef.
- P. Alagarsamy, G. N. Krishnan, S. M. Chen, T. Kokulnathan, T. W. Chen, N. Raja, X. Liu, I. S. Hong and V. Selvam, Int. J. Electrochem. Sci., 2017, 12, 6842–6852 CrossRef CAS.
- J. G. Manjunatha, Open Chem. Eng. J., 2020, 14, 52–62 CrossRef CAS.
- G. Manasa, A. K. Bhakta, Z. Mekhalif and R. J. Mascarenhas, Electroanalysis, 2019, 31, 1363–1372 CrossRef CAS.
- J. G. Manjunatha, Asian J. Pharm. Clin. Res., 2017, 10, 295 CAS.
- S. Jose, R. Rajeev, D. A. Thadathil, A. Varghese and G. Hegde, J. Sci. Adv. Mater. Dev., 2022, 7, 100460 CAS.
- Z. Ye, Q. Wang, J. Qiao, Y. Xu and G. Li, Analyst, 2019, 144, 2120–2129 RSC.
- S. Yang, S. Wu, J. Liu, H. Fa, M. Yang and C. Hou, IEEE Sens. J., 2022, 22, 2993–3000 CAS.
- E. Topçu, Mater. Res. Bull., 2020, 121, 110629 CrossRef.
- M. H. Mashhadizadeh, S. M. Kalantarian and A. Azhdeh, Electroanalysis, 2021, 33, 160–169 CrossRef CAS.
- T. Zhang, H. Guo, M. Yang, L. Sun, J. Zhang, M. Wang, F. Yang, N. Wu and W. Yang, Microchem. J., 2022, 175, 107139 CrossRef CAS.
- S. Jose, A. George, A. R. Cherian and A. Varghese, Surf. Interfaces, 2022, 35, 102416 CrossRef CAS.
- T. Noor, M. Ammad, N. Zaman, N. Iqbal, L. Yaqoob and H. Nasir, Catal. Lett., 2019, 149, 3312–3327 CrossRef CAS.
- Y. Cao, L. Wang, C. Wang, X. Hu, Y. Liu and G. Wang, Electrochim. Acta, 2019, 317, 341–347 CrossRef CAS.
- J. Li, G. Guo, F. Duan, C. Xu, C. Zhang, Y. Wang, J. Yeob Lee, J.-H. Choi, R. Nivetha, A. Sajeev, A. Mary Paul, K. Gothandapani, S. Gnanasekar, P. Bhardwaj, G. Jacob, R. Sellappan, V. Raghavan, K. N. Chandar, S. Pitchaimuthu, S. Kwan Jeong and A. Nirmala Grace, Mater. Res. Express, 2020, 7, 114001 CrossRef.
- Y. Xie, Y. Song, Y. Zhang, L. Xu, L. Miao, C. Peng and L. Wang, J. Alloys Compd., 2018, 757, 105–111 CrossRef CAS.
- M.-H. Karimi-Harandi, M. Shabani-Nooshabadi and R. Darabi, J. Electrochem. Soc., 2021, 168, 097507 CrossRef CAS.
- M. B. Nguyen, V. T. Hong Nhung, V. T. Thu, D. T. Ngoc Nga, T. N. Pham Truong, H. T. Giang, P. T. Hai Yen, P. H. Phong, T. A. Vu and V. T. Thu Ha, RSC Adv., 2020, 10, 42212–42220 RSC.
- P. Gao, X. Y. Sun, B. Liu, H. T. Lian, X. Q. Liu and J. S. Shen, J. Mater. Chem. C, 2018, 6, 8105–8114 RSC.
- M. B. Nguyen, V. T. Hong Nhung, V. T. Thu, D. T. Ngoc Nga, T. N. Pham Truong, H. T. Giang, P. T. Hai Yen, P. H. Phong, T. A. Vu and V. T. Thu Ha, RSC Adv., 2020, 10, 42212–42220 RSC.
- D. A. Thadathil, A. Varghese, C. V. S. Ahamed, K. A. Krishnakumar, S. S. Varma, R. S. Lankalapalli and K. V. Radhakrishnan, Mol. Catal., 2022, 524, 112314 CrossRef CAS.
- S. M. Ghoreishi, M. Behpour, A. Khoobi and S. Masoum, Arab. J. Chem., 2017, 10, S3156–S3166 CrossRef CAS.
- A. Khoobi, A. M. Attaran, M. Yousofi and M. Enhessari, J. Nanostruct. Chem., 2019, 9, 29–37 CrossRef CAS.
- R. M. Rodrigues, D. A. Thadathil and A. Varghese, Mol. Catal., 2023, 545, 113242 CrossRef CAS.
- S. Jahani, A. Sedighi, A. Toolabi and M. M. Foroughi, Electrochim. Acta, 2022, 416, 140261 CrossRef CAS.
- S. M. Ghoreishi, F. Z. Kashani, A. Khoobi and M. Enhessari, J. Mol. Liq., 2015, 211, 970–980 CrossRef CAS.
- M. Mollaei, S. M. Ghoreishi and A. Khoobi, Measurement, 2019, 145, 300–310 CrossRef.
- T. Iftikhar, Y. Xu, A. Aziz, G. Ashraf, G. Li, M. Asif, F. Xiao and H. Liu, ACS Appl. Mater. Interfaces, 2021, 13, 31462–31473 CrossRef CAS PubMed.
- L. Huang, Y. Cao and D. Diao, Sens. Actuators, B, 2020, 305, 127495 CrossRef CAS.
- P. Keerthana, A. George, L. Benny and A. Varghese, Electrochim. Acta, 2023, 448, 142184 CrossRef CAS.
- M. Khodari, G. A. M. Mersal, E. M. Rabie and H. F. Assaf, Int. J. Electrochem. Sci., 2018, 13, 3460–3474 CrossRef CAS PubMed.
- R. Aslam, B. Fatima, D. Hussain, R. Nawaz, S. Majeed, M. N. Ashiq, T. I. Qureshi and M. Najam-Ul-Haq, Int. J. Environ. Anal. Chem., 2021, 101, 2785–2795 CrossRef CAS.
- L. Sun, H. Guo, Z. Pan, B. Liu, T. Zhang, M. Yang, N. Wu, J. Zhang, F. Yang and W. Yang, Colloids Surf., A, 2022, 635, 128114 CrossRef CAS.
- G. Manasa, A. K. Bhakta, Z. Mekhalif and R. J. Mascarenhas, Electroanalysis, 2019, 31, 1363–1372 CrossRef CAS.
- K. D. Kıranşan and E. Topçu, Electroanalysis, 2019, 31, 2518–2529 CrossRef.
Footnote |
| † Electronic supplementary information (ESI) available. See DOI: https://doi.org/10.1039/d3ma01027a |
| This journal is © The Royal Society of Chemistry 2024 |

