 Open Access Article
The emergence of a robust lithium gallium oxide surface layer on gallium-doped LiNiO2 cathodes enables extended cycling stability†
Mritunjay
Mishra
 b and
Koffi P. C.
Yao
 *a
*a
aDepartment of Mechanical Engineering, University of Delaware, Newark, Delaware 19716, USA. E-mail: claver@udel.edu
bDepartment of Chemistry and Biochemistry, University of Delaware, Newark, Delaware 19716, USA
First published on 1st August 2024
Abstract
LiNiO2 is a promising cobalt-free cathode for lithium-ion batteries due to its high theoretical capacity and low cost. Although intensely studied, the occurrence of several phase transformations and particle pulverization causing capacity fading in cobalt-free LiNiO2 have yet to be effectively resolved. Herein, a sol–gel synthesis process is utilized for gallium (Ga) doping of LiNiO2 at 2% (solution-doping) and 5% (excess-doping) molar ratios. Transmission electron microscopy and X-ray diffraction Rietveld refinement reveal the opportune formation of an α-LiGaO2 shell at 5% doping beyond the solubility limit of 2%. Alongside solution-doping at the Ni and Li crystallographic sites, the emergence of this α-LiGaO2, isostructural and lattice-matched to the R![[3 with combining macron]](https://www.rsc.org/images/entities/char_0033_0304.gif) m LiNiO2, is shown to improve capacity retention by a factor of 2.45 after 100 cycles at C/3. Particles with the LiGaO2 shell experience significantly less pulverization during extended cycling. In contrast, the solution-doped LiNiO2 with 2% Ga experiences extensive particle fracturing similar to the baseline undoped LiNiO2. In turn, no significant electrochemical performance difference is found between the solution-doped and baseline LiNiO2. The evidence garnered suggests that a surface gallium oxide phase achievable with excess Ga is key to enabling extended cycling using Ga doping.
m LiNiO2, is shown to improve capacity retention by a factor of 2.45 after 100 cycles at C/3. Particles with the LiGaO2 shell experience significantly less pulverization during extended cycling. In contrast, the solution-doped LiNiO2 with 2% Ga experiences extensive particle fracturing similar to the baseline undoped LiNiO2. In turn, no significant electrochemical performance difference is found between the solution-doped and baseline LiNiO2. The evidence garnered suggests that a surface gallium oxide phase achievable with excess Ga is key to enabling extended cycling using Ga doping.
Introduction
The surge in demand for energy storage has prompted the search for lower-cost lithium-ion battery materials. To ease supply bottlenecks and thereby lower cost, batteries free of contentious cobalt are intensely desired by industries and governments. Among several compositions of cathodes the scientific community hopes to expand the family of viable transition metal oxides LiMOy (where M = Mn, Ni, Fe…) due to their inherent ability to seamlessly intercalate and deintercalate lithium within layered structures.1,2 LiNiO2 in particular can achieve theoretical capacities upward of 270 mA h g−1 with the participation of one mole of lithium in the intercalation process.3 Furthermore, LiNiO2 would be a cobalt-free alternative to LiNixMnyCozO2 (NMC) high-capacity chemistries in use today. Despite the numerous advantages of cobalt-free LiNiO2 such as its high energy density, favorable redox properties (Ni3+ → Ni4+ conversion largely achievable from 3.0 to 4.3 V), and drop-in compatibility with existing cobalt-bearing chemistries, there are several challenges that hinder its commercialization. The H2 ↔ H3 phase transformation appears detrimental to sustained cycling.4 Repeated transitions with the accompanying fluctuations in unit cell volume result in fatigue strain within the material. The aforementioned stresses induce deformation and microstructural damage to the particles. Particle cracking increases the electrochemical surface area and electrolyte penetration, which promotes excessive formation of cathode-electrolyte interphases (CEI). The interphase growth consumes electrolyte and Li+ inventory, thereby compromises long-term cycling stability.5,6 At deeper charge-states, transition from an O3-type (ABCABC stacking) to an O1-type (ABAB) lattice due to interlayer anionic repulsion at low lithium contents occurs, which exacerbates the mechanical instability.4Another major challenge facing the viability of LiNiO2 is the pervasive oxygen (O2) loss at high potential yielding detrimental spinel and rock-salt surface phases. Biasi et al.7 utilized operando X-ray diffraction (XRD) and differential electrochemical mass spectrometry (DEMS) to gain insight into the dynamics impacting the stability of LiNiO2. The authors reported vigorous O2 evolution in the solid-solution regions of H2 and H3 phases, which dropped to a local minimum during the actual H2 ↔ H3 transformation. In contrast, DEMS by Park et al.8 found O2 loss on uncoated-LiNiO2 spanning the entire H2 ↔ H3 transformation range while minimal O2 loss from graphene-coated LiNiO2 coincides with a depressed H2 → H3 peak and extended cycling. Hu et al.9 quantified the gas evolution by single crystal and polycrystalline nickel-rich LiNi0.76Mn0.14Co0.1O2 (NMC76) using DEMS. They observed the onset of O2 evolution at 4.5 V on polycrystalline NMC76. Undetectable O2 evolution in the single crystal counterparts coincided with extended cycling stability of the nickel-rich oxide. Wang et al.10 used in situ XRD to correlate the mechanical breakdown of LiNiO2 and Mg/Ti-doped LiNiO2 cathodes with O2 loss during charge–discharge cycling. The authors in situ electron microscopy show the emergence of stacking faults identified as O1 from O2 loss induced by elevated temperatures and supported by ab initio molecular dynamic (MD) calculations. The authors also resolved via electron tomography the emergence of cracks both in the bulk and on the surface of particles upon the O2 release. Cheng et al.11 used DFT to estimate the average O2 release energy from LiNiO2 at various lithiation states. From fully lithiated Li1−xNiO2 (x = 0) to 75% delithiated Li1−xNiO2 (x = 0.75), the O2 release energy drops from 1.27 eV to 0.15 eV at T = 30 °C and p(O2) = 0.2 atm. External energy input such as an increase in the temperature to T = 200 °C is predicted to result in a spontaneous O2 loss in Li1−xNiO2 (x = 0.75) with a release energy of −0.05 eV. This finding is thermodynamically consistent with the fact that O2 release is ubiquitous under a high applied potential (>4.0 V vs. Li/Li+) as per the experimental gas analysis studies listed above.
From the preponderance of evidence in the literature, O2 release with the accompanying mechanical damage and irreversible phase conversion appears incontrovertible for the neat (polycrystalline) LiNiO2. However, Cheng et al.11 predicted that the addition of dopants with an affinity for surface segregation would increase the average O2 release energy in 75% delithiated Li1−xNiO2. Dopants such as tungsten (W), antimony (Sb), tantalum (Ta), and titanium (Ti) increase the predicted O2 release energy to 0.53, 0.56, 0.40 and 0.35 eV, respectively. Synthesized 2% Sb doped LiNiO2 with the most positive O2 release energy retains ∼5% higher capacity compared to undoped LiNiO2 at C/5 over 60 cycles.
As it stands, a variety of dopants shown in Table S1 (ESI†) have been explored to stabilize the cycling of LiNiO2 including multi-atomic dopants. Fig. 1 summarizes data collected for dopants gallium (Ga), tungsten (W), niobium (Nb), aluminum (Al), and zirconium (Zr). A notable feature is the variability of capacity retention of undoped LiNiO2 prepared by various research groups using different synthesis approaches. The calculated variances for all dopants recorded in Fig. 1 are provided in Table S2 (ESI†). A standard deviation σ ≈ 20% is calculated for undoped LiNiO2 from the 50th cycle data collected herein.12–27 The data collected for Al, Nb, Zr, and W show less prominent variance, albeit possibly due to a concentration of publications in a small set of laboratories; the obtained standard deviations are below 10%. Ga in LiNiO2 has a binding affinity for oxygen and may improve structural stability during cycling. Wu et al.13 found that introducing Ga at the manganese (Mn) site in nickel-rich layered oxide cathode materials (NCM) effectively mitigates cation mixing at synthesis, which boosts capacity retention and thermal stability. Ga as a dopant holds promise towards increasing the longevity of LiNiO2;14,16,17 nonetheless, capacity retention data over 50 cycles show a variance (σ ≈ 17%) similar to that of undoped LiNiO2. For example, Nishida et al.17 demonstrated nearly 100% capacity retention after 50 cycles for 2% Ga-doped LiNiO2 while Song et al.22 reported ∼45% retention after the same 50 cycles with 2.5% Ga-doped LiNiO2. The high variance is due to a significant part of Ga incorporating into the bulk (solid-solution) as well as segregating as lithiated gallium oxide secondary phases, the function of the latter still being largely unclear. From XRD analysis, Kitsche et al.14 reported that the introduction of 2–5% nominal Ga mole fraction, which exceeds the solubility limit estimated at 2%, lead to the formation of the Li5GaO4 impurities. From 2% up to 5% nominal Ga doping, the capacity retention of Li1−yGayNiO2 after 100 cycles at C/2 jumped from ∼80 mA h g−1 to 140–150 mA h g−1. The best performance is achieved at 4% Ga which retained 78% of its initial capacity after 100 C/2 charge–discharge cycles. The report is not definitive as to whether the improved retention stems from a positive impact of the Li5GaO4 impurities (possibly a surface coating) or from the bulk doping of Ga within the LiNiO2 lattice. The uncertainty as to the origin of measurable improvements with Ga doping prompts the present contribution. It is hypothesized here that surface gallium oxide is key to stabilizing the electrochemical cycling under Ga doping.
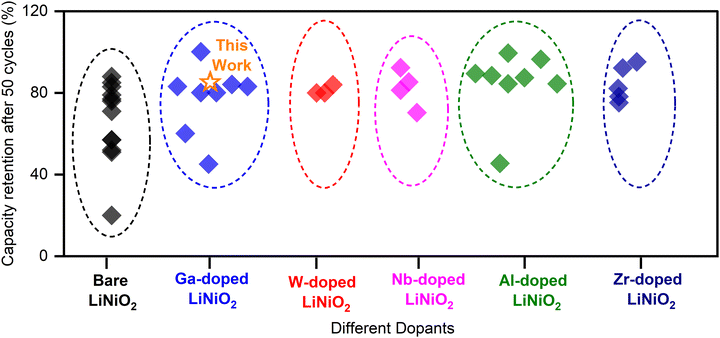 | ||
| Fig. 1 Capacity retention at 50 cycles for LiNiO2 with various dopants from the literature.12–27 | ||
Herein, a comparison is made between undoped, solution-doped (near solubility of 2% Ga), and excess-doped LiNiO2 (5% Ga) in an effort to discern the role of secondary gallium oxide phases. Our sol–gel synthesis in the presence of excess Ga resulted in an unexpected (reported single-phase synthesis at 3 MPa synthesis pressure28) lithium gallate (α-LiGaO2) phase on the surface of the LiNiO2 particles. The α-LiGaO2 (symmetry: R![[3 with combining macron]](https://www.rsc.org/images/entities/char_0033_0304.gif) m, lattice: a = b ≈ 2.911 Å, c ≈ 14.466 Å) surface phase may have formed at the standard synthesis pressure because of its lattice-match against LiNiO2 (symmetry: R
m, lattice: a = b ≈ 2.911 Å, c ≈ 14.466 Å) surface phase may have formed at the standard synthesis pressure because of its lattice-match against LiNiO2 (symmetry: R![[3 with combining macron]](https://www.rsc.org/images/entities/char_0033_0304.gif) m, lattice: a = b ≈ 2.8713 Å, c ≈ 14.1861 Å). The formation enthalpy of LiGaO2 (ΔHf = −918.352 kJ mole−1) is ∼50% more exothermic than that of LiNiO2 (ΔHf = −612.450 kJ mole−1) forecasting a greater thermodynamic barrier to O2 loss from LiGaO2 as a surface phase on LiNiO2. The simultaneous surface coating and solution-doping of the LiNiO2 enhanced the capacity retention by a factor of 2.45 over the undoped LiNiO2. In contrast, the solution-doped LiNiO2 yielded no measurable boost in capacity retention. Post-cycling scanning electron microscopy (SEM) indicates that the excess-doped LiNiO2 withstands pulverization after 100 cycles while the solution-doped and undoped LiNiO2 fracture extensively. These findings suggest that the LiGaO2 surface layer is key to preserving the structural and surface integrity of the material towards extended cycling. The findings offer an informed approach to enhancing the electrochemical performance of cobalt-free LiNiO2 with Ga doping.
m, lattice: a = b ≈ 2.8713 Å, c ≈ 14.1861 Å). The formation enthalpy of LiGaO2 (ΔHf = −918.352 kJ mole−1) is ∼50% more exothermic than that of LiNiO2 (ΔHf = −612.450 kJ mole−1) forecasting a greater thermodynamic barrier to O2 loss from LiGaO2 as a surface phase on LiNiO2. The simultaneous surface coating and solution-doping of the LiNiO2 enhanced the capacity retention by a factor of 2.45 over the undoped LiNiO2. In contrast, the solution-doped LiNiO2 yielded no measurable boost in capacity retention. Post-cycling scanning electron microscopy (SEM) indicates that the excess-doped LiNiO2 withstands pulverization after 100 cycles while the solution-doped and undoped LiNiO2 fracture extensively. These findings suggest that the LiGaO2 surface layer is key to preserving the structural and surface integrity of the material towards extended cycling. The findings offer an informed approach to enhancing the electrochemical performance of cobalt-free LiNiO2 with Ga doping.
Experimental
Synthesis
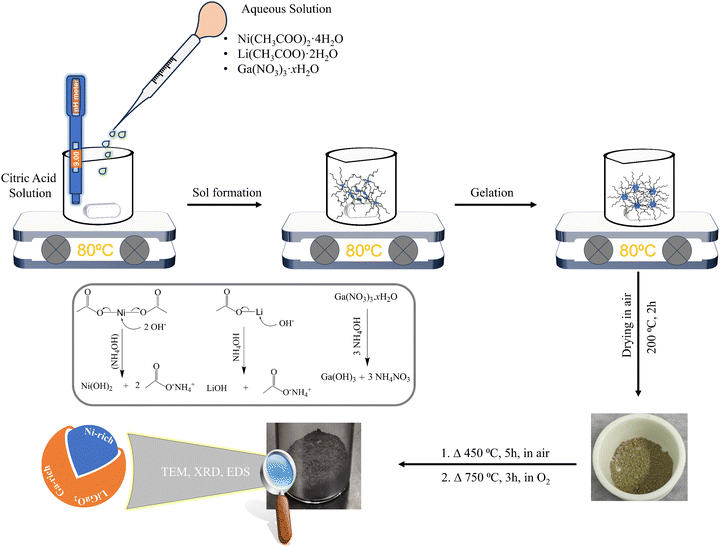
In nominal molar ratio terms, 1% Ga-doped LiNiO2 (denoted “1% Ga–LiNiO2”) to 6% Ga-doped LiNiO2 (denoted “6% Ga–LiNiO2”) were synthesized for comparison with the baseline LiNiO2. A sol–gel synthesis route was utilized as illustrated in Scheme 1. To produce LiNiO2 powders doped with different Ga molar concentrations (0% to 6%), aqueous solutions of Li(CH3COO)·2H2O, Ni(CH3COO)2·4H2O, and Ga(NO3)3·xH2O were prepared in a 50 mL volume of deionized water. Concurrently, a chelating agent solution was prepared by dissolving 1 g of citric acid in 100 mL of deionized water. The solution pH was maintained at 9 through the addition of NH4OH. The specific quantities of the aforementioned metal salts and citric acid employed in the synthesis are itemized in Table 1. The aqueous metal salts solution was introduced dropwise into the citric acid solution under constant stirring followed by heating at a temperature of 80 °C to produce the gel. The gel was subsequently dried at 200 °C for 2 h, producing the precursor powder. The precursor underwent a 450 °C treatment for 5 h in open atmosphere to eliminate carbonaceous impurities. Finally, the powder was annealed at 750 °C in a tube furnace under high-purity oxygen (99.997% O2, Keen Gas grade 4.7) for 3 h to obtain the final cathode material. The heating and subsequent cooling rates were 5 °C min−1.| Compound | Li(CH3COO)·2H2O | Ni(CH3COO)2·4H2O | Ga(NO3)3·xH2O | Citric acid |
|---|---|---|---|---|
| 0% Ga–LiNiO2 | 1.101 | 2.480 | — | 1.000 |
| 1% Ga–LiNiO2 | 1.101 | 2.455 | 0.026 | 1.000 |
| 2% Ga–LiNiO2 | 1.101 | 2.438 | 0.050 | 1.000 |
| 4% Ga–LiNiO2 | 1.101 | 2.438 | 0.101 | 1.000 |
| 5% Ga–LiNiO2 | 1.101 | 2.438 | 0.135 | 1.000 |
| 6% Ga–LiNiO2 | 1.101 | 2.438 | 0.153 | 1.000 |
Material characterization
X-ray diffraction (XRD) patterns were obtained using a Bruker D8 Discover (λCu = 1.5406 Å) diffractometer in Bragg–Brentano mode. Patterns were collected from 10° to 80° 2θ for the as-synthesized as well as cycled 0%, 2% and 5% Ga–LiNiO2 electrodes. Scanning electron microscopy (SEM) and energy-dispersive X-ray spectroscopy (EDS) were performed using a JEOL JSM-7400F at 3 kV and 15 kV, respectively. High resolution transmission electron microscopy (HRTEM, JEOL JEM-2010F) was obtained for pristine 0% and 5% Ga–LiNiO2 at 200 kV. Prior to imaging, the powders were dispersed in isopropyl alcohol (IPA) under sonication and drop-cast onto TEM grids. X-ray photoelectron spectra (XPS) of 0%, 2%, and 5% Ga–LiNiO2 cathodes were carried out using a Thermo Scientific K-Alpha XPS spectrometer (Al Kα source, spot size = 400 μm).Electrode fabrication, battery assembly, and galvanostatic cycling
To produce 0–6% Ga–LiNiO2 electrodes for electrochemical testing, slurries were prepared by mixing 80% active material, 10% super P carbon, and 10% PVDF (polyvinylidene difluoride) in N-methyl-2-pyrrolidone (NMP) using a planetary centrifugal mixer (Thinky AR-100). The resulting slurry was coated onto an aluminum foil using a doctor-blade with the wet coating thickness set to 200 μm. The coated electrodes were dried at 120 °C in a vacuum oven for 24 h followed by calendering to a thickness of ∼50 μm resulting in a mass loading of ∼4 mg cm−2. CR2032 coin cells were assembled in an argon-filled glovebox (<0.1 ppm O2 and H2O); 1 M LiPF6 in ethylene carbonate/ethyl methyl carbonate (1 M LiPF6 in EC![[thin space (1/6-em)]](https://www.rsc.org/images/entities/char_2009.gif) :
:![[thin space (1/6-em)]](https://www.rsc.org/images/entities/char_2009.gif) EMC = 1
EMC = 1![[thin space (1/6-em)]](https://www.rsc.org/images/entities/char_2009.gif) :
:![[thin space (1/6-em)]](https://www.rsc.org/images/entities/char_2009.gif) 1 v/v) procured from Millipore SigmaTM was used as the electrolyte. Lithium foil and LiNiO2 electrodes were 14 mm in diameter and a 16 mm Celgard 2325 trilayer microporous separator was used. Half cells were constructed in the configuration LiNiO2 (0–6% Ga) || 40 μL of 1 M LiPF6 in EC
1 v/v) procured from Millipore SigmaTM was used as the electrolyte. Lithium foil and LiNiO2 electrodes were 14 mm in diameter and a 16 mm Celgard 2325 trilayer microporous separator was used. Half cells were constructed in the configuration LiNiO2 (0–6% Ga) || 40 μL of 1 M LiPF6 in EC![[thin space (1/6-em)]](https://www.rsc.org/images/entities/char_2009.gif) :
:![[thin space (1/6-em)]](https://www.rsc.org/images/entities/char_2009.gif) EMC = 1
EMC = 1![[thin space (1/6-em)]](https://www.rsc.org/images/entities/char_2009.gif) :
:![[thin space (1/6-em)]](https://www.rsc.org/images/entities/char_2009.gif) 1 v/v || Li foil. Galvanostatic charge–discharge (GCD, NEWARE battery cycler) measurements were performed at various C-rates (1C = 180 mA h g−1) within the potential window of 3.0–4.3 V. Electrochemical impedance spectroscopy (EIS) was performed using a PARSTATTM PMC-200 bipotentiostat with perturbation frequencies from 1 MHz to 0.01 Hz.
1 v/v || Li foil. Galvanostatic charge–discharge (GCD, NEWARE battery cycler) measurements were performed at various C-rates (1C = 180 mA h g−1) within the potential window of 3.0–4.3 V. Electrochemical impedance spectroscopy (EIS) was performed using a PARSTATTM PMC-200 bipotentiostat with perturbation frequencies from 1 MHz to 0.01 Hz.
Results and discussion
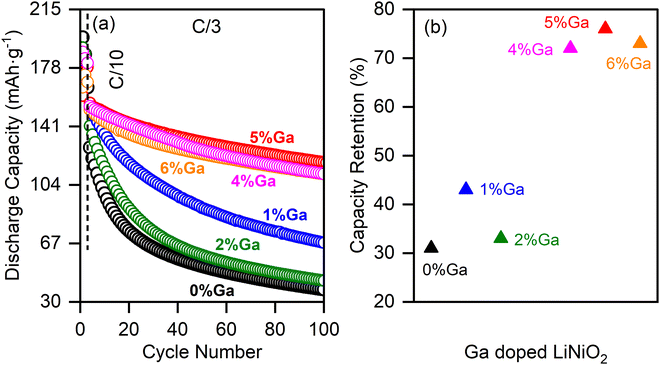
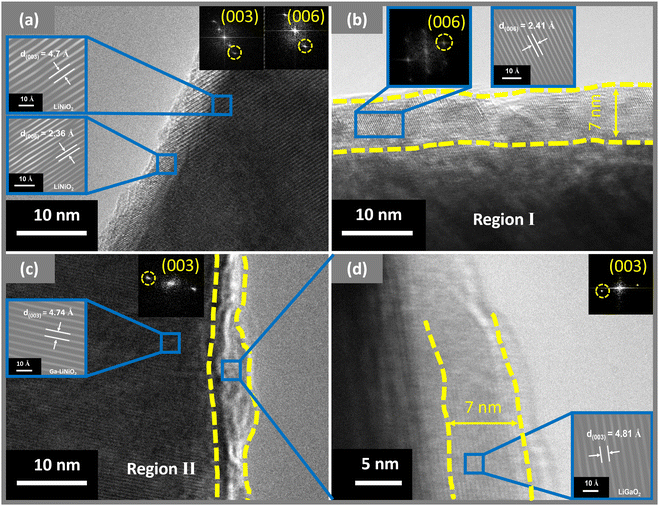
Ga is doped from 0% to 6% into LiNiO2 to understand the electrochemical performance of Ga doped LiNiO2. EDS is used to empirically quantify the molar ratios of Ga to Ni in the doped particles. Fig. S1 (ESI†) provides details of the EDS data collected for the 1% to 6% Ga–LiNiO2 powders. Performing spectroscopy at three randomly selected locations in the dispersed powder, some heterogeneity is observed in the levels of Ga from particle to particle. The average Ga/Ni molar ratios are slightly lower than the targeted values for all doping levels (Table S3, ESI†). Deviation from the targeted value is likely due to unquantified hydration on the Ga(NO3)3·xH2O precursor during precursor weighing. 0–6% Ga–LiNiO2 half-cells were cycled at C/3 for 100 cycles between 3.0 V and 4.3 V and their performance is presented in Fig. 2a. The summary of capacity retention in Fig. 2b shows scattered performance gains below 2% doping; 2% molar ratio of Ga is the reported solubility limit of Ga in LiNiO2 at standard pressures.14 The best performance below 2% doping is found at ∼1% Ga; retention decreases again from 1 to 2% Ga. Most interestingly, Ga doping beyond its solubility limit of 2% results in a notable jump in the retention not attributable to potential cell to cell variations. Retention jumps from the 30% range to the >70% range and remains above this threshold from 4 to 6% The overall best capacity retention rate in the studied doping range of 0 to 6% is found at ∼5% Ga doping with a retention of 76% at cycle 100 in a half-cell. Based on the retention trends in Fig. 2b, undoped LiNiO2 (0% Ga), 2% Ga–LiNiO2, and 5% Ga–LiNiO2 were targeted to elucidate the electrochemistry and crystallography behaviors of undoped, solution-doped (at the solubility limit of 2%), and excess-doped LiNiO2; the goal being to understand the role or lack thereof of the Ga dopant surface segregation on cycling stability. Thereby, the bulk and surface crystallography of the as-synthesized material was investigated by HRTEM (Fig. 3). HRTEM of undoped LiNiO2 shown in Fig. 3a reveals d-spacings measuring 4.7 Å and 2.36 Å, which are readily assigned to the (003) and (006) Miller planes of LiNiO2 in the R![[3 with combining macron]](https://www.rsc.org/images/entities/char_0033_0304.gif) m space group,29 thereby confirming the intended phase. The 5% Ga–LiNiO2 displays a slightly expanded core lattice with a (003) d-spacing of 4.74 Å (Fig. 3c); the larger Ga atom (r(Ga3+) = 0.62 Å vs. r(Ni3+) = 0.56 Å) explains the c-expansion and corroborate a solution of Ga in the bulk of LiNiO2.14,30 However, the surface structure of the 5% Ga–LiNiO2 differs significantly from its bulk; a thin shell (∼7 nm) with larger plane spacings of 2.41 Å (Fig. 3b) and 4.81 Å (Fig. 3d) is resolved. Surprisingly, these measured lattice spacings match well with the reported parameters of the R
m space group,29 thereby confirming the intended phase. The 5% Ga–LiNiO2 displays a slightly expanded core lattice with a (003) d-spacing of 4.74 Å (Fig. 3c); the larger Ga atom (r(Ga3+) = 0.62 Å vs. r(Ni3+) = 0.56 Å) explains the c-expansion and corroborate a solution of Ga in the bulk of LiNiO2.14,30 However, the surface structure of the 5% Ga–LiNiO2 differs significantly from its bulk; a thin shell (∼7 nm) with larger plane spacings of 2.41 Å (Fig. 3b) and 4.81 Å (Fig. 3d) is resolved. Surprisingly, these measured lattice spacings match well with the reported parameters of the R![[3 with combining macron]](https://www.rsc.org/images/entities/char_0033_0304.gif) m isomorph of LiGaO2 (α-LiGaO2, lattice: c ≈ 14.466 Å),28 whereby 4.81 Å and 2.41 Å match with the (003) and (006) plane spacings (14.466 Å/3 = 4.822 Å and 14.466 Å/6 = 2.411 Å). The presence of the LiGaO2 surface phase on 5% Ga–LiNiO2 is confirmed through the Ga2p3/2 XPS peak at 1117.13 eV, (Fig. S2e, ESI†). On the other hand, 2% Ga–LiNiO2 (Fig. S2d, ESI†) shows extremely weak to non-existent Ga XPS signals indicating mostly bulk doping and no Ga-containing surface layer (note that the Ga signal from the bulk in 2% Ga–LiNiO2 is resolved in EDS). HRTEM of 2% Ga–LiNiO2 was not attempted as XPS and EDS line scan data discussed later below ruled out a shell phase. Ga doping reduces cation mixing favouring the anticipated Ni3+ as is evident by the increasing the Ni3+/Ni2+ ratio in XPS with increasing Ga content (Table S4, ESI†).
m isomorph of LiGaO2 (α-LiGaO2, lattice: c ≈ 14.466 Å),28 whereby 4.81 Å and 2.41 Å match with the (003) and (006) plane spacings (14.466 Å/3 = 4.822 Å and 14.466 Å/6 = 2.411 Å). The presence of the LiGaO2 surface phase on 5% Ga–LiNiO2 is confirmed through the Ga2p3/2 XPS peak at 1117.13 eV, (Fig. S2e, ESI†). On the other hand, 2% Ga–LiNiO2 (Fig. S2d, ESI†) shows extremely weak to non-existent Ga XPS signals indicating mostly bulk doping and no Ga-containing surface layer (note that the Ga signal from the bulk in 2% Ga–LiNiO2 is resolved in EDS). HRTEM of 2% Ga–LiNiO2 was not attempted as XPS and EDS line scan data discussed later below ruled out a shell phase. Ga doping reduces cation mixing favouring the anticipated Ni3+ as is evident by the increasing the Ni3+/Ni2+ ratio in XPS with increasing Ga content (Table S4, ESI†).
The X-ray diffraction (XRD) spectra of all 0–6% Ga–LiNiO2 are shown in Fig. S3 (ESI†). Detailed XRD analyses of the three targeted Ga–LiNiO2 powders (0%, 2% and 5% Ga) are presented in Fig. 4a. The major peaks are all indexable to the intended α-NaFeO2-type crystal for all three levels of doping. Well-segregated (006)/(012) and (110)/(108) reflections (Fig. 4b and c) confirm the layered structure of the produced oxides. The I(003)/I(104) ratios in all three powders exceed 1.2 indicating negligible cation mixing. Rietveld refinements of 0%, 2%, and 5% Ga–LiNiO2 result in satisfactory weighted profile reliability factors (Rwp) of 7.4%, 7.12% and 8.47%, respectively (Fig. 4d–f). The full-width at half-maximum (FWHM) of the (003) peaks (Table S5, ESI†) show significant broadening for 5% Ga–LiNiO2 (21–33% greater than the 0 and 2% Ga–LiNiO2 doping levels, see Fig. S4a, ESI†) pointing again to a potential secondary R![[3 with combining macron]](https://www.rsc.org/images/entities/char_0033_0304.gif) m phase. Aided by the HRTEM findings, a secondary phase of α-LiGaO2 is introduced during the refinement of 5% Ga–LiNiO2; refinement in the absence of this secondary phase yielded poor Rwp. An overall downshift of the (003) reflection is observed as the Ga content increases from 0% to 2% to 5% (Fig. S4a, ESI†) indicating an increase in the c-parameter from Ga-doping. Expansion of the c-parameter upon Ga doping is confirmed by the refinement (Table 2), which is supported by the HRTEM findings above. The c/a ratios are similar for the undoped LiNiO2 and Ga-doped LiNiO2 phases; the insertion of Ga in the LiNiO2 lattice does not appear to significantly affect the extent of trigonal distortion within the materials. The detailed refinement results are provided in Tables S6, S7 and S8 (ESI†) for 0%, 2%, and 5% Ga–LiNiO2, respectively. Occupancy refinement for the undoped LiNiO2 (i.e., 0% Ga) finds ∼3.6% Ni at the Li site (Wycoff 3a) reciprocated by ∼3.6% Li at the Ni site (Wycoff 3b). In the Ga-doped powders, Ga in the bulk is found to predominantly occupy the Li site with a minor presence at the Ni site for both 2% Ga–LiNiO2 and 5% Ga–LiNiO2. Notably, acceptable refinement (Rwp < 10%) for the 5% Ga–LiNiO2 did not necessitate increase in the Ga occupancy (vs. occupancy in 2% Ga–LiNiO2) at the 3a and 3b sites. Specifically, a Ga occupancy of 1.6–1.7% at the Li 3a site was calculated after Rietveld convergence for both the 2% and 5% levels of doping. Furthermore, the change in the primary phase c-parameter between 2% and 5% Ga-doped (∼0.003 Å) is 6.7 times less than the ∼0.02 Å increase from 0% to 2% Ga-doped (Table 2). These observations confirm the reported bulk solubility limit near 2% Ga at standard pressure conditions.14
m phase. Aided by the HRTEM findings, a secondary phase of α-LiGaO2 is introduced during the refinement of 5% Ga–LiNiO2; refinement in the absence of this secondary phase yielded poor Rwp. An overall downshift of the (003) reflection is observed as the Ga content increases from 0% to 2% to 5% (Fig. S4a, ESI†) indicating an increase in the c-parameter from Ga-doping. Expansion of the c-parameter upon Ga doping is confirmed by the refinement (Table 2), which is supported by the HRTEM findings above. The c/a ratios are similar for the undoped LiNiO2 and Ga-doped LiNiO2 phases; the insertion of Ga in the LiNiO2 lattice does not appear to significantly affect the extent of trigonal distortion within the materials. The detailed refinement results are provided in Tables S6, S7 and S8 (ESI†) for 0%, 2%, and 5% Ga–LiNiO2, respectively. Occupancy refinement for the undoped LiNiO2 (i.e., 0% Ga) finds ∼3.6% Ni at the Li site (Wycoff 3a) reciprocated by ∼3.6% Li at the Ni site (Wycoff 3b). In the Ga-doped powders, Ga in the bulk is found to predominantly occupy the Li site with a minor presence at the Ni site for both 2% Ga–LiNiO2 and 5% Ga–LiNiO2. Notably, acceptable refinement (Rwp < 10%) for the 5% Ga–LiNiO2 did not necessitate increase in the Ga occupancy (vs. occupancy in 2% Ga–LiNiO2) at the 3a and 3b sites. Specifically, a Ga occupancy of 1.6–1.7% at the Li 3a site was calculated after Rietveld convergence for both the 2% and 5% levels of doping. Furthermore, the change in the primary phase c-parameter between 2% and 5% Ga-doped (∼0.003 Å) is 6.7 times less than the ∼0.02 Å increase from 0% to 2% Ga-doped (Table 2). These observations confirm the reported bulk solubility limit near 2% Ga at standard pressure conditions.14
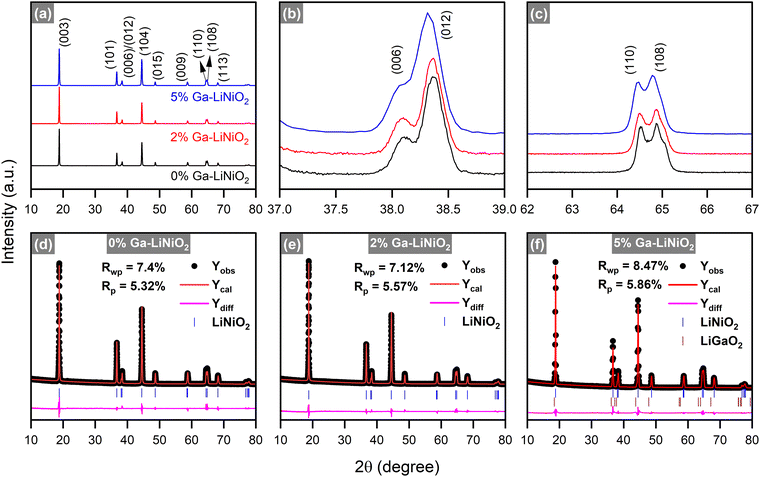 | ||
| Fig. 4 (a)–(c) X-ray diffraction patterns and (d)–(f) Rietveld refined profiles of 0% Ga–LiNiO2, 2% Ga–LiNiO2, and 5% Ga–LiNiO2. The 2θ axis is with respect to Cu Kα (λ = 1.5406 Å). | ||
| a (Å) | c (Å) | c/a | |
|---|---|---|---|
| LiNiO2 | 2.8770 | 14.2052 | 4.9375 |
| 2% Ga–LiNiO2 | 2.8814 | 14.2293 | 4.9383 |
| 5% Ga–LiNiO2 | |||
| Phase 1 (Ga-doped LiNiO2) | 2.8810 | 14.2263 | 4.9379 |
| Phase 2 (LiGaO2) | 2.90648 | 14.4356 | 4.9667 |
Kitsche et al.14 reported the growth of secondary peaks corresponding to Li5GaO4 in the range 8.4 ≤ 2θλ=0.62Å ≤ 13.3 (20.97 ≤ 2θλ=1.5406Å ≤ 33.44), which strengthened with the increasing Ga-content. Magnifying this region in our spectra (Fig. S4b, ESI†), no peaks corresponding to Li5GaO4 are resolved in our Ga doped powders. Instead, minor peaks attributed to Li2CO3, a common impurity on LiNiO2, are resolved in both the undoped and Ga doped powder spectra. Furthermore, the surface phase observed by HRTEM displays a d-spacing of 4.81 Å; the nearest d-spacing in the Li5GaO4 crystal is ∼4.6 Å for the (002) planes excluding it as the likely phase. The referenced study utilized a chelating agent-free wet-mixing synthesis approach and annealing under O2 was done at 700 °C. In contrast, our sol–gel synthesis makes use of citric acid as a chelating agent and the annealing is performed at 750 °C under O2. It is understood that minor alterations in the synthesis approach can significantly impact the phase(s) in the final product.
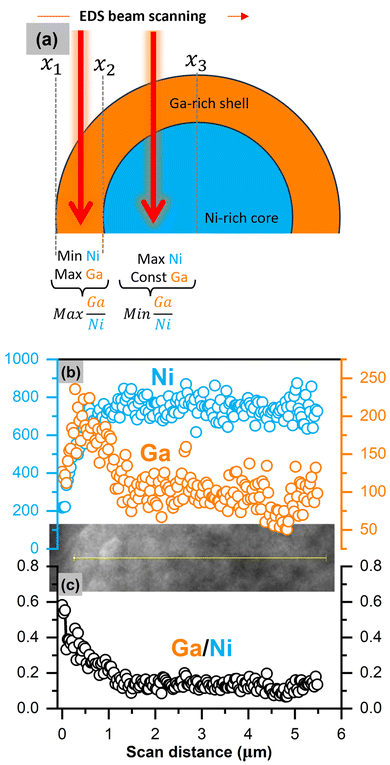
HRTEM in Fig. 3b and c above suggests a shell phase on the 5% Ga–LiNiO2 particle which, from the evidence discussed thus far, appears to be Ga rich (α-LiGaO2). An EDS line scan is obtained for 2% and 5% Ga–LiNiO2 with the goal of resolving such core–shell structure from the predictable signal patterns in such configuration. Modeling of the expected line scan signal pattern for a spherical core–shell configuration is provided in Fig. S5 (ESI†) with the corresponding pseudo-code of the simulation. In a core–shell configuration such as that shown schematically in Fig. 5a, the Ga signal would jump to a maximum at the edge (x1 → x2) of the scan where the beam would graze mostly the Ga-rich shell and then decrease to local minimum where it would plateau onward (x2 → x3). The Ni-rich core signal would increase to a maximum and remain at this maximum as the beam scans toward the particle center. This pattern is verified in the experimental data collected for 5% Ga–LiNiO2 as shown in Fig. 5b whereby starting from the edge of the particle inward, the EDS signal of Ga jumps to a maximum before decreasing and plateauing to a constant value. Meanwhile, the Ni signal increases to a maximum value and maintains this maximum value as the beam moves towards the particle center. Both signals track well with the core–shell EDS simulation (see Fig. S5a, ESI†). The Ga/Ni ratio calculated over a line scan (Fig. 5c) is highest at the edge of the scan, rapidly decreases before plateauing, again tracking the simulation trend in Fig. S5b (ESI†). In contrast, for the 2% Ga–LiNiO2 (anticipated as a solid-solution), the Ga and Ni signals both jump to their maxima whence the EDS beam reaches the particle (Fig. S6, ESI†). Unlike the 5% Ga–LiNiO2, the Ga signal in the 2% Ga–LiNiO2 does not decrease meaningfully before plateauing. Instead, the Ni and Ga signals fluctuate about the maxima during the spatial scan indicating a homogenous solution. Thereby, we confirm a Ga-rich shell on 5% Ga–LiNiO2 which we assign to α-LiGaO2 based on HRTEM, XRD, and XPS discussed above while at 2% Ga no Ga-rich shell is detected but instead a solid-solution.
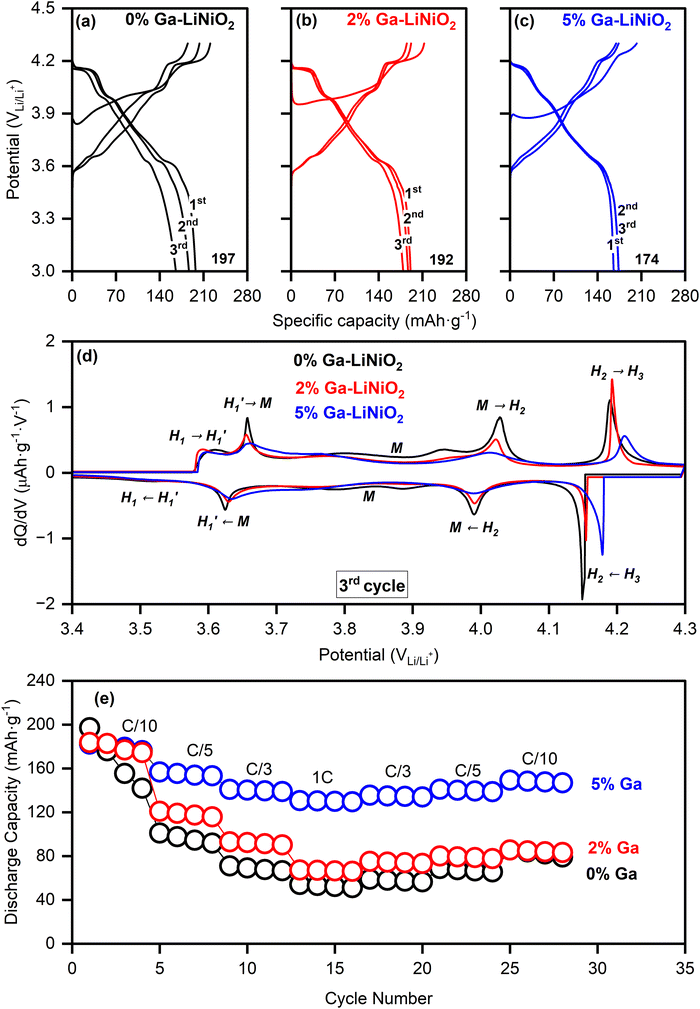
The galvanostatic charge–discharge profiles of undoped and Ga–LiNiO2 are shown in Fig. 6a–c. The 0%, 2%, and 5% Ga-doped LiNiO2 achieved initial C/10 discharge capacities of 197 mA h g−1, 192 mA h g−1, and 174 mA h g−1, respectively. On the one hand, the systematic reduction in the extracted specific capacity as the Ga content increases is partly due to the increasing proportion of inactive Ga phases; the calculated theoretical specific capacities in Table S9 (ESI†) support this trend. On the other hand, the measured loss of ∼20 mA h g−1 after 5% Ga doping is disproportionate versus the expected ∼6 mA h g−1 loss from the doping especially at such low C/10 rate; the LiGaO2 surface phase could be impeding the Li+ exchange at the surface.
Indeed, a higher charge transfer resistance (Rct) is found for 5% Ga–LiNiO2 electrodes (Rct ∼ 130 Ω) compared to the 0% (Rct ∼ 105 Ω) and 2% (Rct ∼ 100 Ω) Ga–LiNiO2 electrodes (Fig. S7a, ESI†). Decreased kinetics is therefore the likely source of the ∼20 mA h g−1 decrease in capacity between undoped and 5% doped Ga–LiNiO2 at C/10.
The evolution of distinct phases is probed via the differential capacity (dQ/dV); the 3rd cycle is used for this purpose in order to analyze the stabilized state of the cell (Fig. 6d). The typical dQ/dV peaks revealing five distinct phases (H1, H1′, M, H2 and H3) of LiNiO2 are present in the undoped and Ga-doped cathodes.7,31,32 The dQ/dV peak intensities of H1′ ↔ M, M ↔ H2, and H2 ↔ H3 interconversions generally become lower and broader as the Ga content increases. However, the H2 ↔ H3 peaks of the 5% Ga–LiNiO2, both on oxidation and reduction, are most significantly depressed and shifted rightward (to higher voltages) compared to both 0% and 2% Ga–LiNiO2; the right-shift is consistent on the first and second cycles (Fig. S8, ESI†). Although some shift in the H1′ ↔ M and M ↔ H2 as Ga content increases can be noted, they are subdued compared to the displacement of the H2 ↔ H3 in 5% Ga–LiNiO2. Biasi et al.7 concluded using DEMS that O2 loss in LiNiO2 is most vigorous during the solid-solution delithiation of the H2 and later H3 phases. Nonetheless, the intensity of H2 → H3 peak correlates with the O2 loss; DEMS by Park et al.8 found O2 loss on uncoated-LiNiO2 spanning the entire H2 to H3 phase range while minimal loss from graphene-coated LiNiO2 coincides with a depressed H2 → H3 peak. Thereby, the upshift (+20 mV) and magnitude reduction of the anodic H2 → H3 conversion as Ga increases herein signal reduction in detrimental O2 loss likely afforded by the surface α-LiGaO2 on the 5% Ga–LiNiO2. It is notable that the H2 → H3 peak of the 2% Ga–LiNiO2 does not differ as significantly in position and magnitude from the undoped LiNiO2 (contrary to the 5% Ga–LiNiO2, Fig. 6d). Specific capacities of 38 mA h g−1, 45 mA h g−1, and 118 mA h g−1 are recorded at the 100th C/3 cycle for 0%, 2%, and 5% Ga–LiNiO2, respectively (Fig. 2a). In keeping with its depressed and upshifted anodic H2 → H3 peak signaling a lower rate of O2 loss, the 5% Ga–LiNiO2 retains distinctly higher capacity at C/3 (76%) after 100 cycles compared to 2% Ga–LiNiO2 (33%) and 0% Ga–LiNiO2 (31%).
The coulombic efficiencies (CE) during cycling are shown in Fig. S9 (ESI†). The first cycle CE are 89.3% 89.7%, and 82% for 0, 2, and 5% Ga, respectively. The lower initial CE of 5% Ga–LiNiO2 is tentatively ascribed to the presence of LiGaO2 surface coating causing higher impedance in the early cycles (Fig. S7a, ESI†). Following three formation cycles, the CE of the 0% and 2% Ga–LiNiO2 progressively increases, crossing 99% at cycle 25. The 5% Ga–LiNiO2 on the other hand achieved a CE of ∼99.6% immediately after three formation cycles and maintained this CE for the remaining 100 cycles. The more stable CE of 5% Ga–LiNiO2 aligns with indications of reduced O2 loss and may further reflect the absence of particle pulverization and accompanying more stable CEI compared to the 0 and 2% Ga–LiNiO2 (discussed below).
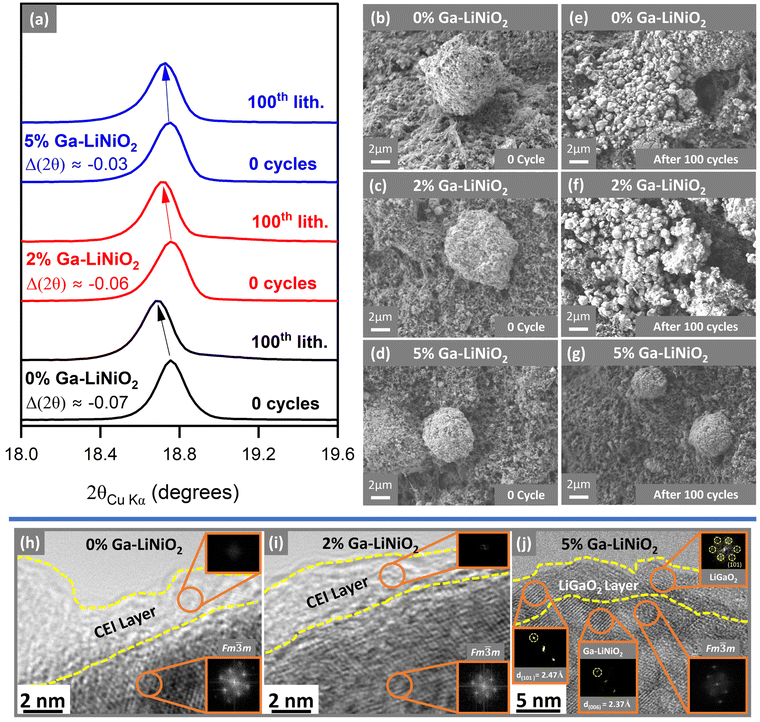
Postmortem XRD analysis of the electrodes after the 100th lithiation cycle shows substantial downshift in the 2θ(003) value for 0% and 2% Ga-doped LiNiO2 (Fig. 7a) compared to the as-synthesized state. This downshift suggests the post-cycling Li content in those cathode materials is significantly lower (expanded c-axis) compared to the as-synthesized powder. The 2θ(003) of 5% Ga-doped LiNiO2 experiences approximately half the 2θ(003) downshift of 0% and 2% Ga-doped LiNiO2 after 100 cycles, indicating less Li+ loss in agreement with its increased capacity retention in Fig. 2a.
One of the defining modes of failure of LiNiO2 cathode particles is cracking and pulverization during extended cycling.8 Therefore, pre-, and post-cycling SEM images of particles in the electrodes are presented in Fig. 7b–g. The starting active material for all three levels of doping are spheroidal aggregates of nanosized primary particles into secondary particles on the order of 10–20 μm. The undoped 0% (Fig. 7bvs.Fig. 7e) and solution-doped 2% (Fig. 7cvs.Fig. 7f) Ga–LiNiO2 particles experience extensive pulverization after 100 C/3 cycles. The starting aggregates are shattered into their primary particles in Fig. 7e and f. In contrast, the 5% Ga–LiNiO2 shows far fewer shattered aggregates after 100 cycles (Fig. 7dvs.Fig. 7g). Multiple locations on the electrode surfaces were surveyed to ensure the statistical validity of these observations (see Fig. S10–S12, ESI†). Shattering of the secondary particle such as seen for the 0% and 2% Ga–LiNiO2 produces smaller particles increasing the surface area exposed to the electrolyte. In turn the large area increases parasitic reactions at the cathode||electrolyte interface that consume Li+ from active cathode.29,33,34
HRTEM images were acquired for 0%, 2%, and 5% Ga–LiNiO2 samples after 100 cycles to investigate the cathode surface. In Fig. 7h and i, both the 0% and 2% Ga-doped LiNiO2 particles have a thick amorphous (no diffraction spots in the FFT) interphase layer on the surfaces. Conversely, no such amorphous phase is resolved on the surface of 5% Ga-doped LiNiO2 sample (Fig. 7j). The presence of a LiGaO2 surface layer on 5% Ga-doped appears to diminish the parasitic CEI reactions partly responsible for irreversible Li+ loss from the lattice. The surface LiGaO2 on 5% Ga–LiNiO2 has a more significant impact on increasing capacity retention compared to only bulk doping in 2% Ga–LiNiO2. The preservation of the surface α-LiGaO2 phase on 5% Ga–LiNiO2, post 100 cycles, is confirmed via the d-spacing of 2.47 Å corresponding to its (101) miller planes (Fig. 7j). In contrast, no such d-spacing is found on the surface of 2% Ga–LiNiO2 post 100 cycles (Fig. 7i); a confirmation that no surface gallate layer was formed at synthesis.
The absence of the surface gallate on 2% Ga–LiNiO2 coincides with extensive near surface reconstruction to rocksalts in the Fm![[3 with combining macron]](https://www.rsc.org/images/entities/char_0033_0304.gif) m space group; the surface of 0% Ga–LiNiO2 is similarly reconstructed. In contrast, with α-LiGaO2 remaining on the surface of 5% Ga–LiNiO2, the d(006) = 2.37 Å corresponding the R
m space group; the surface of 0% Ga–LiNiO2 is similarly reconstructed. In contrast, with α-LiGaO2 remaining on the surface of 5% Ga–LiNiO2, the d(006) = 2.37 Å corresponding the R![[3 with combining macron]](https://www.rsc.org/images/entities/char_0033_0304.gif) m layered LiNiO2 is still detectable in the near surface region (Fig. 7j). A few Fm
m layered LiNiO2 is still detectable in the near surface region (Fig. 7j). A few Fm![[3 with combining macron]](https://www.rsc.org/images/entities/char_0033_0304.gif) m rocksalt spots are detected however, suggesting some, although markedly reduced surface reconstruction (Fig. S13, ESI†).
m rocksalt spots are detected however, suggesting some, although markedly reduced surface reconstruction (Fig. S13, ESI†).
The rapid capacity fade of the 0% and 2% Ga–LiNiO2 are easily attributable to their pulverization and surface changes. This claim is supported by the EIS of cycled electrodes. The impedance growth after 100 C/3 cycles is nearly fourfold lower for the 5% Ga compared to the 0% and 2% Ga–LiNiO2 (Fig. S7b, ESI†), a reflection of the drastically diminished particle breakage and thereby lower exposed surface area for reconstruction and resistive CEI growth. Particle shattering has been linked to O2 loss and mechanical fatigue from repeated phase transitions.8 The surface α-LiGaO2 observed by HRTEM and the accompanying depressed H2 → H3 transitions in 5% Ga–LiNiO2 supports mitigation of these factors which explains the preservation of the integrity of secondary particles over 100 cycles.
Given the greater capacity retention at C/3, the rate capability of 5% Ga–LiNiO2 was compared against the 2% and baseline 0% Ga–LiNiO2 at C/10, C/5, C/3, and 1C rate (Fig. 6e). As expected, the capacity output of three cathodes decreases with increasing C-rate due to polarization; however, the performance of 5% Ga–LiNiO2 significantly exceeds that of the baseline and 2% Ga–LiNiO2 in agreement with the C/3 result in Fig. 2a. At 1C, 5% Ga–LiNiO2 achieves ∼130 mA h g−1 while 2% and 0% Ga–LiNiO2 only achieve ∼67 and ∼52 mA h g−1 respectively. The intercalation kinetics appear more efficient in the presence of the surface gallate layer which matches with the suppressed growth of the charge transfer resistance shown in Fig. S7b (ESI†). As the 5% Ga–LiNiO2 particles do not crack to expose more surface area, the growth of kinetically unfavorable cathode electrolyte interphase (CEI) is curtailed by the surface LiGaO2 to maintain optimal intercalation kinetics.
Conclusions
Cobalt-free, Ga-doped LiNiO2 were produced with 0%, 1%, 2% (solution-doped), and 4%, 5%, 6% (excess-doped) Ga to Ni molar ratios with the goal of resolving the role of surface gallium–oxide phases. Under the sol–gel synthesis method utilized, XRD, HRTEM, and EDS show the unusual formation of an α-LiGaO2 surface layer on LiNiO2 when the Ga molar ratio exceeds its reported solubility in LiNiO2 in the excess-doped particles. Comparing the electrochemistries of solution-doped and excess-doped Ga–LiNiO2, the α-LiGaO2 coating appears key to softening the high-voltage H2 → H3 phase transformation, which correlates with the drastically reduced O2 loss, surface reconstruction, and fracturing in the cathode material. Further validation using SEM imaging post 100 cycles shows markedly reduced particle cracking only in the excess-doped 5% Ga–LiNiO2 particles; the undoped and solution-doped LiNiO2 particles display extensive fracturing. Post-mortem HRTEM uncovers suppressed surface reconstruction of the particle only in the presence of the α-LiGaO2 surface layer on 5% Ga–LiNiO2. The result of the suppression of these damaging processes is significantly enhanced capacity retention and rate capability. A retention rate of 76% in half-cells is observed for 5% Ga–LiNiO2 compared to 31% and 33% for similarly synthesized undoped and solution-doped LiNiO2. This finding underscores the role and necessity of the surface gallium oxide phase in suppressing the processes responsible for O2 loss, surface reconstruction, particle pulverization, and Li+ loss in LiNiO2.Author contributions
MM collected the research data and prepared the manuscript figures and drafting. KPCY is the research P. I. and provided the research motivation, experimental planning, and manuscript editing.Data availability
This research is supported by funds made available to the researchers by the University of Delaware. All raw data generated for the purpose of this article submission are the property of the University of Delaware and cannot legally be made available at the time of this submission. The authors reserve the right to use this data in future derivative work and retain sole rights to its use. No data from external databases were used in the production of this manuscript. All literature information in the manuscript is referenced in the citations.Conflicts of interest
There are no conflicts to declare.Acknowledgements
This work was supported by the University of Delaware. MM is grateful to Dr Kelvin Fu (Department of Mechanical Engineering, University of Delaware, Newark, DE-19716) for providing the tubular furnace used for annealing. TEM, SEM and EDS were collected at the Keck Center for Advanced Microscopy and Microanalysis at the University of Delaware. XRD data were collected at the University of Delaware Advanced Materials Characterization Laboratory.References
- M. M. Thackeray and K. Amine, Nat. Energy, 2021, 6, 566 CrossRef CAS.
- M. Mishra, G. S. Taiwo and K. P. C. Yao, ACS Appl. Mater. Interfaces, 2022, 15, 14261–14273 Search PubMed.
- T. Ohzuku, A. Ueda and M. Nagayama, J. Electrochem. Soc., 1993, 140, 1862–1870 CrossRef CAS.
- J. Cheng, B. Ouyang and K. A. Persson, ACS Energy Lett., 2023, 8, 2401–2407 CrossRef CAS.
- M. Bianchini, M. Roca-Ayats, P. Hartmann, T. Brezesinski and J. Janek, Angew. Chem., Int. Ed., 2019, 58, 10434–10458 CrossRef CAS PubMed.
- C. S. Yoon, D. W. Jun, S. T. Myung and Y. K. Sun, ACS Energy Lett., 2017, 2, 1150–1155 CrossRef CAS.
- L. de Biasi, A. Schiele, M. Roca-Ayats, G. Garcia, T. Brezesinski, P. Hartmann and J. Janek, ChemSusChem, 2019, 12, 2240–2250 CrossRef CAS PubMed.
- K. Y. Park, Y. Zhu, C. G. Torres-Castanedo, H. J. Jung, N. S. Luu, O. Kahvecioglu, Y. Yoo, J. W. T. Seo, J. R. Downing, H. D. Lim, M. J. Bedzyk, C. Wolverton and M. C. Hersam, Adv. Mater., 2022, 34, 2106402 CrossRef CAS PubMed.
- J. Hu, L. Li, Y. Bi, J. Tao, J. Lochala, D. Liu, B. Wu, X. Cao, S. Chae, C. Wang and J. Xiao, Energy Storage Mater., 2022, 47, 195–202 CrossRef.
- C. Wang, L. Han, R. Zhang, H. Cheng, L. Mu, K. Kisslinger, P. Zou, Y. Ren, P. Cao, F. Lin and H. L. Xin, Matter, 2021, 4, 2013–2026 CrossRef CAS.
- J. Cheng, L. Mu, C. Wang, Z. Yang, H. L. Xin, F. Lin and K. A. Persson, J. Mater. Chem. A, 2020, 8, 23293–23303 RSC.
- C. S. Yoon, M. J. Choi, D. W. Jun, Q. Zhang, P. Kaghazchi, K. H. Kim and Y. K. Sun, Chem. Mater., 2018, 30, 1808–1814 CrossRef CAS.
- L. Wu, X. Tang, X. Chen, Z. Rong, W. Dang, Y. Wang, X. Li, L. Huang and Y. Zhang, J. Power Sources, 2020, 445, 227337 CrossRef CAS.
- D. Kitsche, S. Schweidler, A. Mazilkin, H. Geßwein, F. Fauth, E. Suard, P. Hartmann, T. Brezesinski, J. Janek and M. Bianchini, Mater. Adv., 2020, 1, 639–647 RSC.
- X.-Z. Kong, D.-L. Li, K. Lahtinen, T. Kallio and X.-Q. Ren, J. Electrochem. Soc., 2020, 167, 140545 CrossRef CAS.
- H. R. Park, J. Ind. Eng. Chem., 2010, 16, 698–702 CrossRef CAS.
- Y. Nishida, K. Nakane and T. Satoh, J. Power Sources, 1997, 68, 561–564 CrossRef CAS.
- G.-X. Huang, R.-H. Wang, X.-Y. Lv, J. Su, Y.-F. Long, Z.-Z. Qin and Y.-X. Wen, J. Electrochem. Soc., 2022, 169, 040533 CrossRef CAS.
- H. U. Kim, J. Song, D. R. Mumm and M. Y. Song, Ceram. Int., 2011, 37, 779–782 CrossRef CAS.
- W. M. Seong and A. Manthiram, ACS Appl. Mater. Interfaces, 2020, 12, 43653–43664 CrossRef CAS PubMed.
- J. Li, Y. Zhu, B. Pang and P. Gao, J. Mater. Sci., 2022, 57, 17722–17734 CrossRef CAS.
- M. Y. Song, S. N. Kwon and H. R. Park, Ceram. Int., 2009, 35, 3135–3141 CrossRef CAS.
- A. Mesnier and A. Manthiram, ACS Appl. Mater. Interfaces, 2020, 12, 52826–52835 CrossRef CAS PubMed.
- C. S. Yoon, U. H. Kim, G. T. Park, S. J. Kim, K. H. Kim, J. Kim and Y. K. Sun, ACS Energy Lett., 2018, 3, 1634–1639 CrossRef CAS.
- H. Cao, F. Du, J. Adkins, Q. Zhou, H. Dai, P. Sun, D. Hu and J. Zheng, Ceram. Int., 2020, 46, 20050–20060 CrossRef CAS.
- S. H. Park, K. S. Park, Y. Kook Sun, K. S. Nahm, Y. S. Lee and M. Yoshio, Electrochim. Acta, 2001, 46, 1215–1222 CrossRef CAS.
- S. L. Dreyer, P. Kurzhals, S. B. Seiffert, P. Müller, A. Kondrakov, T. Brezesinski and J. Janek, J. Electrochem. Soc., 2023, 170, 060530 CrossRef CAS.
- M. Marjzio and J. P. Remeika, J. Phys. Chem. Solids, 1965, 26, 1277–1280 CrossRef.
- H. Kaneda, Y. Furuichi, A. Ikezawa and H. Arai, ACS Appl. Mater. Interfaces, 2022, 14, 52766–52778 CrossRef CAS PubMed.
- R. Stoyanova, E. Zhecheva, R. Alcántara, J. L. Tirado, G. Bromiley, F. Bromiley and T. B. Ballaran, J. Mater. Chem., 2004, 14, 366–373 RSC.
- J. P. Peres, F. Weill and C. Delmas, Solid State Ion., 1999, 116, 19–27 CrossRef CAS.
- J. Chen, H. Yang, T. Li, C. Liu, H. Tong, J. Chen, Z. Liu, L. Xia, Z. Chen, J. Duan and L. Li, Front. Chem., 2019, 7, 00500 CrossRef CAS PubMed.
- T. Liu, L. Yu, J. Lu, T. Zhou, X. Huang, Z. Cai, A. Dai, J. Gim, Y. Ren, X. Xiao, M. V. Holt, Y. S. Chu, I. Arslan, J. Wen and K. Amine, Nat. Commun., 2021, 12, 6024 CrossRef CAS PubMed.
- R. Ruess, S. Schweidler, H. Hemmelmann, G. Conforto, A. Bielefeld, D. A. Weber, J. Sann, M. T. Elm and J. Janek, J. Electrochem. Soc., 2020, 167, 100532 CrossRef CAS.
Footnote |
| † Electronic supplementary information (ESI) available: Variance and SD calculations, literature review, XRD fittings and refinement results, EDS (line scan) data and line scan simulation, impedance profile, differential capacity plot, and SEM images of cycled electrodes. See DOI: https://doi.org/10.1039/d3ma01102j |
| This journal is © The Royal Society of Chemistry 2024 |

