 Open Access Article
Controlling the magnitude and polarity of surface charges in PEBA polymers by adding UIO-66 MOFs†
Linards
Lapčinskis
 a,
Andris
Šutka
 *a,
Martynas
Kinka
*b,
Fa-Kuen
Shieh
 *c,
Līva
Ģērmane
 a,
Sergejus
Balčiūnas
b,
Artis
Linarts
a and
Robertas
Grigalaitis
b
aInstitute of Materials and Surface Engineering, Faculty of Natural Sciences and Techology, Riga Technical University, Paula Valdena 3/7, Riga 1048, Latvia. E-mail: Andris.Sutka@rtu.lv
bFaculty of Physics, Vilnius University, Sauletekio av. 3, 10257 Vilnius, Lithuania. E-mail: martynas.kinka@ff.vu.lt
cDepartment of Chemistry, National Central University, Taoyuan 32001, Taiwan. E-mail: fshieh@ncu.edu.tw
First published on 4th April 2024
Abstract
The polarity of the polymer surface charge is important for constructing triboelectric devices where asymmetric charging tendencies of contacting materials are required. In the present work, we show that the addition of UiO-66 and UiO-66-NH2 metal–organic framework (MOF) particles into a polyether block amide (PEBA) polymer increases the triboelectric surface charge density and allows controlling the charge polarity. The composites of the PEBA polymer with 0.1–5 wt% MOFs enhanced the surface charge density of pristine PEBA in the whole compositional range. The triboelectric properties can be tuned not only by the amount of MOF fillers but also by modification of UIO-66 1,4-benzenedicarboxylic acid linkers with additional –NH2 groups. PEBA/UiO-66-NH2 composites remain positively charged, while the PEBA/UiO-66 system undergoes a change of the triboelectric surface charging from positive to negative between 0.5 wt% and 1 wt%. This material shows more tendency for a negative charge than Teflon.
Introduction
In recent years, the search for materials possessing higher triboelectric performance has intensified. This interest stems from the desire to find materials suitable for enhancing triboelectric nanogenerator (TENG) device efficiency. TENG devices, introduced in 2012, represent a pioneering concept to convert surplus mechanical energy into electricity, thereby allowing the powering of autonomous microdevices. This innovation shows significant promise for mitigating the environmental impact associated with traditional energy production and battery usage. Notably, TENG devices have already been demonstrated to illuminate up to 8000 LEDs, propel autonomous gas sensor devices, fuel biomedical equipment, and facilitate battery charging.1–3For an enhanced TENG device output, it is necessary to design polymers with asymmetric charging tendencies to gain positive or negative triboelectric surface charges. For this, the triboelectric series are used as guidance.4 However, the mechanical properties of the polymers from the series do not always meet the desired characteristics for practical applications. For mechanical energy harvesting from movement, for example, soft and flexible materials are needed for more effective integration in wearables.5 Herein, we present a method of controlling the surface charge polarity of soft elastomeric PEBA polymers by adding MOF fillers UiO-66 and UiO-66-NH2.
Metal–organic frameworks are a class of crystalline compounds characterized by a three-dimensional network formed by metal ions and organic ligands.6 MOFs have garnered attention for their versatility and applicability in diverse fields, ranging from energy storage and gas storage to catalysis and gas separation.7–9 The properties of MOFs, such as high surface area, porosity, and availability to chemical modifications, make them good candidates for incorporation in TENG contact layers. Mostly MOFs have been reported as fillers in composites used for contact layers; however, recently, individual triboelectric properties of MOFs such as ZIF-8, MOF-74, UiO-66 and UiO-66-NH2 have been reported.10
Notably, Wang et al. have shown that the incorporation of MOF UiO-66-NH2 into the PDMS matrix increases the current output of the assembled TENG by 60 times and voltage by 4 times.11 It has been demonstrated that fluorinated MOFs increase the triboelectric properties of a series of polymers, such as polyvinylidene fluoride (PVDF), polytetrafluoroethylene (PTFE), polydimethylsiloxane (PDMS), and polyurethane (PU) upon incorporation.12 It is believed that MOFs incorporated into the polymer matrix act as charge trapping sites and additionally increase the surface roughness, thereby leading to higher generated charge density in TENG devices.
In this study, we demonstrate the triboelectric properties of the thermoplastic elastomer PEBA composites incorporating MOFs UiO-66 and UiO-66-NH2 in different contents. We show that the addition of amounts that do not exceed 5 wt % can improve the triboelectric properties. Furthermore, the addition of UiO-66-NH2 leads to the formation of a positive surface charge, while UiO-66 leads to a negative charge. The enhancement of the charge density in both cases is two orders of magnitude higher than that of pristine PEBA under the same testing conditions. The TENG constructed using the PEBA/UiO-66 composite with the highest observed charge density generated a power density of 47.8 μW cm−2, which is comparable to that developed by other MOF-polymer-based TENGs (ESI† Table S1).
Methods
Synthesis of MOFs
UiO-66 was synthesized according to a method reported in the literature.13 125.0 mg zirconium(IV) chloride was dissolved in a mixture of 1.0 mL of 12.0 M concentrated hydrochloric acid (HCl) and 5.0 mL of N,N-dimethylformamide (DMF) by sonication for 20 min. The obtained solution was added to 10.0 mL of DMF, which contained 123.0 mg of terephthalic acid (H2BDC). After mixing, the solution was heated in an oil bath at 80 °C for 8 h. The as-synthesized products were collected by centrifugation (8.8 g) for 5 min, then washed with DMF two times and with ethanol three times, and finally vacuum-dried at room temperature.UiO-66-NH2 was also synthesized according to a method reported in the literature.14 268.0 mg ZrCl4 was dissolved in a mixture of 2.0 mL of 12.0 M concentrated HCl and 20.0 mL of DMF by sonication for 20 min. The obtained solution was added to 10.0 mL of DMF that contained 250.0 mg of 2-aminoterephthalic acid. The mixture was heated in an oil bath at 80 °C for 24 h. After cooling down to room temperature, yellow residues were collected by centrifugation (8.8 g) for 5 min, rinsed with DMF and methanol three times respectively, and finally vacuum-dried at room temperature overnight.
Preparation of composites
Poly (ether-block-amide) (PEBA, Pebax 2533) pellets were obtained from Arkema. The composition of Pebax 2533 was 80 wt% poly tetramethylene oxide (PTMO) and 20 wt% polyamide 12 (PA 12) matrix. To obtain the polymer composites, a chloroform solution of PEBA (2.5 wt%) was prepared. To prepare a composite, UiO-66 or UiO-66-NH2 was dispersed in a chloroform/PEBA solution at the amount necessary to obtain polymer composites with 0.1, 0.2, 0.5, 1, 2 or 5 wt% of filler MOF. Ultrasonication (2 minutes, 40 W, Hielscher UP200St ultrasonic processor) was used to obtain a stable colloidal suspension. Afterwards, an additional amount of PEBA was dissolved in chloroform to increase the PEBA content to 5 wt%. The solution was stirred and cooled to the ambient temperature for 1 hour. Then, it was poured into a Petri dish and kept at ambient temperature for 3–4 hours until the solvent evaporated.Characterization
Powder X-ray diffraction (PXRD) patterns were collected using a Bruker D2 PHASER. Scanning electron microscopy (SEM) images were obtained using a Helios NanoLab 650 microscope with a TLD-SE detector and an acceleration voltage of 3 kV.The complex dielectric permittivity measurements of the composites were performed in the frequency range of 1 Hz to 1 MHz on heating and cooling in a wide temperature range (150 K–340 K) using an automated Solartron Analytical ModuLab XM MTS measurement system with the MTS Femto Ammeter low current measurement module. The values of the real and imaginary parts of the complex dielectric permittivity at selected frequencies were calculated from the impedance measurement data using the planar capacitor formalism. A low-loss sample holder with a protective electrode was used, and the samples were obtained by cutting 20 mm diameter discs from the prepared MOF/polymer films of 0.1–0.15 mm thickness. All measurements were carried out at natural ambient pressure and started with heating to remove water vapour adsorbed on the sample. The sample holder was heated by electric coils and cooled by nitrogen vapour, maintaining a constant temperature change rate of 1–2 K min−1 during the measurements.
The infrared spectra of the PEBA/UiO composites were obtained using a Bruker Vertex 80V Fourier transform infrared (FTIR) spectrometer in the transmittance measurement mode at room temperature, under vacuum. The spectra registration range was 400–4000 cm−1 with a resolution of – 0.2 cm−1.
Atomic force microscopy (AFM) was performed on a Veeco CPII scanning probe microscope. The topographies of the pristine PEBA polymer and PEBA/UiO-66 composite (1 wt%) layers were measured at three individual locations on the sample. The scan size for each measurement was 50 μm × 50 μm. For each measurement, the root-mean-square surface roughness was determined and used to calculate the mean value and standard deviation.
Triboelectric measurements
The PEBA/MOF contact layers were made by adhering the composite film onto the ITO electrode using an electroconductive double-sided adhesive tape. Next, the PEBA/MOF contact layers were tested against ITO electrodes in the contact–separation mode. The current generated upon contact separation was measured under the following controlled conditions: a separation distance of 5 mm, a pressing force of 10 N, and a contact–separation frequency of 1 Hz. To ensure repeatability, contact–separation was carried out using an Instron E1000 material testing machine. The generated current signals were measured using a Keithley 6514 electrometer connected to a Picoscope 5444B PC oscilloscope system. The surface charges, Q (nC), were calculated from the measured current peaks using the equation , where i is the instantaneous current (nA), and dt is the differential of time (s). Accordingly, the charge density was expressed as the charge per cm2 of the contact area between the ITO and PEBA/MOF contact layers.
TENG devices were tested using a pneumatic device from a custom-made PLC-controlled (Mitsubishi AL2-24MR-D) pneumatic system, utilizing a low friction smooth cylinder actuator (SMC MQML10) capable of producing a 16 N contact force and high translation speed (1000 mm s−1). Additionally, a Faraday cage was placed around the triboelectric testing area to eliminate parasitic signals. All samples were measured at a constant ambient relative humidity (35%). Electrical measurements were performed using a Keithley 6514 electrometer connected to a Picoscope 5444B PC oscilloscope system. In addition to the current measurements that were used for the charge calculations, the voltage outputs of TENG devices at different load resistance values were recorded. Voltage measurements were used to calculate the energy and power density per contact-separation cycle. First, the instantaneous power was calculated using P = V2/R, where V is the voltage and R is the load resistance. Accordingly, energy values were obtained as the area of the peaks when the instantaneous power was plotted as a function of time. The average power was obtained by P = E/Δt, where E is the energy and Δt is the duration of the peak. Both energy and power densities were obtained by dividing the energy and power values by the area of the contact layers. A TENG was also used to charge a 0.47 μF capacitor through a full bridge rectifier. The energy stored in the capacitor was calculated as E = 0.5CV2, where C is the capacitance of the capacitor and V is the voltage across the capacitor.
Tensile tests
Tensile tests were performed using a Zwick/Roell Z2.5 material testing machine. Three tensile specimens were cut from each of the composite films. The thickness of the film was 0.13 mm, the gage width of the specimen was 5 mm and the gage length was 10 mm. Preloading was done up to 0.05 N with a 5 mm min−1 speed. The tensile test speed was 10 mm min−1. The strain ε was calculated as ε = Δl/l0, where Δl is the extension and l0 is the gage length. Stress was determined as the tensile force acting on a cross section of the specimen (gage width × film thickness).Results and discussion
The structural features of MOFs and PEBA/MOF composites
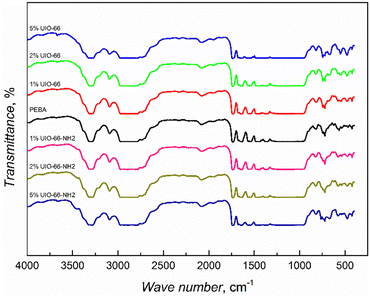
UiO-66 MOF is a porous crystal material containing zirconium oxide nodes bridged by terephthalic acid ligands, while these linkers have one additional –NH2 group in UiO-66-NH2 MOFs.13 The powder X-ray diffraction (PXRD) analysis showed that there were no significant differences between the synthesized UiO-66 and UiO-66-NH2 patterns and their simulated patterns indicated a successful synthesis process with high crystallinity and purity (ESI† Fig. S1). The SEM images (ESI† Fig. S2) revealed the well-defined morphology of the synthesized MOFs with the size variation of crystallites in the range of tens of nm.FTIR studies of the synthesized composites showed that the infrared spectra are dominated by the response of the supporting PEBA matrix (Fig. 1), as was also observed in the case of PEBA/ZIF-8 mixed matrix membranes.15 The spectra of the composites with the highest 5 wt% amounts of MOF inclusions show the appearance of an absorption band at 3670 cm−1, corresponding to the ν(OH) vibrations of UIO-66 and UIO-66-NH2 MOFs.16,17 The absorption increasing with MOF concentration was observed at 1506 cm−1 in PEBA/UIO-66 and at 765 cm−1 (N–H vibrations) in PEBA/UIO-66-NH2 composites (ESI† Fig. S3). The obtained FTIR spectra showed the successful incorporation of the MOFs, but no strong matrix/filler interactions were observed.
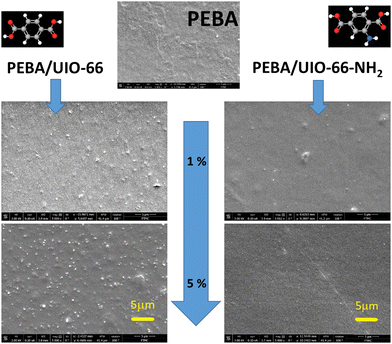
The morphologies of the prepared composite films were investigated by SEM (Fig. 2). The images of the pure PEBA sample revealed a quite smooth and defect-free surface. The PEBA/UiO-66 samples showed surface roughening with increasing MOF content due to the increased aggregation of UiO-66 nanoparticles in the polymer matrix. Despite the growth of UiO-66 agglomerates, they were well dispersed at the highest 5 wt% concentration and no huge variations in particle distribution or segregation to empty/concentrated regions on the surface were found. Additionally, AFM revealed that the MOF incorporation did not influence the overall surface roughness. For pristine PEBA, the average RMS surface roughness was 32.5 ± 9.5 nm, while for PEBA/UiO-66, the average RMS surface roughness was relatively similar (31.2 ± 7.8 nm). The AFM images of each layer are shown in ESI† Fig. S4. The SEM images of the PEBA/UiO-66-NH2 composites revealed that they were more homogeneous due to a better distribution of MOF particles; a notably larger portion of individual UiO-66-NH2 nanoparticles was dispersed in the matrix, with some of them still agglomerated in the aggregates. The surface of these composites became even smoother with an increased amount of UiO-66-NH2, contrary to the opposite trend observed for PEBA/UiO-66. The cross-sectional images suggest the same particle distribution/agglomeration tendencies throughout the bulk volume without any layering near the bottom or top of the composite films.
Temperature-dependent complex dielectric permittivity
PEBA is a thermoplastic elastomer comprising rigid polyamide (PA) and flexible polyether (PE) blocks. The hard segments are usually crystalline and play the role of cross-linking parts, while the soft segments have an amorphous structure and are characterized by high elasticity. The hard amide block or crystalline phase provides high mechanical strength, while the soft ether block or amorphous phase exhibits rubbery and elastomeric properties. The specific structure of the PEBA polymer is formed due to the development of a network of hydrogen bonds between the amide groups of the polymer.18 The real and imaginary parts of the complex dielectric permittivity of the pure PEBA film were measured in the temperature range of 150 K–340 K, where four dispersion regions with the characteristic shapes are observed (Fig. 3a and ESI† Fig. S5). At temperatures above 240 K, dispersion due to conductivity σ and glass transition of the polyamide blocks αPA is observed, freezing of the polyether blocks αPE is visible in the 210 K–220 K range, and relaxation dispersion γ caused by local fluctuations of the CH2 groups along the polymer chains occurs at the lowest temperatures.18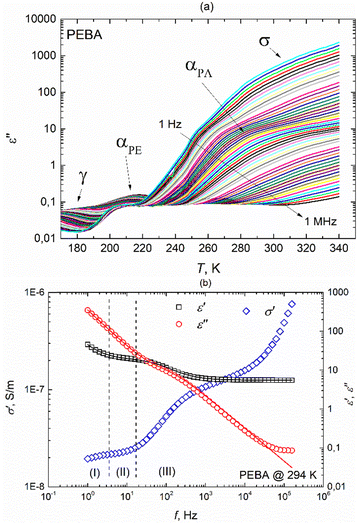 | ||
| Fig. 3 (a) Temperature dependencies of the imaginary part of the complex dielectric permittivity of the PEBA polymer during heating at different frequencies, (b) frequency dependencies of ε′, ε′′ and σ′ at a temperature of 294 K. Solid lines represent fits according to eqn (2) with an additional term accounting for M–W–S interfacial polarization in the (I) region. | ||
The frequency dependencies of the real and imaginary parts of the complex dielectric permittivity in the γ and αPA dispersion regions were described using the Havriliak–Negami (H–N) equation
 | (1) |
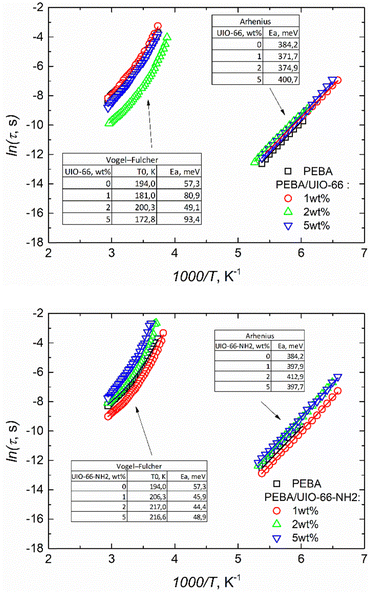
The γ relaxation process makes the smallest contribution to a static dielectric permittivity of Δε ∼0.5. It has a quite broad and asymmetric (α ∼0.5 and β ∼0.3) distribution of relaxation times, while the average relaxation time varies with temperature according to the Arrhenius law τ = τ0 exp (Ea/kT) with an activation energy Ea = 0.38 eV. At temperatures above 240 K, the dielectric response comprises several frequency-dependent processes (Fig. 3b). In the higher frequency region (III), the αPA relaxation process is superimposed on the rapid growth of ε′′ caused by electrical conductivity, which is clearly seen in the frequency range (II). Such a complex behaviour of ε* in regions (II) and (III) can be described in conjunction by adding a ε*(ω) = −i(σDC/(ε0ω))N term to the H–N equation (eqn (1)) accounting for conductivity, where σDC is the conductivity in the limit of low frequency, and N is an empirical constant according to the empirical random free-energy barrier model:19
 | (2) |
The dielectric strength Δε ∼15 of αPA relaxation is much larger than that of αPE or γ relaxation and remains almost constant in our temperature range. We obtained α ∼0.9 and β ∼1 for this process, indicating narrow and symmetrical distribution relaxation times. The mean αPA relaxation time increases with decreasing temperature according to the Vogel–Fulcher law, which is typical for glass-forming systems:
| τ = τ0exp(Ea/(k(T − T0)), | (3) |
We have obtained activation energy Ea = 57 meV and glass transition temperature T0 = 194 K values similar to those reported in Todros et al. ref. 18 for the PA subsystem. It was not possible to determine the relaxation times in the αPE dispersion region; the maximum imaginary complex dielectric permittivity of the dispersion was probably at higher frequencies and did not fall into our measurement frequency range.
The incorporation of UIO-66 and UIO-66-NH2 into the PEBA matrix only slightly affected the dielectric responses. They were dominated by the same αPA, αPE, and γ relaxation and conductivity dispersion regions as those in the empty PEBA matrix (ESI† Fig. S6). The obtained frequency dependencies of the real and imaginary parts of the complex dielectric permittivity of PEBA/UIO-66 and PEBA/UIO-66-NH2 1 wt%, 2 wt% and 5 wt% composites in the αPA and γ relaxation dispersion regions were approximated using the same H–N formalism (2). The relaxation times of the γ process (movement of CH2 groups in the polymer) vary according to the Arrhenius law in all composites, and the activation energy (≈ 0.4 eV) practically does not depend on the amount of MOFs in the samples. On the contrary, a strong influence of UIO-66 MOF impurities was observed on the freezing (vitrification) dynamics of PA blocks. By increasing the amount of MOFs in the PEBA/UIO-66 composites, the freezing temperature of the PA blocks decreases from 194 K to ≈172 K, while that of PEBA/UIO-66-NH2 increases to ≈217 K (Fig. 4). Changes in the transition to the glass phase (freezing) temperature in polymer/nanoparticle composites are usually caused by the different strengths of the interaction between the matrix and the filler particles (in the case of weak interaction, T0 decreases and vice versa). Molecular dynamics simulations have shown21 that the glass transition temperature TG of the composite can be shifted to either higher or lower temperatures by tuning the interactions between the polymer and nanoparticles. In the case of attractive interactions between the polymer and the nanoparticles, the polymer chain relaxation time is increased and leads to a higher TG relative to that of the pure system.22 Therefore, in our case, the increase of T0 in PEBA/UIO-66-NH2 can be considered a clear indication of a stronger interaction of MOF linkers modified with –NH2 groups with the PA blocks of the supporting PEBA matrix, which probably occurs due to the formation of additional hydrogen bonds. Enhancement of hydrogen bonding frameworks between UiO-66-NH2 and PEBA leading to improved dispersibility of these MOFs in the polymer matrix was also reported by J. Shen,23 which coincides with the SEM observations of our composites (Fig. 2).
Dielectric characteristics at room temperature
The harvest mechanical energy of TENGs by coupling contact electrification and electrostatic induction is mainly affected by the charge-inducing ability (surface properties) and charge-trapping capability (dielectric properties) of triboelectric materials.24,25 The working principle of contact-separation TENGs can be described using a planar capacitor model, where the nanogenerator acts as a combination of a polymer capacitor and a variable air capacitor connected in series. The voltage of such a structure, which drives electrons to flow through the external load while changing the air gap distance x(t), can be calculated as follows:24 | (4) |
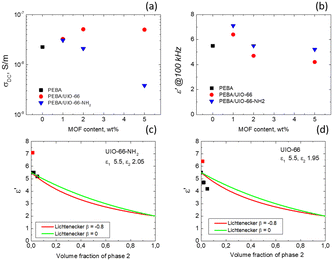
| εβ = Xε1β + (1 − X)ε2β, −1 ≤ β ≤ 1, | (5) |
| ln(ε) = Xln(ε1) + (1 − X)ln(ε2) | (6) |
The experimental data were fitted using β values of 0 and −0.8 (Fig. 5c and d). Notably, UiO-66-NH2 demonstrates strong conformity with the Lichtenecker model (except at a concentration of 1%) when β is set to 0, signifying a well-blended integration of MOF crystallites within the polymer. However, for UiO-66, a distinct trend emerges as the experimental values fall below the theoretical curves. This suggests that the dielectric permittivity at 100 kHz in our composites at room temperature results not only from a simple volume mixing of two different dielectric media, but also from the filler matrix interaction, which probably also alters the contribution of the other relaxation processes (at frequencies higher than 1 MHz) to the static dielectric permittivity.
Triboelectric surface charge density
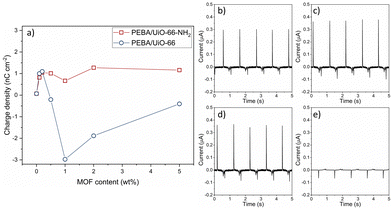
The charge was measured by contacting ITO vs. the polymer in the contact–separation mode and measuring the current against the ground. Pristine PEBA shows a positive triboelectric surface charge density of 0.07 nC cm−2. The PEBA polymer is a positive triboelectric material because of one of its constituents, nitrogen-containing polyamide, which on its own is categorized as a highly positively charged triboelectric material.32 The MOFs UiO-66 and UiO-66-NH2 tend to charge negatively in contact with metals.10 The addition of both MOF particles at concentrations below 0.5 wt% increases the positive triboelectric charge density up to 1.1 nC cm−2 (Fig. 6). Both UiO-66 and UiO-66-NH2 show similar enhancements. When the concentration increases above 0.5 wt%, the PEBA/UiO-66 composite starts to charge negatively, but with increasing UiO-66-NH2 amount, the composites remain positively charged. The magnitude of the negative triboelectric surface charge increases to high values, −2.98 nC cm−2, which is two orders of magnitude higher than that of pristine PEBA. The current peaks used to calculate the charge density are shown in ESI† Fig. S7 and S18. In comparison, the charge densities of PTFE and PDMS under the same testing conditions are merely 0.05 nC cm−2 and 0.06 nC cm−2, respectively.33 Even a higher current can be measured at a faster separation; the polymer composites PEBA/UiO-66 1 wt% and PEBA/UiO-66-NH2 2 wt% were used to assemble TENG devices with ITO as the counter electrode and tested by rapid contact–separation tests using a custom-made pneumatic device. The TENG using a PEBA/UiO-66-NH2 composite demonstrated a peak-to-peak current of 1.1 μA while the TENG with the PEBA/UiO-66 composite reached two times higher value, 2.25 μA (ESI† Fig. S19 and S20).To test whether the observed effect is due to matrix–filler interactions in the composite or arise only from MOF particles that are closer to the surface, we tested contact layers in which pristine PEBA was covered by MOF. Here, the MOF suspension in chloroform was spin-coated directly onto the PEBA film. During spin-coating, chloroform partially solutes the surface of PEBA and allows MOF particles to tightly grip to the surface in order to obtain a uniformly exposed MOF particle coating on the polymer (ESI† Fig. S21). The layered films were contact-separated with ITO under the same testing conditions and the charge densities were −0.16 nC cm−2 and −0.03 nC cm−2 for UiO-66-NH2 and UiO-66 coatings, respectively (current peaks shown in ESI† Fig. S22 and S23). Accordingly, since the density of MOFs on the surface in layered samples was even higher than that in composites, we can conclude that changes in charge polarity must be tied to matrix–filler interactions in the composite.
Dispersed rigid nanoparticles can serve two purposes: adding heterogeneity to the deformability of polymer composites and acting as stress concentration sites during the TENG contact–separation operation.25 We have shown before that softer polymers tend to gain negative net surface charges while hard polymers tend to gain positive charges. The physicomechanical properties of polymers change their deformation properties. The regions under compression tend to transfer positive surface charges, while soft regions undergo stretching and tend to gain negative surface charges. This can be explained by the change of the desorption energies of organoions over stretched/compressed regions.34 While the addition of MOF particles may cause an increase in the modulus of the polymer, the influence is small. The tensile modulus of pristine PEBA is 12 MPa, while those of the composites, PEBA/UiO-66 (1 wt%) and PEBA/UiO-66-NH2 (2 wt%), with the highest charge densities, are only slightly higher: −16.2 ± 2.3 MPa and 14.8 ± 1.6 MPa, respectively. The tensile modulus was determined from the stress–strain curves obtained from the tensile tests (ESI† Fig. S24 and S25). This indicates that MOF particles do not significantly alter the mechanical properties in bulk but cause local stress accumulation on the surface, which in turn reduces the energy for covalent bond break and enhances mass (charged organoion) transfer.35
Both composites that showed the highest charge values, PEBA/UiO-66 1 wt% and PEBA/UiO-66-NH2 2 wt%, were tested against the PTFE, PDMS, PS, PMMA and PET polymers to determine their placement in the triboelectric series. Pristine PEBA has previously been shown to be placed in the same polymer series between PDMS and PS. The results of the composite contact separation with the aforementioned polymers revealed that PEBA/UiO-66-NH2 2 wt% charged negatively only after contact with PTFE, while PEBA/UiO-66 1 wt% charged positively after contact with all of the tested polymers (Fig. 7a). Accordingly, the resulting triboelectric series is shown in Fig. 7b.
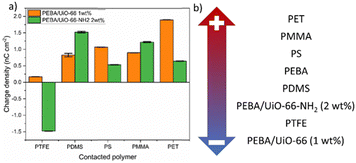 | ||
| Fig. 7 (a) Charge densities and polarities of the PEBA/UiO-66 (1 wt%) and (b) PEBA/UiO-66-NH2 (2 wt%) composite films against a series of polymers. | ||
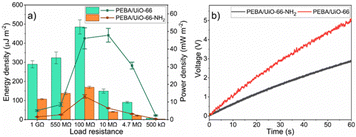
In order to explore energy-harvesting possibilities of TENG devices based on PEBA/MOF composites, the voltages at various load resistance values were measured. For the PEBA/UiO-66-NH2- and PEBA/UiO-66 composite-based TENGs, the maximum open-circuit voltage values of 60 V and 100 V were achieved, respectively (ESI† Fig. S26–S38). The voltage values at specific load resistances were used to calculate the energy and power densities of the tested TENG devices. For both TENG devices, the highest energies were obtained when they were tested at a load resistance of 100 MΩ. In the case of PEBA/UiO-66, the energy density was 485.1 ± 36.9 μJ m−2 while that for PEBA/UiO-66-NH2 was 169.0 ± 6.0 μJ m−2 (Fig. 8a). For the aforementioned TENG devices, the optimal load resistance values were 10 MΩ and 100 MΩ, respectively, since the highest power densities were achieved at these values. The power density of PEBA/UiO-66-NH2-based TENG reached 13.1 ± 1.0 μW cm−2 but for PEBA/UiO-66, the highest power density was more than three times higher, 47.8 ± 3.9 μW cm−2.
Next, both TENG devices were used to charge a capacitor with a capacitance of 0.47 μF. A full bridge rectifier was used to convert the AC signal generated by the TENG into a DC, as depicted in ESI† Fig. S39. Notably, during 1 minute of contact separation, the TENG device based on PEBA/UiO-66 charged the capacitor to 5 V, which corresponds to 5.9 μJ of stored energy (Fig. 8 b). In comparison, the device built using PEBA/UiO-66-NH2 charged the same capacitor to only 2.9 V, corresponding to 2.0 μJ. Evidently, the PEBA/UiO-66-based TENG, during 1 minute of operation, stored energy that would be sufficient to power a variety of IoT sensors (temperature, light, proximity) in both active and sleep modes.
Conclusions
The synthesized 0.1–5 wt% PEBA/UiO-66 and PEBA/UiO-66-NH2 composites exhibit better triboelectric properties than the pure PEBA polymer. Modification of the UIO-66 linkers allows tuning of the triboelectric performance of these composites by choosing an appropriate concentration of the corresponding filler MOFs. PEBA/UiO-66-NH2 composites remain positively charged at all investigated concentrations due to a stronger MOF/matrix interaction, which results in the homogeneous dispersion of filler particles. UiO-66 crystallites tend to agglomerate to larger formations, increasing the surface roughness and local stress accumulation on the surface; therefore, the PEBA/UiO-66 composite films show a sudden change of the triboelectric surface charging from positive to negative between 0.5 wt% and 1 wt%.Author contributions
Linards Lapčinskis: created visual representations of the research data and drafted the research manuscript. Andris Šutka, Martynas Kinka, and Fa-Kuen Shieh: ensured the accuracy and integrity of the research, performed statistical analyses, and contributed to the manuscript. Līva Ģērmane and Artis Linarts: actively involved in surveys, experiments, and data collection during the execution of the research. Sergejus Balčiūnas and Robertas Grigalaitis: oversaw and guided the research project.Conflicts of interest
There are no conflicts to declare.Acknowledgements
This work was funded by the Latvian-Lithuanian-Taiwan Scientific Cooperation Support Fund (LV-LT-TW/2021/3) represented by the Research Council of Lithuania (Project Nr. S-LLT-21-2), Latvian Council of Science (Project No. 03000-3.1.2.1-e/3) and National Science and Technology Council, Taiwan (110-2923-M-008-002-MY3).Notes and references
- R. Lei, Y. Shi, Y. Ding, J. Nie, S. Li, F. Wang, H. Zhai, X. Chen and Z. L. Wang, Energy Environ. Sci., 2020, 13, 2178–2190 RSC.
- S. Cui, Y. Zheng, T. Zhang, D. Wang, F. Zhou and W. Liu, Nano Energy, 2018, 49, 31–39 CrossRef CAS.
- X. Zhang, X. Du, Y. Yin, N.-W. Li, W. Fan, R. Cao, W. Xu, C. Zhang and C. Li, ACS Appl. Mater. Interfaces, 2018, 10, 8676–8684 CrossRef CAS PubMed.
- H. Zou, Y. Zhang, L. Guo, P. Wang, X. He, G. Dai, H. Zheng, C. Chen, A. C. Wang, C. Xu and Z. L. Wang, Nat. Commun., 2019, 10, 1427 CrossRef PubMed.
- W. He, X. Fu, D. Zhang, Q. Zhang, K. Zhuo, Z. Yuan and R. Ma, Nano Energy, 2021, 84, 105880 CrossRef CAS.
- V. F. Yusuf, N. I. Malek and S. K. Kailasa, ACS Omega, 2022, 7, 44507–44531 CrossRef CAS PubMed.
- Q. Qian, P. A. Asinger, M. J. Lee, G. Han, K. Mizrahi Rodriguez, S. Lin, F. M. Benedetti, A. X. Wu, W. S. Chi and Z. P. Smith, Chem. Rev., 2020, 120, 8161–8266 CrossRef CAS PubMed.
- H. Li, L. Li, R.-B. Lin, W. Zhou, Z. Zhang, S. Xiang and B. Chen, EnergyChem, 2019, 1, 100006 CrossRef.
- Y. Zhao, Z. Song, X. Li, Q. Sun, N. Cheng, S. Lawes and X. Sun, Energy Storage Mater., 2016, 2, 35–62 CrossRef.
- A. Šutka, F.-K. Shieh, M. Kinka, L. Lapčinskis, C.-C. Chang, P. K. Lam, K. Pudzs and O. Verners, RSC Adv., 2023, 13, 41–46 RSC.
- Y.-M. Wang, X. Zhang, D. Yang, L. Wu, J. Zhang, T. Lei and R. Yang, Nanotechnology, 2021, 33, 065402 CrossRef PubMed.
- Y. Guo, Y. Cao, Z. Chen, R. Li, W. Gong, W. Yang, Q. Zhang and H. Wang, Nano Energy, 2020, 70, 104517 CrossRef CAS.
- Y.-H. Huang, W.-S. Lo, Y.-W. Kuo, W.-J. Chen, C.-H. Lin and F.-K. Shieh, Chem. Commun., 2017, 53, 5818–5821 RSC.
- J. Shi, F. Chen, L. Hou, G. Li, Y. Li, X. Guan, H. Liu and L. Guo, Appl. Catal., B, 2021, 280, 119385 CrossRef CAS.
- Y. X. Xue, F. F. Dai, Q. Yang, J. H. Chen, Q. J. Lin, L. J. Fang and W. W. Lin, ACS Omega, 2022, 7, 23467–23478 CrossRef CAS PubMed.
- C. Atzori, K. A. Lomachenko, J. Jacobsen, N. Stock, A. Damin, F. Bonino and S. Bordiga, Dalton Trans., 2020, 49, 5794–5797 RSC.
- I. Strauss, K. Chakarova, A. Mundstock, M. Mihaylov, K. Hadjiivanov, N. Guschanski and J. Caro, Microporous Mesoporous Mater., 2020, 302, 110227 CrossRef CAS.
- S. Todros, A. N. Natali, M. Piga, G. A. Giffin, G. Pace and V. Di Noto, Polym. Degrad. Stab., 2013, 98, 1126–1137 CrossRef CAS.
- J. C. Dyre, J. Appl. Phys., 1988, 64, 2456–2468 CrossRef.
- M. Samet, V. Levchenko, G. Boiteux, G. Seytre, A. Kallel and A. Serghei, J. Chem. Phys., 2015, 142, 194703 CrossRef CAS PubMed.
- F. W. Starr, T. B. Schrøder and S. C. Glotzer, Macromolecules, 2002, 35, 4481–4492 CrossRef CAS.
- V. Samulionis, J. Macutkevic, J. Banys, J. Belovickis and O. Shenderova, IOP Conf. Ser.: Mater. Sci. Eng., 2015, 87, 012010 Search PubMed.
- J. Shen, G. Liu, K. Huang, Q. Li, K. Guan, Y. Li and W. Jin, J. Membr. Sci., 2016, 513, 155–165 CrossRef CAS.
- X. Tao, X. Chen and Z. L. Wang, Energy Environ. Sci., 2023, 16, 3654–3678 RSC.
- A. Šutka, L. Lapčinskis, D. He, H. Kim, J. D. Berry, J. Bai, M. Knite, A. V. Ellis, C. K. Jeong and P. C. Sherrell, Adv. Mater. Int., 2023, 10, 2300323 CrossRef.
- S. Sorbara, S. Mukherjee, A. Schneemann, R. A. Fischer and P. Macchi, Chem. Commun., 2022, 58, 12823–12826 RSC.
- S. Balčiūnas, D. Pavlovaitė, M. Kinka, J.-Y. Yeh, P.-C. Han, F.-K. Shieh, K. C.-W. Wu, M. Šimėnas, R. Grigalaitis and J. Banys, Molecules, 2020, 25, 1962 CrossRef PubMed.
- Z. Hashin and S. Shtrikman, J. Appl. Phys., 1962, 33, 3125–3131 CrossRef CAS.
- N. J. Kidner, N. H. Perry, T. O. Mason and E. J. Garboczi, J. Am. Ceram. Soc., 2008, 91, 1733–1746 CrossRef CAS.
- K. Licktenecker, Phys. Z., 1926, 27, 115–158 Search PubMed.
- A. Goncharenko, V. Lozovski and E. Venger, Opt. Commun., 2000, 174, 19–32 CrossRef CAS.
- S. A. Graham, H. Patnam, P. Manchi, M. V. Paranjape and J. S. Yu, Int. J. Energy Res., 2022, 46, 17391–17403 CrossRef CAS.
- A. Šutka, K. Mālnieks, L. Lapčinskis, P. Kaufelde, A. Linarts, A. Bērziņa, R. Zābels, V. Jurķāns, I. Gorņevs, J. Blūms and M. Knite, Energy Environ. Sci., 2019, 12, 2417–2421 RSC.
- O. Verners, L. Lapčinskis, L. Ģermane, A. Kasikov, M. Timusk, K. Pudzs, A. V. Ellis, P. C. Sherrell and A. Šutka, Nano Energy, 2022, 104, 107914 CrossRef CAS.
- A. Šutka, L. Lapčinskis, O. Verners, L. Ģērmane, K. Smits, A. Pludons, S. Gaidukovs, I. Jerāne, M. Zubkins, K. Pudzs, P. C. Sherrell and J. Blums, Adv Mater. Technol., 2022, 7, 2200162 CrossRef.
Footnote |
| † Electronic supplementary information (ESI) available: Fig. S1–S38, Table S1. See DOI: https://doi.org/10.1039/d3ma01172k |
| This journal is © The Royal Society of Chemistry 2024 |

